Download presentation
Presentation is loading. Please wait.

1
Measurement of the top quark production cross section and search for the SM Higgs boson in dilepton final states with the CMS detector at the LHC pp collider at √s= 7 TeV Defensa de la tesis para optar al grado de Doctor presentada por Patricia Lobelle Pardo Dirigida por Dr. Javier Cuevas Maestro Santander, 21 de Julio de 2011

2
Standard Model, top, Higgs LHC and CMS Object reconstruction Top quark production cross section Search for SM Higgs boson Conclusions Outline 2

3
Standard Model 3 Origin of mass /origin of electroweak symmetry breaking Higgs? unification of forces fundamental symmetry of forces and matter where is antimatter unification of quantum physics and general relativity number of space/time dimensions what is dark matter what is dark energy quarksleptons Matter composed of fermions (quarks, leptons) bosons Interacting via force carriers (bosons) Succesfully explains experimental data to date … still many open questions
 bosons Interacting via force carriers (bosons) Succesfully explains experimental data to date … still many open questions.")
4
Top/Higgs boson at 7 TeV 4 TevatronLHC Ttbar dilepton candidate

5
Introduction Study of processes containing 2 leptons (electrons/muons) + MET + 0/2 jets - ttbar production cross section - Search for SM Higgs H WW 2 lepton physics is an important part of the CMS analysis program SM processes and new physics produce dilepton final states In this thesis: Background for many new physics searches Clear signature, easier to observe at an earlier stage… Understand the SM backgrounds before measuring any signal of new physics One of the most sensitive channels at LHC 5
 + MET + 0/2 jets - ttbar production cross section - Search for SM Higgs H WW 2 lepton physics is an important part of the CMS analysis program SM processes and new physics produce dilepton final states In this thesis: Background for many new physics searches Clear signature, easier to observe at an earlier stage… Understand the SM backgrounds before measuring any signal of new physics One of the most sensitive channels at LHC 5")
6
Introduction 2010 data Thesis focuses on measurements done with 2010 data Analysis strategies defined before the data taking, result of many detailed studies, improvements in the detector knowledge… and adapted to different Ecm scenarios planned for the LHC startup 14 TeV 10 TeV 6

7
LHC and CMS

8
LHC Proton-proton collider at CERN Design √s = 14 TeV Several experiments ATLAS, CMS, LHCb, ALICE 8 Proton-proton collisions at √s = 7 TeV From 30th March – 6th November 2010 (initial tests & physics at √s =0.9,2.36 TeV by end 2009) Pb-Pb collisions at 2.76 TeV/nucleon 8th November – 16th Dec 2010
 Pb-Pb collisions at 2.76 TeV/nucleon 8th November – 16th Dec 2010")
9
CMS Top/Higgs analysis require excellent performance of the whole detector to efficiently reconstruct – Muons – Electrons – Jets – Missing Transverse Energy (MET) – b quark jet tagging Tracker Tracker: all-silicon, large solid angle coverage | |<2.4, excellent position and momentum resolution ECAL ECAL: homogeneous, crystal (PbWO4) calorimeter, highly segmented, excelent energy resolution HCAL HCAL: scintillators/brass, | |<5 Muon system Muon system: DT, RPC,CSC 9
 – b quark jet tagging Tracker Tracker: all-silicon, large solid angle coverage | |<2.4, excellent position and momentum resolution ECAL ECAL: homogeneous, crystal (PbWO4) calorimeter, highly segmented, excelent energy resolution HCAL HCAL: scintillators/brass, | |<5 Muon system Muon system: DT, RPC,CSC 9")
10
Object definition

11
Muons Muon Reconstruction : – Standalone : information from muon system only – Global: information from muon system & tracker 11 – Global muons: starting from standalone muon, search for compatible tracks in the tracker system – Tracker muons: starting from all the tracks in the tracker, associate to segments in the muon system Muon Identification: Quality requirements on reconstructed muons Quality of the track fit, number of good reconstructed hits in tracker and muon chambers… - Prompt muons are produced close to the PV cut on impact parameter (IP) Muon Isolation: Sum of tracks pt, ECAL hits ET, HCAL hits ET in a cone around muon required to be smaller than a given threshold Iso = (SumPt_tracks + SumET_ECAL + SumET_HCAL)/pt
 Muon Isolation: Sum of tracks pt, ECAL hits ET, HCAL hits ET in a cone around muon required to be smaller than a given threshold Iso = (SumPt_tracks + SumET_ECAL + SumET_HCAL)/pt")
12
Electrons Reconstruction —Energy depositions in ECAL matched to tracks in tracker Identification : select prompt electrons and reject fakes — Based on shower properties, track-cluster matching, H/E … Two approaches for electron seeding: - ECAL driven: Starting from ECAL superclusters and search for compatible hits in the tracker inner layers - Tracker driven: Use all tracks as starting point Rejection of electrons from conversions: - Impact parameter - Missing hits - Partner conversion track Dist (distance of closest approach of both trackes in phi plane), Dcot( ) 12 Isolation: Sum of tracks pT, ECAL hits ET, HCAL hits ET in a cone around electron required to be smaller than a given threshold Iso = (SumPt_tracks + SumET_ECAL + SumET_HCAL)/pt
, Dcot( ) 12 Isolation: Sum of tracks pT, ECAL hits ET, HCAL hits ET in a cone around electron required to be smaller than a given threshold Iso = (SumPt_tracks + SumET_ECAL + SumET_HCAL)/pt")
13
Jets Experimental signatures of quarks and gluons Jets are corrected for non-linearity and inhomogeneity of calorimeter response JES most important uncertainty related to jets — Calorimeter Jets (CaloJet): From energy depositions in HCAL & ECAL — Jet Plus Tracks (JPT): CaloJets corrected by momentum of charged tracks in tracker —Particle Flow Jets(PF): Information from all sub-detector used to reconstruct all particles in the event —Track Jets (TJ): from tracks only Hadrons detected as clusters of energies in calorimeter, gathered together by Jet Algorithms to deduce the four momentum of the parent parton — Anti kT with a cone R=0.5 standard algorithm in CMS 13
: From energy depositions in HCAL & ECAL — Jet Plus Tracks (JPT): CaloJets corrected by momentum of charged tracks in tracker —Particle Flow Jets(PF): Information from all sub-detector used to reconstruct all particles in the event —Track Jets (TJ): from tracks only Hadrons detected as clusters of energies in calorimeter, gathered together by Jet Algorithms to deduce the four momentum of the parent parton — Anti kT with a cone R=0.5 standard algorithm in CMS 13")
14
b-tagging Several algorithms discriminants sensitive to the flavour content of the jet IP-based — Track Counting based on track IP -2nd highest IP significance in jet: High Efficiency -3rd highest high purity — Jet Probability: probability that the given set of tracks come from P.V. SV Simple Secondary Vertex — Simple Secondary Vertex: based on reconstruction of a secondary Vertex in a jet. -Discriminator is flight distance significance. Exploit properties of b-quarks: - Lifetime: ~1.5 ps decay length ~1.8mm (at 20GeV) Secondary decay vertex, displaced tracks with large IP Tagging efficiencies measured in data and MC data/MC scale factors consistent with 1 within 10-20% 14
 Secondary decay vertex, displaced tracks with large IP Tagging efficiencies measured in data and MC data/MC scale factors consistent with 1 within 10-20% 14.")
15
Missing E T Imbalanced transverse energy in the event Signature of only weakly or non-interacting particles — CaloMET: depositions in ECAL+ HCAL — tcMET: expected energy depositions of good tracks of charged hadrons replaced with their corresponding momentum — PFMET: computed from the list of individually reconstructed particles in the event, combining all subdetector information —Caused by real undetected particles, mis-measured jets, detector effects… Crucial object for many measurements needs to be very well understood 15

16
Reached instantaneous luminosity peak 2e32 Hz/cm 2 2010 LHC Run 43 pb -1 recorded by CMS 47 pb -1 of pp collision data at 7 TeV delivered by the LHC 43 pb -1 recorded by CMS Average fraction of operational channels per CMS sub-system>99% Overall data taking efficiencies ~92% Excellent detector performance Many SM measurements Only highest quality data used for physics analyses ~ 85% Full 2010 data sample: 36 pb -1 16

17
SM re-discovery at 7 TeV 17

18
Top cross section measurement Motivation Top production and decay Top dilepton signal topology and event selection Measurement with 3 pb -1 Measurement with 36 pb-1 Yields Lepton efficiency determination Data-driven background estimation Systematic uncertainties Cross-section

19
Top Quark Physics Special role in the EWK sector and in QCD — Heaviest known elementary particle — Top and W masses constrain Higgs mass — Short lifetime: unique window on bare quarks A tool for precise SM studies Special role in various SM extensions through EWSB — New physics might be preferentially coupled to top — Non-standard couplings between top and gauge bosons — New particles can produce/decay to tops Sensitive probe to new physics A major source of background for many searches (Higgs, SUSY…) A tool to understand/calibrate the detector, all sub- detectors involved 19
 A tool to understand/calibrate the detector, all sub- detectors involved 19")
20
Top quark production Top quark pairs produced in strong interaction Top quark pairs produced in strong interaction via dominant mode at LHC gluon-gluon fusion dominant mode at LHC Quark- antiquark annihilation Single top Single top quarks produced via EWK interaction: t-channel, s-channel, tW-channel s-channel t-channeltW-channel 20

21
Top quark decay BR(t Wb)≈100% In SM top decays almost exclusively to W and b o Dilepton channel o Fully hadronic channel o Lepton+jets channel Different signatures according to the W decay Different signatures according to the W decay: 21
≈100% In SM top decays almost exclusively to W and b o Dilepton channel o Fully hadronic channel o Lepton+jets channel Different signatures according to the W decay Different signatures according to the W decay: 21")
22
Top dilepton topology Main backgrounds: — Drell-Yan no genuine MET — Diboson: WW,WZ,ZZ small hadronic activity — W+jets one isolated lepton — Single top –tW one b-jet 2 prompt leptons from W decay: high pT, opposite charged, isolated MET from the undetected neutrinos 2 b-jets ttDYW+jetsWWtW (pb) 157.530483131442.910.6 Most physics objects are used 22
 Most physics objects are used 22")
23
Muons p T >20 GeV, | |<2.4 -ID: globalMuon, trackerMuon, IP 10, chi2<10 - Iso<0.15 Electrons p T >20 GeV, | |<2.5 EcalDriven, eID 90% efficient for e from Ws, IP<0.04 cm, Iso <0.15 Trigger Jet selection MET selection b-tag selection muon and electron triggers Lepton pair selection At least 2 PFJets with corrected p T >30 GeV, | |<2.5, Away from selected leptons Z veto Analysis flow | |M ll -M z |>15 ee/ At least 1 b-tagged jet Track Counting High Efficiency discriminator Loose point: 1.7 23 PFMET> PFMET> 30 GeV ee/

24
Top cross section with 3 pb -1 First cross section measurement already possible with only 3 pb -1 Full selection applied: —2 leptons, Z-bosonVeto:|M(ll)-M(Z)|>15 GeV — MET >30 (20) GeV in ee,mm, (em) —N(jets)≥2 DY and fake lepton backgrounds estimated from data 11 candidates ( 3 ee, 3 mm, 5 em) observed in data o Signal selection Lepton selection: 4.4% Energy Scale: 3.7% Theoretical : 2.8% Backgrounds 11% Luminosity 11% 6.4% Systematic uncertainties on xs 24
-M(Z)|>15 GeV — MET >30 (20) GeV in ee,mm, (em) —N(jets)≥2 DY and fake lepton backgrounds estimated from data 11 candidates ( 3 ee, 3 mm, 5 em) observed in data o Signal selection Lepton selection: 4.4% Energy Scale: 3.7% Theoretical : 2.8% Backgrounds 11% Luminosity 11% 6.4% Systematic uncertainties on xs 24")
25
First top cross section measurement at LHC σ(pp → t¯t) = 194 ± 72(stat.) ± 24(syst.) ± 21(lumi.) pb Consistent with NLO prediction of 157.5 (+23.2 −24.4) pb for a top quark mass of m t = 172.5 GeV/c 2 Top cross section with 3 pb -1 b-quark content of the selected sample studied consistent with ttbar production 25
 = 194 ± 72(stat.) ± 24(syst.) ± 21(lumi.) pb Consistent with NLO prediction of (+23.2 −24.4) pb for a top quark mass of m t = GeV/c 2 Top cross section with 3 pb -1 b-quark content of the selected sample studied consistent with ttbar production 25")
26
ee Expected and observed events 36 pb -1 ee 26

27
Data/MC comparison 27

28
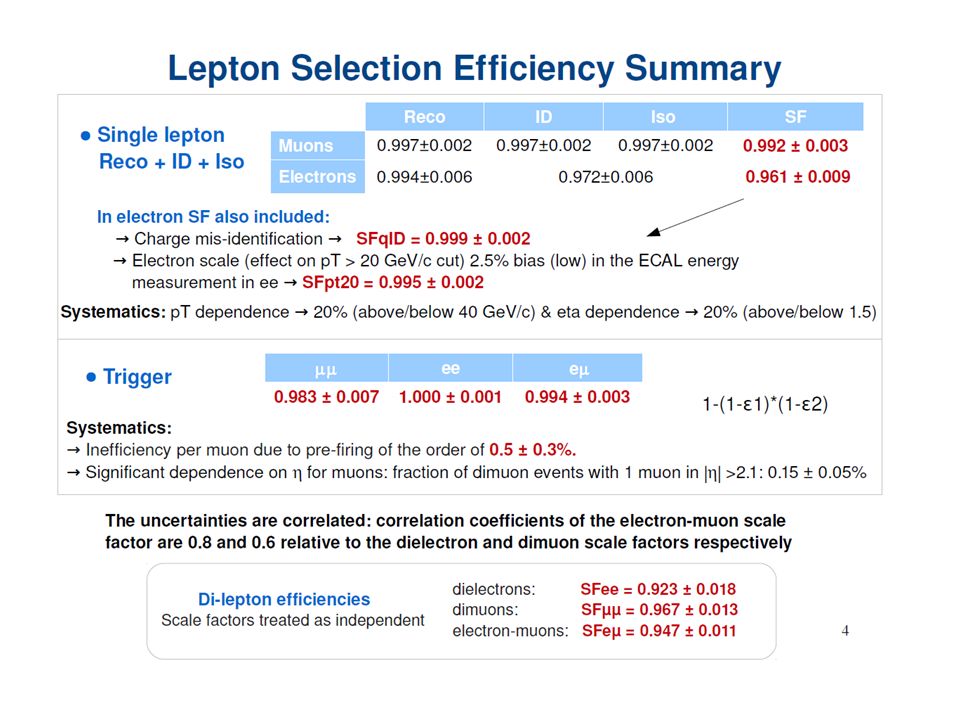
Lepton efficiencies Tag and Probe m o Lepton efficiencies ( Reco, ID, ISO, trigger) measured using Tag and Probe method Efficiencies estimated in data and MC Scale factors extracted An unbiased and pure sample of leptons is selected using Z ll events — One lepton is required to pass a tight selection ( “tag” ) — The other lepton (“probe”) needs to satisfy only loose selection — Tag & probe pairs required to be consistent with Z to ensure the purity of the probe sample Probe leptons used to measure the efficiencies required to pass the cuts of a given selection whose efficiency has to be measured 28 -Muon RECO/ID/ISO efficiencies ~99% - Electron RECO/ID/ISO ~ 99% /85-95%/98% -Trigger efficiencies > 97%, (99%) mm (ee/em) SF ee = 0.923 ± 0.018, SF = 0.967 ± 0.013, SF e = 0.947 ± 0.011
 measured using Tag and Probe method Efficiencies estimated in data and MC Scale factors extracted An unbiased and pure sample of leptons is selected using Z ll events — One lepton is required to pass a tight selection ( tag ) — The other lepton ( probe ) needs to satisfy only loose selection — Tag & probe pairs required to be consistent with Z to ensure the purity of the probe sample Probe leptons used to measure the efficiencies required to pass the cuts of a given selection whose efficiency has to be measured 28 -Muon RECO/ID/ISO efficiencies ~99% - Electron RECO/ID/ISO ~ 99% /85-95%/98% -Trigger efficiencies > 97%, (99%) mm (ee/em) SF ee = ± 0.018, SF = ± 0.013, SF e = ± 0.011")
29
Background estimation: Drell-Yan Non-DY contribution subtracted using emu events and correcting for differences between e and 76<m ll <106 Off-peak DY events are one of the main sources of background Come from mismeasured MET from jets/leptons Events outside the control region can be estimated from events inside in data, correcting by a scale factor 29

30
Data-driven estimate : 2.6 ± 1.2 (stats) ± 1.3 (sys.) ee: 0.7 ± 0.6 (stats) ± 0.3 (sys.) Systematic uncertainty comes from the variation of Rout/in with the MET cut 50% Background estimation: Drell-Yan 30 ee>= 2 jetsMET>30>=1BTAG DY MC35.8±1.21.7±0.20.48±0.1 DY data-driven34.2±2.42.8±0.90.66±0.6 Rout/in0.118±0.0040.12±0.020.10±0.04 mm>= 2 jetsMET>30>=1BTAG DY MC43.6±1.43.6±0.41.1±0.2 DY data-driven49.2±3.08.1±22.6±1.2 Rout/in0.121±0.0040.23±0.020.18±0.04
 ± 1.3 (sys.) ee: 0.7 ± 0.6 (stats) ± 0.3 (sys.) Systematic uncertainty comes from the variation of Rout/in with the MET cut 50% Background estimation: Drell-Yan 30 ee>= 2 jetsMET>30>=1BTAG DY MC35.8±1.21.7± ±0.1 DY data-driven34.2±2.42.8± ±0.6 Rout/in0.118± ± ±0.04 mm>= 2 jetsMET>30>=1BTAG DY MC43.6±1.43.6±0.41.1±0.2 DY data-driven49.2±3.08.1±22.6±1.2 Rout/in0.121± ± ±0.04")
31
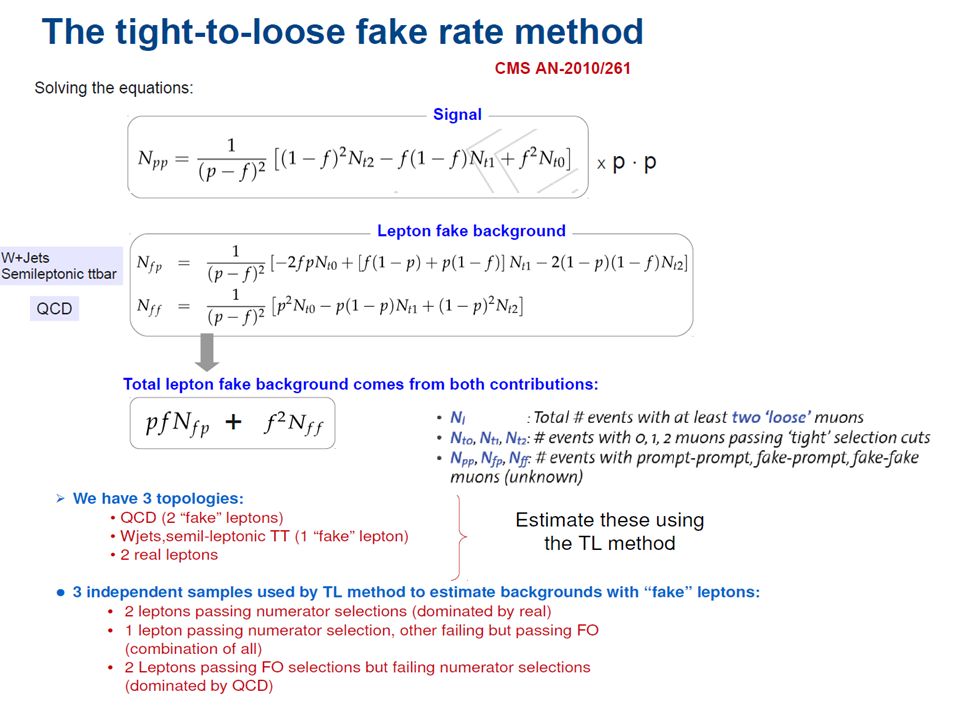
Events with “fake” leptons (W+Jets, QCD and semi-leptonic tt events where a lepton does not come from the decay of a W) constitute a background difficult to predict Estimates of such events are based on weighted counting of leptons failing tight selections but passing looser fakeable object (FO) selections. Tight-to-Loose (TL) ratio probability of a fakeable object (FO) to pass the full analysis selection. Computed in a QCD-dominated sample: To estimate bkgs with fake leptons TL ratio applied to sample with -2 leptons passing numerator selections ( dominated by real) -1 lepton passing numerator selection, other failing (combination of all) -2 leptons failing numerator selection (dominated by QCD) Background estimation: Fake leptons 31 EventsSimulationData mumu0.07±0.020.07±0.07±0.02 ee0.35±0.040.13±0.10±0.07 emu0.99±0.420.68±0.21±0.34
 ratio probability of a fakeable object (FO) to pass the full analysis selection. Computed in a QCD-dominated sample: To estimate bkgs with fake leptons TL ratio applied to sample with -2 leptons passing numerator selections ( dominated by real) -1 lepton passing numerator selection, other failing (combination of all) -2 leptons failing numerator selection (dominated by QCD) Background estimation: Fake leptons 31 EventsSimulationData mumu0.07± ±0.07±0.02 ee0.35± ±0.10±0.07 emu0.99± ±0.21±0.34.")
32
One of the main sources of systematic uncertainty affects pt of the jets MET Jet Energy Scale uncertainties ~ 3-4% for jets with pt>30 taken from data base in pt,eta bins On top of that : - 1.5% to account for differences in software and calibrations - b-jet scale: 2% jets with (50<pt<200 GeV and eta<2.0), 3% otherwise Pt of the jets shifted by this value and also propagated to the MET Unclustered MET (10%) 1% effect Total uncertainty: 3.8% ee/mm 2.8% emu Systematics: Jet Energy Scale 32
, 3% otherwise Pt of the jets shifted by this value and also propagated to the MET Unclustered MET (10%) 1% effect Total uncertainty: 3.8% ee/mm 2.8% emu Systematics: Jet Energy Scale 32")
33
Systematics: b-tagging. Efficiencies and mistag rates associated to the working point used (1.7) are shifted by their relative uncertainties to obtain new b-tag discriminator cuts. SF light = 1.0 ± 0.25 SF b = 1.0 ± 0.1 SF c = 1.0 ± 0.2 33 5% systematic uncertainty Data-MC scale factors:
 are shifted by their relative uncertainties to obtain new b-tag discriminator cuts. SF light = 1.0 ± 0.25 SF b = 1.0 ± 0.1 SF c = 1.0 ± % systematic uncertainty Data-MC scale factors:.")
34
Summary of systematics Backgrounds from MC: Ztautau, VV and tW Uncertainties on signal selection: 15% uncertainty on the NLO cross section 30% uncertainty on the cross section Detector effects, JES, btag —38% Ztautau, VV —32% tW Largest systematic uncertainty Comes from b-tagging 34 Theoretical systematics estimated using ttbar MC samples produced with different configurations Lepton selection: T&P + difference between tt and Z

35
Cross section measurement N: Number of events observed in data B: Number of background events A: signal acceptance L: luminosity 35 Analysis was combined with other dilepton measurements: 1 jet / 2-jets ( without b-tagging)
")
36
Combined cross section 36 12% precision on top cross section Measurements of the top cross section in dilepton & lepton+jets channels: = 158 ± 10 (stats) ± 16 (syst) ± 6 (lumi) pb
 ± 16 (syst) ± 6 (lumi) pb")
37
Search for the SM Higgs boson Current limits Higgs production and decay H WW channel Event selection Cut-based analysis BDT analysis Results and limits

38
Higgs limits up to 2010 Experimental limits Experimental limits LEP LEP : m H > 114.4 GeV/c 2 at 95% CL Tevatron Tevatron : Excluded the mass range of 158 GeV/c 2 to 173 GeV/c 2 at 95%CL Indirect constraints Indirect constraints Derived from precise EWK measurements: m H = 98 +58 -37 GeV/c 2 (m H < 158 GeV/c 2 ) (m H <185 GeV/c 2 if including LEP2 results) Theoretical limits Finite and positive Higgs couplings A light Higgs is favoured by measurements 38
 (m H <185 GeV/c 2 if including LEP2 results) Theoretical limits Finite and positive Higgs couplings A light Higgs is favoured by measurements 38")
39
SM Higgs production SM Higgs production Gluon-gluon fusion (gg H) Vector boson fusion (VBF) In association with W,Z (VH) In association with tt (ttH) gg H dominant mode at LHC 39
 Vector boson fusion (VBF) In association with W,Z (VH) In association with tt (ttH) gg H dominant mode at LHC 39")
40
SM Higgs decays At Low mass ( m H < 2m Z ) At Low mass ( m H < 2m Z ) H bb H bb : BR ~0.85 but huge QCD background H H : accessible through VBF H H : very important despite the low BR (~0.002 ) due to the excellent /jet separation and resolution H WW* 2l2 m H H WW* 2l2 : accesible through gg fusion and VBF, BR~1 at m H ~160 GeV/c 2 H ZZ* 4l H ZZ* 4l : also performant For Higher masses For Higher masses H WW* 2l2v H ZZ* 4l H WW* 2l2v and H ZZ* 4l 40
 At Low mass ( m H < 2m Z ) H bb H bb : BR ~0.85 but huge QCD background H H : accessible through VBF H H : very important despite the low BR (~0.002 ) due to the excellent /jet separation and resolution H WW* 2l2 m H H WW* 2l2 : accesible through gg fusion and VBF, BR~1 at m H ~160 GeV/c 2 H ZZ* 4l H ZZ* 4l : also performant For Higher masses For Higher masses H WW* 2l2v H ZZ* 4l H WW* 2l2v and H ZZ* 4l 40")
41
H→WW*→2l2 H→WW*→2l2 Signal: 2 high p T isolated leptons, MET and no hard jets BackgroundsBackgrounds: –WW, tt, W+jets, Z+jets, tW, WZ, ZZ… No mass peak (undetected neutrinos) Needs a good background understanding Main search channel for range 140<m H <2m Z -Highest branching ratio for m H >140 GeV/c 2 : 95% at m H = 160 GeV/c 2 Two main discriminants: Angle between leptons in the transverse plane : main variable to reject WW ( small opening angle for the signal due to spin correlations ) Jet Veto for ttbar reduction ttDYW+jetsWW (pb) 157.530483131442.9 41
 Needs a good background understanding Main search channel for range 140<m H <2m Z -Highest branching ratio for m H >140 GeV/c 2 : 95% at m H = 160 GeV/c 2 Two main discriminants: Angle between leptons in the transverse plane : main variable to reject WW ( small opening angle for the signal due to spin correlations ) Jet Veto for ttbar reduction ttDYW+jetsWW (pb)")
42
Trigger muon and electron triggers WW preselection Analysis flow Higgs selection Cut-based analysis MVA analysis | - Z veto |M ll -M z |>15 - MET - Jet Veto - Top tagging (b-tag veto) Lepton pair selection 42 Muons p T >20 GeV, | |<2.4 -ID: globalMuon, trackerMuon, IP 10, chi2<10 - Iso<0.15 Electrons p T >20 GeV, | |<2.5 EcalDriven, eID 80% efficient for e from Ws, IP<0.04 cm, Iso <0.10
 Lepton pair selection 42 Muons p T >20 GeV, | |<2.4 -ID: globalMuon, trackerMuon, IP 10, chi2<10 - Iso<0.15 Electrons p T >20 GeV, | |<2.5 EcalDriven, eID 80% efficient for e from Ws, IP<0.04 cm, Iso <0.10")
43
Missing E T Essential to control Z+jets background and reduce it to an acceptable level Projected MET This variable helps to suppress Z tautau that tend to have MET aligned with one of the leptons 43

44
Jet Veto and top tagging Signal has little hadronic activity main property to reject ttbar background Events with at least one jet p T >25 GeV, | |<5 are vetoed Top tagging soft muon + b-jet tagging - Muons from b-quark decays are not isolated and have softer pt - Look for b-tagged jets (TCHE > 2.1) remaining after Jet Veto 44 Presence of b-quarks in top events also exploited - Requiring no additional soft muons and no b-tagged jets ~40% top bkg reduction - Control sample for top background estimation signal
 remaining after Jet Veto 44 Presence of b-quarks in top events also exploited - Requiring no additional soft muons and no b-tagged jets ~40% top bkg reduction - Control sample for top background estimation signal")
45
Cut-based analysis Secuential cuts applied on main discriminant variables : — Pt of the highest pt lepton (Ptmax) — Pt of the second lepton (Ptmin) — Dilepton invariant mass (mll) — Angle between the leptons in the transverse plane (dPhi) Most powerful observable to distinguish the signal from the irreducible WW background Due to spin correlations, leptons from Higgs decays tend to have smaller opening angles 45
 — Pt of the second lepton (Ptmin) — Dilepton invariant mass (mll) — Angle between the leptons in the transverse plane (dPhi) Most powerful observable to distinguish the signal from the irreducible WW background Due to spin correlations, leptons from Higgs decays tend to have smaller opening angles 45")
46
Cut-based analysis -Kinematics change with the Higgs boson mass mass dependent optimization 46

47
BDT analysis MVA analysis used to improve sensitivity Boosted Decision Trees — Binary classifier — Sample splitted by cutting on the variable that gives the best S-B separation at each step Training Sample with known Signal and background composition, selection of a set of discriminant variables… Resulting function applied to the data sample Different approaches according to the training procedure, similar performance: — BDT 3D separate trainings for each background — BDT 1D one single training against all backgrounds together 47 Mass dependent optimization (130,160,190)
")
48
BDT analysis Input variables 48

49
BDT 3D - Main backgrounds: WW, ttbar and Z+jets - 3 independent trainings using the same set of input variables and then combined into a Single variable BDT anti WW BDT anti ttbarBDT anti Z 49

50
signal WW ttbar Z+jets BDT 3D Signal-likebackground-like 50 X axis: BDT1 Y axis: BDT2 Z axis: BDT3 Final discriminant variable

51
Results BDT/Cut-based 51 BDT 1D Trained against the Sum of all backgrounds ~15% more signal with BDT

52
Background estimation DY DY: in/out method Fake leptons Fake leptons: Tight to Loose method Same as for the ttbar cross-section WW: Control region defined by looking at dilepton mass Large statistical uncertainty ~50% with the available data sample Top Top - Events with N>=1 are dominated by top events removing anti b-tagging requirement - No events in the b-tagged region estimate taken from simulation with a 100% uncertainty - Background prediction is then extrapolated to the Higgs signal region by using the efficiency of the additional requirements from simulation 52

53
Luminosity : 11% Luminosity : 11% Lepton efficiencies: 1-2% (T&P) Lepton efficiencies: 1-2% (T&P) Lepton momentum scale: 1.3% varying pt of leptons Lepton momentum scale: 1.3% varying pt of leptons Pile-Up : reweighting MC 0.5% Pile-Up : reweighting MC 0.5% Jet Veto: 6.9% on the signal Background estimation Background estimation: — WW ~55% — DY ~100% — top ~100% — Fakes ~50% 53 Systematic uncertainties Uncertainty on the H→WW signal yield ~ 14% (dominated by uncertainty on the jet veto efficiency and the luminosity determination ) ~40% uncertainty on the background
 Lepton efficiencies: 1-2% (T&P) Lepton momentum scale: 1.3% varying pt of leptons Lepton momentum scale: 1.3% varying pt of leptons Pile-Up : reweighting MC 0.5% Pile-Up : reweighting MC 0.5% Jet Veto: 6.9% on the signal Background estimation Background estimation: — WW ~55% — DY ~100% — top ~100% — Fakes ~50% 53 Systematic uncertainties Uncertainty on the H→WW signal yield ~ 14% (dominated by uncertainty on the jet veto efficiency and the luminosity determination ) ~40% uncertainty on the background")
54
Exclusion limits SM extension with 4 generations predict ~9 enhacement in cross section For this model Higgs excluded from 144 to 207 GeV 54 No excess found above SM expectations Cut-based BDT

55
Projections 1 fb -1 55 With 1 fb−1 at 7 TeV expected exclusion limit from 135 to 450 GeV With 5 fb−1 of data up to 600 GeV With 1 fb−1 at 7 TeV 3 -significance in the mass range of mH = 145 − 195 GeV

56
Phys.Lett. B 695 (2011) 424 Phys.Lett. B 699(2011) 25-47 Accepted by JHEP The work described in this thesis contributed to the published analysis The work described in this thesis contributed to the published analysis: arXiv:1105.5661 56
 Accepted by JHEP The work described in this thesis contributed to the published analysis The work described in this thesis contributed to the published analysis: arXiv:")
57
Conclusions 57 The measurement of the tt cross section, as well as the search for the SM Higgs boson in H WW decay mode, in the dilepton final states, for 36 pb-1 of data collected during the 2010 run of the LHC has been presented For the final cross-section measurement, several analysis applying slightly different selections were combined: at least 2 jets with at least one b-tagged jet (described in this thesis), at least 2 jets without any b-tagging requirement and the 1-jet analysis. This led to the value : =168±18(stats.) ±14(sys.) ± 7(lumi.) pb, consistent with the NLO cross section prediction of 158±23 pb In this work we searched for the H WW 2l2v final state that is the most promising in a wide range of Higgs boson masses around 160 GeV. The integrated luminosity was not yet large enough to be sensitive to the SM Higgs boson but it was possible to set limits in the context of a SM extension with a fourth generation of fermions, from 144 to 207 GeV
 ±14(sys.) ± 7(lumi.) pb, consistent with the NLO cross section prediction of 158±23 pb In this work we searched for the H WW 2l2v final state that is the most promising in a wide range of Higgs boson masses around 160 GeV. The integrated luminosity was not yet large enough to be sensitive to the SM Higgs boson but it was possible to set limits in the context of a SM extension with a fourth generation of fermions, from 144 to 207 GeV.")
58
BACKUP

61
61

62
62

63
Data-driven estimate : 2.6 ± 1.2 (stats) ± 1.3 (sys.) ee: 0.7 ± 0.6 (stats) ± 0.3 (sys.) Systematic uncertainty comes from the variation of Rout/in with the MET cut 50% Average between PU and nonPU samples Background estimation: Drell-Yan 63
 ± 1.3 (sys.) ee: 0.7 ± 0.6 (stats) ± 0.3 (sys.) Systematic uncertainty comes from the variation of Rout/in with the MET cut 50% Average between PU and nonPU samples Background estimation: Drell-Yan 63")
64
Muon Fake ratio determination Jet triggers used to select a fake lepton enriched samples EWK contamination (W,Z) reduced by applying cuts on MET<20, MT<20 And Z veto To avoid any possible trigger bias -> muons matched in dr<1 to the leading jet are removed FO definition analysis cuts + relaxed isolation cut Background estimation: Fake leptons 64
 reduced by applying cuts on MET<20, MT<20 And Z veto To avoid any possible trigger bias -> muons matched in dr<1 to the leading jet are removed FO definition analysis cuts + relaxed isolation cut Background estimation: Fake leptons 64")
65
Background estimation: Fake leptons 65

66
66

67
Lepton efficiencies Single lepton RECO, ID, ISO scale factors Trigger 0.972± 0.006 67

68
Background estimation: Fake leptons 68 W+jetsSemileptonic ttData mumu00.07±0.020.07±0.07±0.02 ee00.35±0.040.13±0.10±0.07 emu0.07±0.070.92±0.420.68±0.21±0.34

69
Systematic uncertainties 69

Similar presentations
: LEP direct searches m H > 114.4 GeV Global fit to precision EW data (excludes direct search results) m H < 157 GeV Latest Tevatron.>")
 Majid Hashemi University of Antwerp, Belgium.>")


 The measurement.>")
 SUSY 2005, Durham Search for the SM Higgs Boson at the CDF Experiment Search for the SM Higgs.>")
 Introduction to Single-Top The measurement.>")


 (PPP9, NCU, Taiwan, June 04, 2011) June04, 2011,>")


 MUON group.>")
 Chris Collins-Tooth, 17 June 2008.>")