Download presentation
Presentation is loading. Please wait.

1
NPS 1 NPS 2 Background Reserve MOS WLA 3 WLA 2 WLA1WLA1 North Canadian River Oklahoma River Shell Creek Draft TMDLs For Bacteria PUBLIC MEETING

2
Agenda WELCOME INTRODUCTIONS STUDY OVERVIEW QUESTIONS COMMENTS

3
The Clean Water Act First Adopted 1972 Clean Water Goals: July 1, 1983 Wherever attainable, Fishable Swimmable water quality 1985 Eliminate discharge of pollutants

4
How Do We Get There ??? Two Step Approach Technology-Based Limits For All Point Sources Additional Water Quality Based Controls To Meet Water Quality Standards

5
Identifying Problem Areas Compare Monitoring Results To Water Quality Standards Set Priorities Compile Problem Areas And Priorities In the 303d List

6
The TMDL Amount Of Pollution A Waterbody Can Receive Without Violating Water Quality Standards Point Sources Wasteload Allocations Nonpoint Sources Natural Background Load Allocations

7
The TMDL Pie Total Load Allocations Total Wasteload Allocations Total Unallocated NPS 1 NPS 2 Background Reserve MOS WLA 3 WLA 2 WLA1WLA1

8
Study Overviews North Canadian River: Canton Dam to Yukon, including Shell Creek Prepared by Parsons And DEQ Presented by Paul Yue North Canadian River & Oklahoma River: Yukon to Dale Prepared by ACOG Presented by John Harrington

10
Bacterial Standards Bacteria Indicator Standards (/100 ml) Fecal Coliform400 E-Coli406 Enterococci108
 Fecal Coliform400 E-Coli406 Enterococci108")
11
Monitoring Sites NC02 NC05 NC03 NC04 NC08 NC06 NC07 NC01 Shell Crk

12
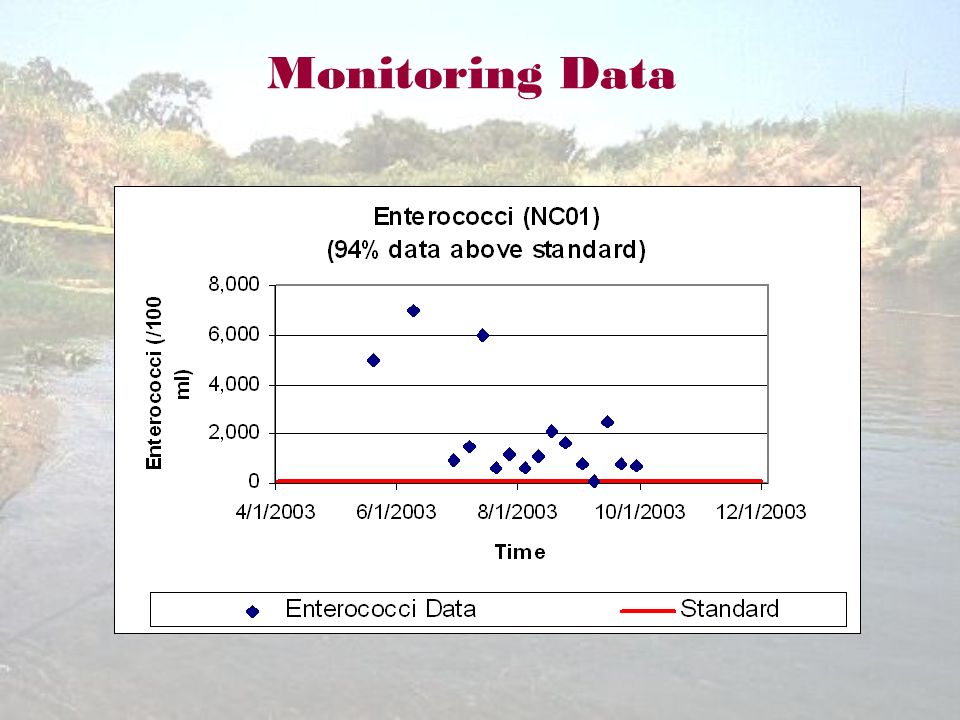
Monitoring Data If more than 10% of data above the standards Problem North Canadian River (NC01) FC – 33% exceed E-Coli – 13% exceed Enterococci – 94% exceed
 FC – 33% exceed E-Coli – 13% exceed Enterococci – 94% exceed")
13
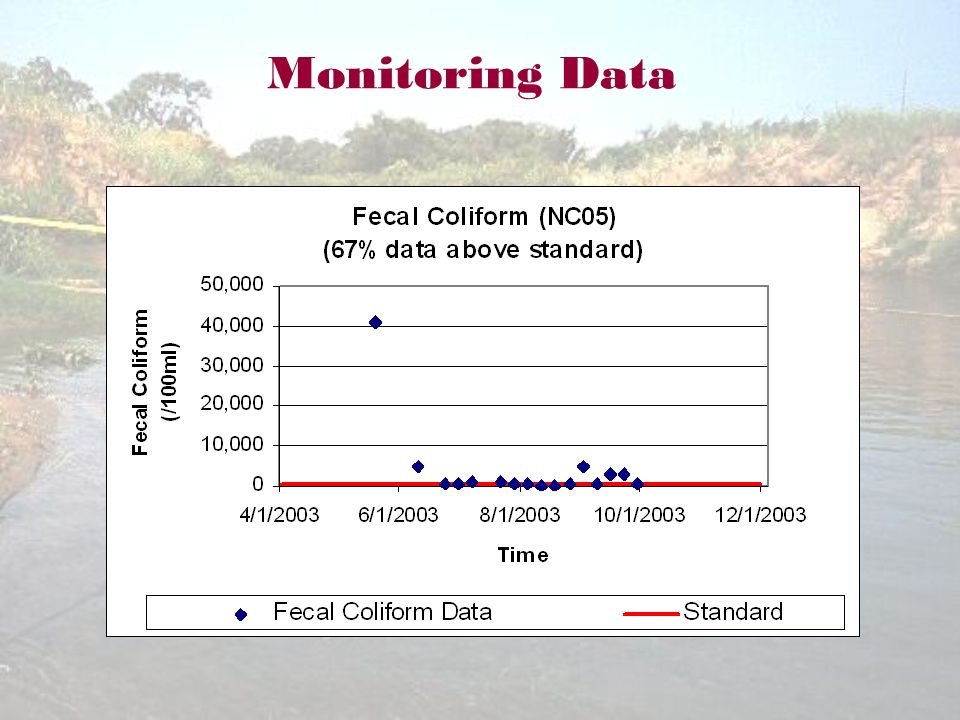
NC02 NC05 NC03 NC04 NC08 NC06 NC07 NC01 Shell Crk FC – 33% EC – 13% ENT – 94% FC – 22% EC – 11% ENT – 72% FC – 24% EC – 0% ENT – 76% FC – 67% EC – 6% ENT – 89% FC – 47% EC – 6% ENT – 82%

15
Monitoring Data

19
Pollutant Sources Point Sources –Permitted discharge - Watonga –No-discharge facilities – 6 –CAFOs - 4

20
Pollutant Sources Non-Point Sources –Livestock –Pets –Failing Septic Tanks –Wildlife

21
TMDL Development Definition – the maximum load a stream can receive without violating standards TMDL = LA + WLA + MOS Load Duration Curve

22
Step #1: Flow Duration Curve

23
Load Duration Curve Step #2: Load = C * Flow * Standard

24
North Canadian River Fecal Coliform - 88% Reduction

25
North Canadian River Enterococci - 89% Reduction

26
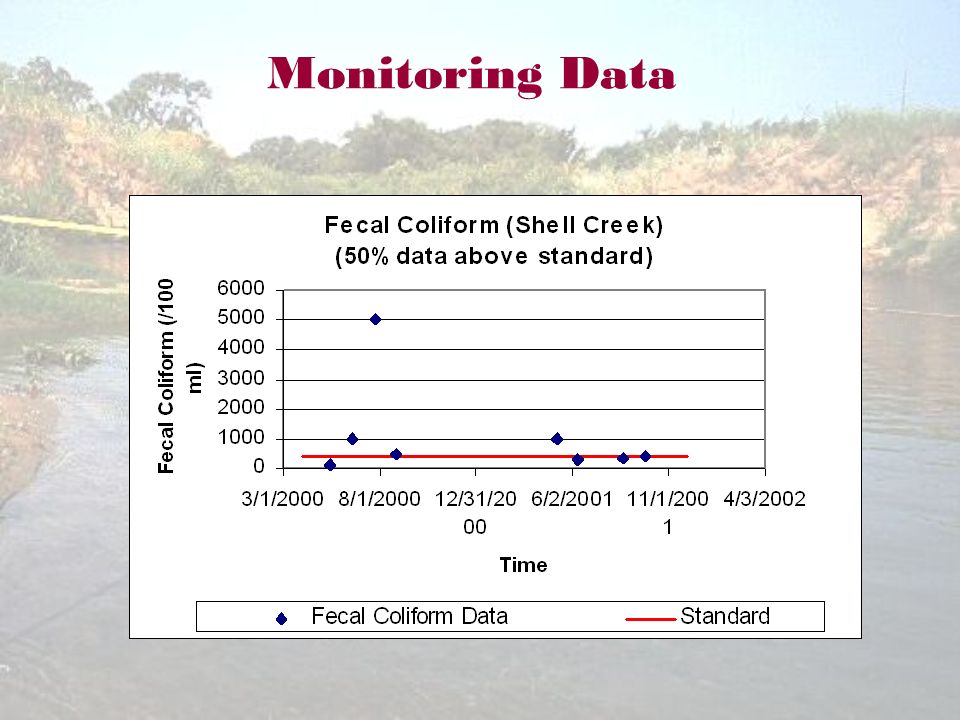
Shell Creek Fecal Coliform - 92% Reduction

27
Study Overviews North Canadian River: Canton Dam to Yukon, including Shll Creek Prepared by Parsons And DEQ Presented by Paul Yue North Canadian River & Oklahoma River: Yukon to Dale Prepared by ACOG Presented by John Harrington

29
Highway 81 El Reno Station Rope Swing, Garth Brooks Blvd

30
Anderson Road, Oklahoma County Dale, Oklahoma

31
Click on the disease name for more info

32
Bacterial Standards Bacteria Indicator Standards (/100 ml) Fecal Coliform400 E-Coli406 Enterococci108
 Fecal Coliform400 E-Coli406 Enterococci108")
33
FECAL COLIFORM SUMMARY CHART

34
ENTEROCOCCI SUMMARY CHART

35
EL RENO STATION ENTEROCOCCI REDUCTION GOAL: 95.6%

36
WHERE DO WE GO FROM HERE??

37
What Do the Municipalities Do??? Phase II Stormwater Program Six Minimum Control Measures Public Education and Outreach Public Participation and Involvement Illicit Discharge Detection and Elimination Best Management Practices – Illicit Discharge Detection, Erosion Control, Ordinances Construction Site Runoff Control Post-Construction Runoff Control Pollution Prevention and Good Housekeeping

38
Implementation How Can We Get There ??? NonPoint Sources Voluntary Programs ONLY Cost Share & Incentives Technical Assistance

39
Implementation How Can We Get There ??? Point Sources CAFOs No Discharge Good Housekeeping BMPs

40
Implementation How Can We Get There ??? Point Sources Wastewater Treatment Plants No Effect Current Limits = WQS Enforcement

41
Implementation How Can We Get There ??? Point Sources Stormwater Revise Local Management Program Within 2 Years Consider Listed BMPs

42
Implementation How Can We Get There ??? Point Sources Stormwater Monitoring Program NO Numeric Effluent Limits

43
Stormwater Permits Within The Watershed Yukon Mustang Bethany Warr Acres Moore Del City Midwest City Oklahoma City Spencer Nicoma Park Choctaw ODOT OTA Tinker AFB

44
Example BMPs Stormwater & NonPoint Source Best Management Practice Impairment Source Reported Efficiency RURALURBAN Animal waste management XX 75 % Detention pond/basin XX 25 % - 51% Fencing X 75 % Filtration (e.g., sand filters) XX 30 % - 51% Infiltration Basin X 50 %
 XX 30 % - 51% Infiltration Basin X 50 %")
45
Example BMPs Stormwater & NonPoint Source Best Management Practice Impairment Source Reported Efficiency RURALURBAN Onsite treatment system installationXX Porous pavementX50 % Rain garden bio-retention basin X40 % Retention ponds/basinsXX32 % Riparian Buffer ZoneXX43 – 57 %

46
Example BMPs Stormwater & NonPoint Source Best Management Practice Impairment Source Reported Efficiency RURALURBAN Septic system pump-outXX5 % Sewer line maintenance/sewer flushing X Stream bank protection and stabilization XX40 - 75 % Vegetated filter stripXX Wetland development or enhancement - including creation and restoration XX30 %

47
What Happens Next ? Comments Accepted Through April 21 Comment Responsiveness Summary Late May Final Draft Submitted For EPA Approval Early June Incorporate In Water Quality Management Plan Includes Additional Public Participation

48
How To Provide Comments Oral Comments Accepted This Evening By Mail: Dr. Karen Miles Water Quality Division Oklahoma Department of Environmental Quality P.O. Box 1677 Oklahoma City, OK 73101-1677 By Email: Karen.Miles@deq.state.ok.us Comments Must Be Received By APRIL 21 !

49
QUESTIONS

50
COMMENTS

51
Thank You

Similar presentations


 Master Farmer Program>")


