Download presentation
Presentation is loading. Please wait.

1
United Nations Economic Commission for Europe Statistical Division Introducing the GSBPM Steven Vale UNECE steven.vale@unece.org

2
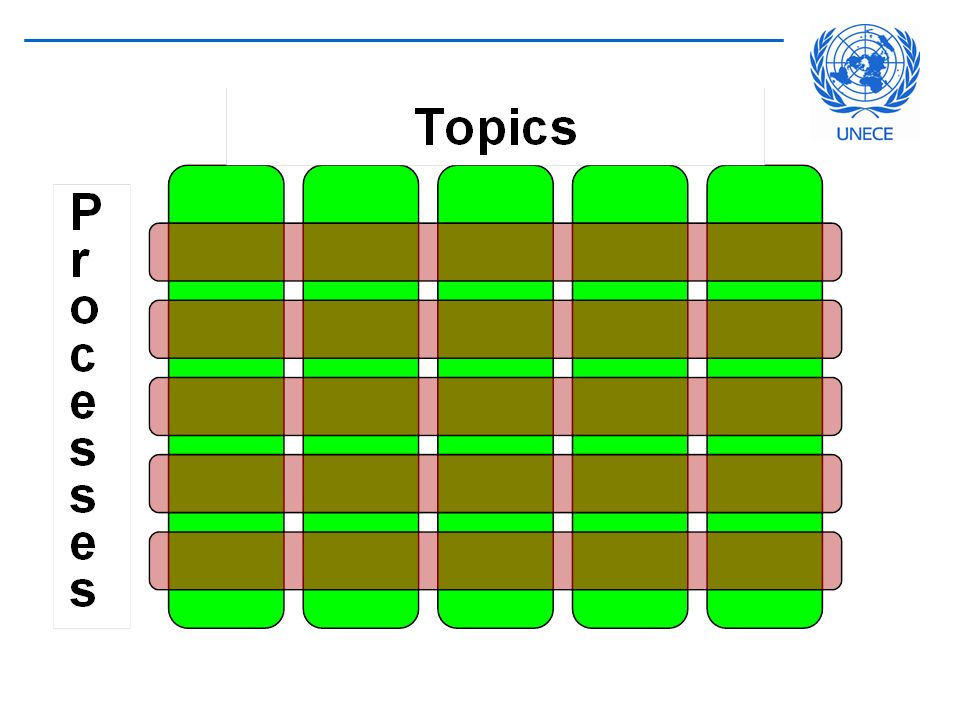
Background Statistical production has traditionally been organised by topic, e.g. transport, trade, … Financial pressures are encouraging new ways of thinking Some statistical organisations are moving towards a process-based approach Others are considering a matrix approach

4
Background Defining and mapping business processes in statistical organisations started at least 10 years ago “Statistical value chain”X “Survey life-cycle”X “Statistical process cycle”X “Business process model”X Generic Statistical Business Process Model

5
What is the GSBPM? A flexible model that describes and defines the set of business processes needed to produce official statistics Standard framework and harmonised terminology to help statistical organisations Modernise statistical production processes Share methods and components

6
Who created the GSBPM? The Conference of European Statisticians Steering Group on Statistical Metadata Part of the Common Metadata Framework www.unece.org/stats/cmf

7
How was it created? Based on the business process model developed by Statistics New Zealand Added phases for: Archive (inspired by Statistics Canada) Evaluate (Australia and others) Three rounds of comments Terminology and descriptions made more generic
 Evaluate (Australia and others) Three rounds of comments Terminology and descriptions made more generic.")
9
Result: GSBPM Version 4.0 Released April 2009

10
Updating the GSBPM By 2013 many organisations had adopted GSBPM – and given feedback Related new models and standards had been developed Agreement that GSBPM needed to be “refreshed” to maintain relevance

11
Changes between v4 and v5 Policy of minimum change Only if wide agreement and good business case Removed Phase 8 (Archive) Archiving happens throughout processes Improved documentation Less survey-focused Links to newer standards e.g. GSIM More detail where requested by users

12
Result: GSBPM Version 5.0 Released December 2013

13
Why do we need the GSBPM? To define and describe statistical processes in a coherent way To compare and benchmark processes within and between organisations To make better decisions on production systems and organisation of resources

14
What will this mean for resources?

15
Applicability (1) All activities undertaken by producers of official statistics which result in data outputs All statistical domains National and international statistical organisations
 All activities undertaken by producers of official statistics which result in data outputs All statistical domains National and international statistical organisations")
16
Applicability (2) Development and maintenance of statistical registers All types of data source: Surveys / censuses Administrative sources / register-based statistics Mixed sources “Big Data”
 Development and maintenance of statistical registers All types of data source: Surveys / censuses Administrative sources / register-based statistics Mixed sources Big Data")
17
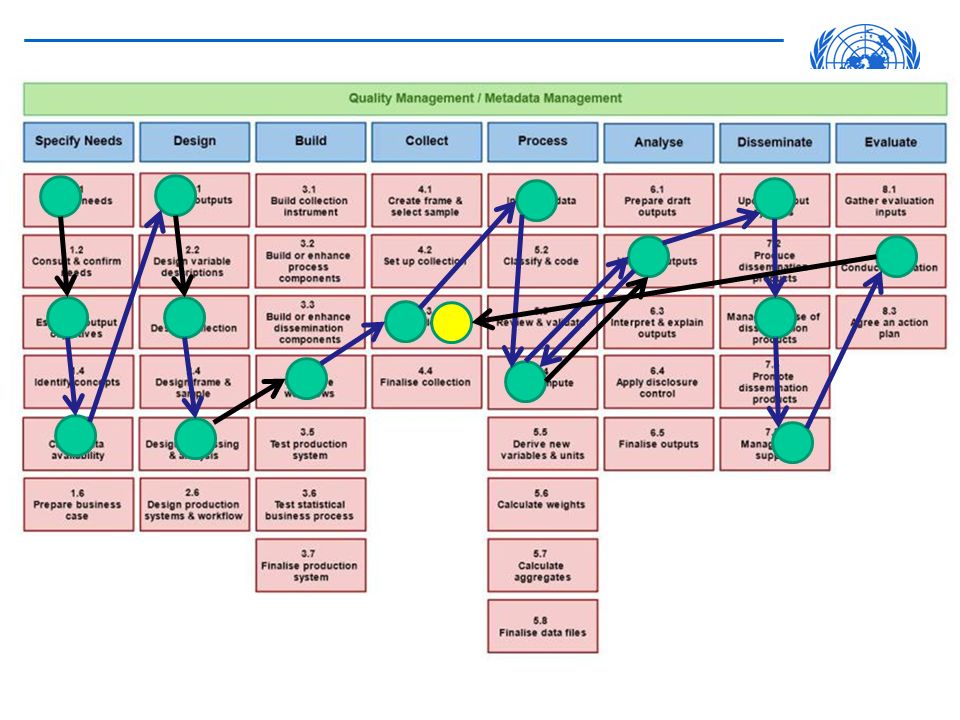
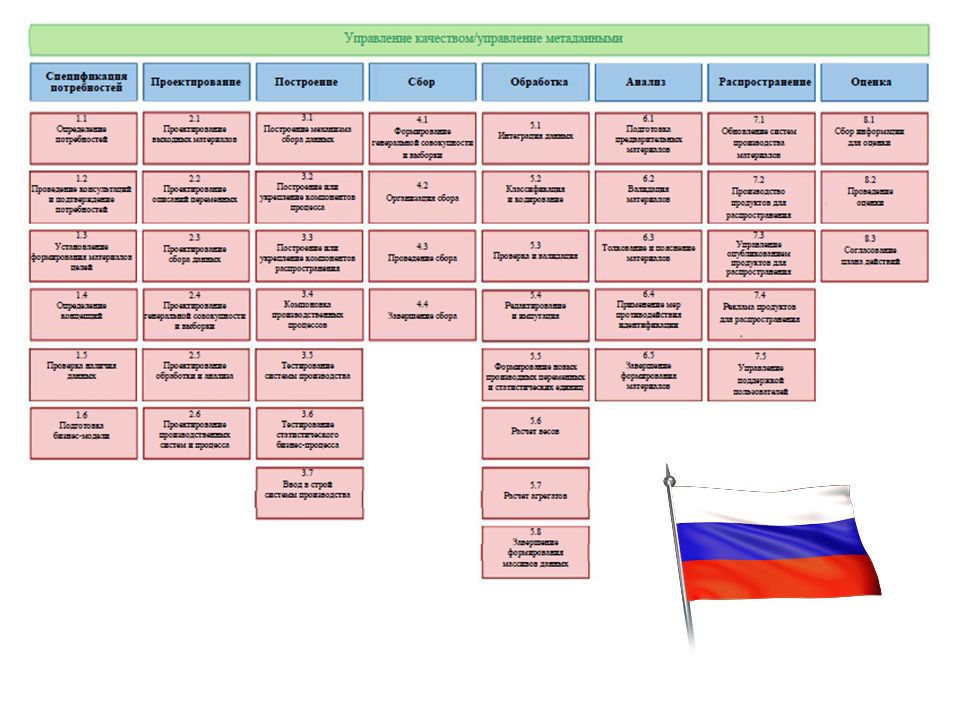
Structure of the Model (1) Process Phases Sub- processes (Descriptions)
 Process Phases Sub- processes (Descriptions)")
18
Structure of the Model (2) National implementations may need additional levels Over-arching processes Quality management Metadata management Statistical framework management Statistical programme management........ (others – see paper)
.")
19
Key features Not a linear model Sub-processes are not followed in a strict order It is a matrix, through which there are many possible paths

21
Key Features (2) In theory the model is circular: Evaluation can lead to modified needs and design In practice it is more like a multiple helix: There may be several iterations of a process underway at any point in time
 In theory the model is circular: Evaluation can lead to modified needs and design In practice it is more like a multiple helix: There may be several iterations of a process underway at any point in time")
22
Uses of the GSBPM Managing statistical programmes Cost / resource allocation Documenting statistical processes Framework for quality assessment Sharing statistical software

23
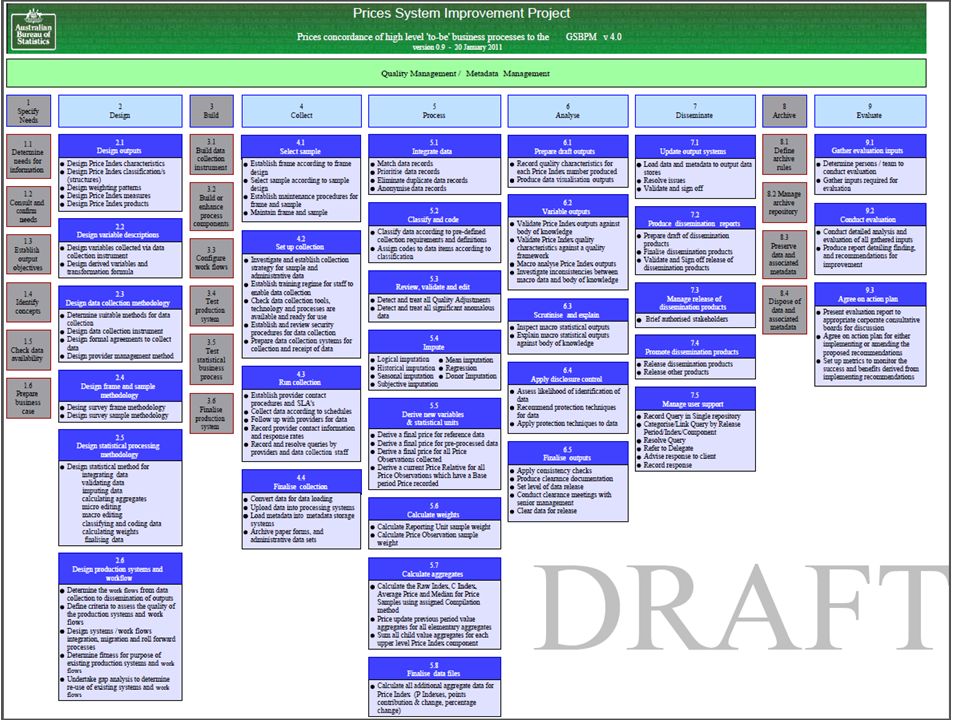
Example 1 Australian project to improve production of prices data Identified activities within GSBPM sub- processes Some phases “out of scope”

25
Example 2 Another price index, this time for legal services in Norway Note the difference in phases / sub- processes covered E.g. no data integration or classification in this process

26
5.8 Finalise data files 5.6 Calculate weights Price index for legal services Quality Management / Metadata Management Specify Needs Design Build CollectProcessAnalyse Disseminate 1.1 Determine needs for information Eurostat regulation Ministry of Justice Trade association Major companies 1.2 Consult & confirm needs See 1.1 1.6 Prepare business case 1.4 Identify concepts 1.3 Establish output objectives 1.5 Check data availability Provided in regulation Variables Classifications Project plan Finances Choose companies (population) together with trade association 2.2 Design variable descriptions See Eurostat regulation Agree on level of detail Translation 2.6 Design production systems & workflow 2.4 Design frame & sample methodology 2.3 Design data collection methodology 2.5 Design statistical processing methodology Paper & electronic questionnaires Scanning Establish population Make sample plan Stratification by size Scanning paper questionnaires Electronic data capture Micro controls Weighting Estimation 3.1 Build data collection instrument Standard first page Test paper & electronic 3.2 Build or enhance process components Integrated system for editing and estimation Sample register 3.6 Finalise production system 3.4 Test production systems 3.3 Configure workflows 3.5 Test statistical business process Meetings with the various data capture divisions Test micro-controls Documentation Training Meetings with 1st and 2nd line support No field test or pilot carried out 4.1 Select sample Companies selected according to sample plan 4.2 Set up collection Time plan Preprinting, packing, sending, scanning etc. 4.4 Finalise collection 4.3 Run collection Packing & sending Receive electronic data Scan papir Update received reg. Send warnings & fines 5.1 Integrate data No integration carried out 5.2 Classify and code No classifying or coding carried out 5.4 Impute 5.3 Review, validate & edit 5.5 Derive new variables & statistical units Duplicates Regional and product views Discover outliers Correct microdata No imputation carried out Weights are established in phase 2 Weights are stored per survey Publication variables Observation units = analysis units 6.1 Prepare draft outputs Index & 4 sub-indices Confidence intervals Coefficient of variation Tables & graphs 6.2 Validate outputs Check most important companies have replied. Iterative with 4.3 Check variation coefficient. 6.4 Apply disclosure control 6.3 Scrutinize & explain 6.5 Finalize outputs Consult trade association. Trade trends Any previous periods Other price indexes Aggregation & publication level Final consistency checks Supporting internal documentation 7.1 Update output systems Load data into StatBank 7.2 Produce dissemination products Daily statistics About the statistics Tables & graphs 7.4 Promote dissemination products 7.3 Manage release of dissemination products 7.5 Manage user support Statistical calender Approval routines ssb.no Daily statistics Web statistics Mail or telephone Contact 1.1 users Data from electronic & paper questionnaires Deliver data to processing 5.7 Calculate aggregates Data files are finalised 2.1 Design outputs General dissemination policy: About the statistics Tables in StatBank Text & graphs Aggregates are calculated

27
Example 3 Irish tourism survey Mapped GSBPM to 78 survey process steps

30
Example 4 Denmark – quarterly survey on employment in construction Established, regular survey Just phases 4 to 7

32
GSBPM as a Framework for Documentation “The GSBPM provides a structure for organizing documentation, promoting standardisation and the identification of good practices” GSBPM v5.0

33
February 2014 – pilot surveys description Labour statistics Industry Statistics 10-12 June 2014, Nizhny Novgorod, Russia Belarus: Using GSBPM 5.0 to describe the existing statistical production processes

34
Results: gaps Identification of gaps in the existing processes 10-12 June 2014, Nizhny Novgorod, Russia Lack Lack of necessary documentation unsettled Existence of unsettled processes

35
The GSBPM is used by more than 50 statistical organisations worldwide

39
KSBPM – Republic of Korea

40
Beyond statistics: Data archives Generic Longitudinal Business Process Model

41
The future of the GSBPM The GSBPM will have to change over time to reflect new realities But not too often! Collect ideas and feedback to inform future revisions More detail? Broader scope?

42
Detail vs Generic - Norway

43
Detail vs Generic - Thailand

44
GSBPM+ GAMSO Generic Activity Model for Statistical Organisations

45
More information GSBPM Wiki www1.unece.org/stat/platform/display/GSBPM

Similar presentations


>")


 4-6 May 2010, Helsinki, Finland Brancato G., Carbini R., Murgia M., Simeoni G. Istat, Italian.>")
 Thérèse Lalor and Steven Vale United Nations Economic Commission for Europe (UNECE)>")


