Download presentation
Presentation is loading. Please wait.

1
Lab Report Format Using PowerPoint TITLE SLIDE PROCEDURE SLIDE DATA TABLE SLIDE GRAPHS SLIDE(S) RESULTS CONCLUSION Note: this is a hiddenslide. It is placed here as a guide to help you in building your presentation. It will not show in your show! The slides with the green background are guide slides. The blanks are for you!

2
BUILD YOUR TITLE SLIDE ON THE NEXT SLIDE. CONSIDER USING SOME APPROPRIATE CLIPART AND/OR A PHOTO OF YOUR RESEARCH GROUP. BE SURE THAT THE NAMES OF ALL OF THE PARTICIPANTS OCCURS ON THIS SLIDE! You can tell which slides are hidden when you switch to slide sorter view (View, Slide Sorter). The hidden slide have the number blocked with a diagonal line.
. The hidden slide have the number blocked with a diagonal line..")
4
PROCEDURE SLIDE COMES NEXT Give a brief overview of the procedure…remember a picture can be worth many words! Build your procedure slide on the next slide Remember…these hidden slides will not show in the show. If you wish, you may delete them when your presentation is finished.

6
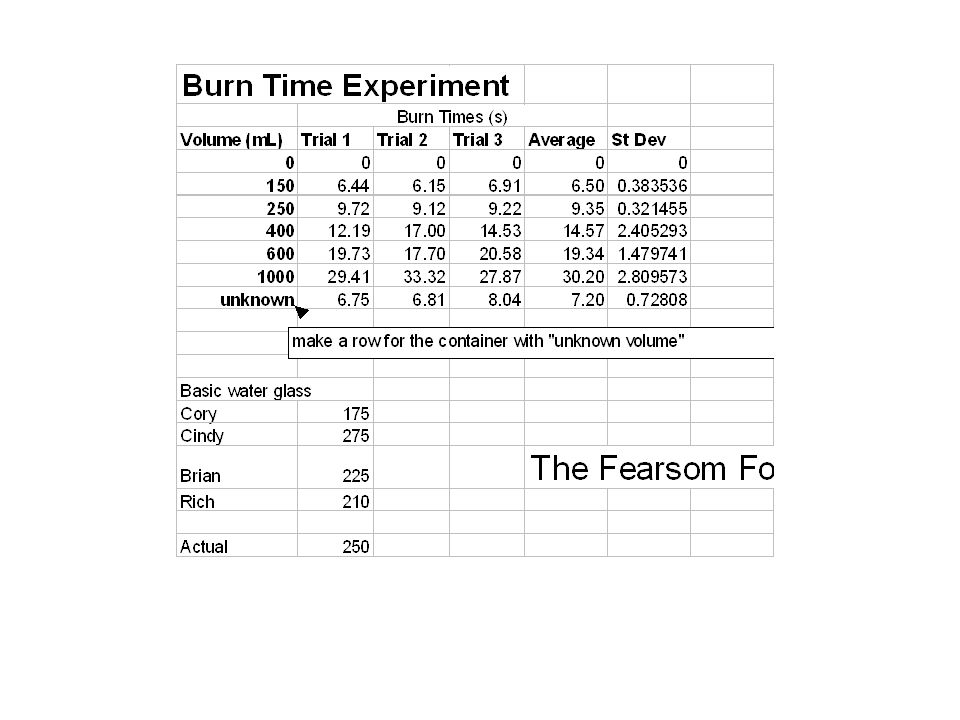
DATA SLIDE GOES NEXT! Dont reinvent the wheel here…just copy and paste your data table from Excel to the next PowerPoint slide. Adjust the data table so that it displays nicely on the slide. Include a title for the slide and maybe some other embellishments.

8
GRAPH SLIDE NEXT A graph (chart) is just another way of displaying your data. A simple cut n paste from Excel to PowerPoint is all that is needed to put your graphs into the slide show. Include a small amount of narrative to convince your audience that you know what is going on with your graphs. Consider using two different graphs on two slides. Do not clutter slides!

11
NEXT COMES YOUR RESULTS SLIDE What is the volume of that unknown container? How good was your prediction?

13
FINALLY…THE CONCLUSION SLIDE How did the experiment go? How confident are you of your work? How well did your research group work with each other? Give yourselves pats on the backs (and the applause sound is very appropriate here.

Similar presentations


 RESULTS CONCLUSION Note: this is a hiddenslide. It is placed.>")


 Acknowledgements – Ali Parvin (CCS)>")


