Download presentation
Presentation is loading. Please wait.

1
2 The Oceanic Environment Notes for Marine Biology: Function, Biodiversity, Ecology By Jeffrey S. Levinton

2
The Ocean Geography and Bottom Features

4
The Ocean and Marginal Seas The world’s oceans: oceans and marginal seas Oceans cover 71% of earth’s surface Southern hemisphere 80%, Northern hemisphere 61% 84% deeper than 2000m Greatest depth ~ 11,000 m in Marianas Trench

5
Marginal Seas Examples: Gulf of Mexico, Mediterranean Sea Affected strongly by 1.regional climate 2.precipitation-evaporation balance 3.river input of fresh water and dissolved solids 4.limited exchange with the open ocean (e.g., sill partially cutting Mediterranean from Atlantic) 5.Geological history
 5.Geological history")
6
Ocean as a Receptacle Particulate mineral matter Dissolved salts Particulate organic matter (POM) Dissolved organic matter (DOM) Atmospheric precipitation Volcanic sources Water
 Dissolved organic matter (DOM) Atmospheric precipitation Volcanic sources Water")
7
Water Relationships in the Ocean

8
Topographic Features Continental shelf (1° slope) Continental slope (2.9° slope) Continental Rise Abyssal Plain Submarine Canyons Oceanic Ridge Systems
 Continental slope (2.9° slope) Continental Rise Abyssal Plain Submarine Canyons Oceanic Ridge Systems")
9
Topographic Features

10
Earth’s surface is divided into plates: borders are ridge systems, faults

11
Magnetic anomalies led to discovery about movement of the oceanic crust.

12
The Oceanic Crust: Crust is formed at ridges, moved laterally, and destroyed by subduction, which forms trenches Seafloor spreading

13
Continents embedded in ocean crust, leading to extensive Continental Drift.

14
The Ocean Seawater Properties

15
Water Molecule Asymmetry of charge distribution on water molecule - increases ability to form bonds with ions - makes water excellent solvent

16
Water Properties High heat capacity (0.9) High heat of evaporation (590 cal/g) High dissolving power High transparency (absorbs infrared, ultraviolet)
 High heat of evaporation (590 cal/g) High dissolving power High transparency (absorbs infrared, ultraviolet)")
17
Latitudinal Gradient of Sea Water Temperature

18
Vertical Temperature Gradient: Open Tropical Ocean

19
Vertical Temperature Gradient: Shallow Temperate Ocean

20
Temperature Oceanic range (-1.9 to 40 °C) less than terrestrial range (-68.5 to 58 °C) Deep ocean is cold (2 to 4 °C)
 less than terrestrial range (-68.5 to 58 °C) Deep ocean is cold (2 to 4 °C)")
21
Heat Changes in the Ocean AdditionsLosses Latitudinal gradient of solar heating Back radiation of surface Geothermal heatingConvection of heat to atmosphere Internal FrictionEvaporation Water vapor condensation

22
Salinity Definition: g of dissolved salts per 1000g of seawater; units are o/oo or ppt or psu (practical salinity unit) Controlled by: + evaporation, sea-ice formation - precipitation, river runoff Salinity in open ocean is 32 to 38 o/oo
 Controlled by: + evaporation, sea-ice formation - precipitation, river runoff Salinity in open ocean is 32 to 38 o/oo")
23
Important Elements in Seawater Chlorine (19,000 mg/l) Sodium (10,500) Magnesium (1,300) Sulfur (900) Calcium (400) Potassium (380) Bromine (65) Carbon (28 - variable)
 Sodium (10,500) Magnesium (1,300) Sulfur (900) Calcium (400) Potassium (380) Bromine (65) Carbon (28 - variable)")
24
Principle of Constant Element Ratios: Forchhammer’s Principle Ratios between many major elements are constant all over the ocean, even though salinity varies

25
Principle of Constant Element Ratios Why? Because residence time of elements with constant ratios is much greater than time to mix them evenly throughout ocean by water currents (ca. 1000 y) Residence time
 Residence time.")
26
Principle of Constant Element Ratios Residence time of Na, Cl, Sr is on the order of millions of years But mixing time of water is on order of thousands of years Therefore ocean is well mixed, relative to input or removal

27
SubstanceResidence time Y Chloride100,000,000 Sodium68,000,000 Magnesium13,000,000 Potassium12,000,000 Sulfate11,000,000 Calcium1,000,000 Carbonate110,000 Silicon20,000 Water4,100 Manganese1,300 Aluminum600 Iron200

28
Principle of Constant Element Ratios Principle does not apply to elements that cycle rapidly, especially under influence of biological processes (e.g., nitrogen, phosphorous)
")
29
Latitudinal Salinity Gradient Excess of evaporation over ppt in mid-latitudes Excess of ppt over evaporation at equator

30
Measurement of Salinity Chlorinity: g of chlorine per 1000 ml of seawater Salinity = 1.81 x chlorinity Measured by chemical titration, conductivity, index of refraction

31
Seawater Density (mass/volume) Influenced by salt, no maximum density at 4 °C (unlike freshwater) Density measure of seawater at temperature t t = (density - 1) x 1000 t increases with increasing salinity t increases with decreasing temperature Special significance: vertical density gradients
 Influenced by salt, no maximum density at 4 °C (unlike freshwater) Density measure of seawater at temperature t t = (density - 1) x 1000 t increases with increasing salinity t increases with decreasing temperature Special significance: vertical density gradients")
32
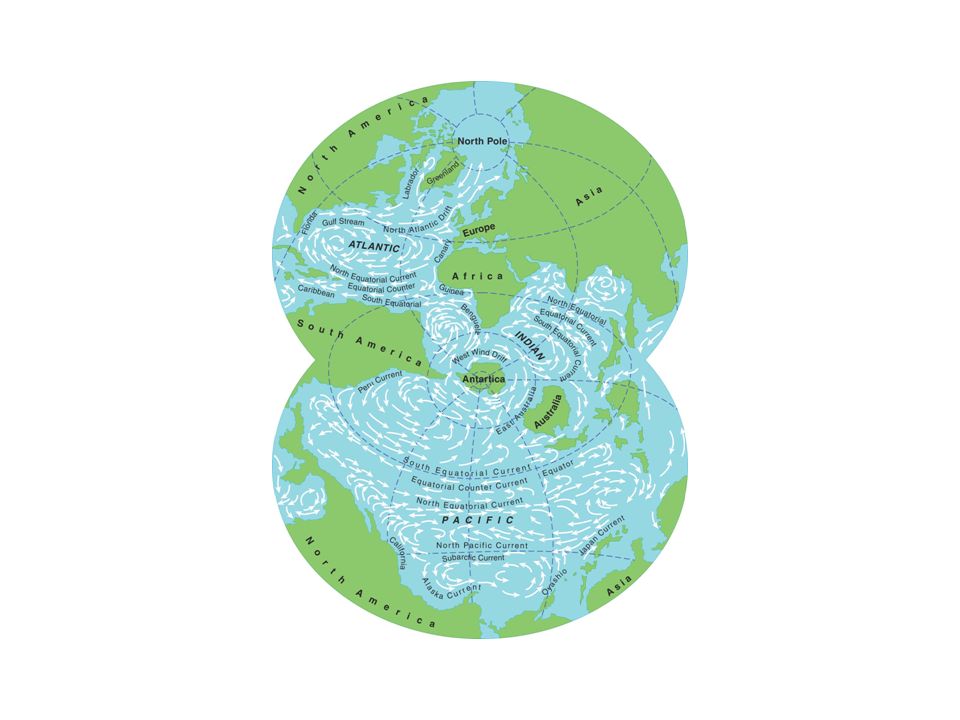
The Ocean Circulation in the Ocean

33
Coriolis Effect - Earth’s Rotation LatitudeEastward Velocity (km/h) 60° N. latitude830 30° N. latitude1440 Equator1670

34
Coriolis Effect - Movement of fluids, in relation to earth beneath, results in deflections

35
Ekman Spiral in Northern Hemisphere Coriolis Effect and Deflection

Similar presentations

 Hydrogen b) Oxygen c) Nitrogen d) Carbon dioxide.>")


Percent Ocean1370 97.3 Ice (polar) 29 2.1 Groundwater 5 0.4 Lakes 0.1 0.01 Atmosphere 0.01 0.001 Rivers0.0010.0001.>")


