Download presentation
Presentation is loading. Please wait.

1
Salinity, dissolved oxygen, and nutrient concentrations in Oyster Pond, Falmouth, Massachusetts Karen Bishop and Michael Perret: Marine Ecology, Prof. Ivan Valiela www.karenrinaldogallery.com/ oil.html

2
Study Questions: 1)What are the current horizontal and vertical distributions of salinity, O 2, and nutrients in OP, and nearby SP? 2) What do these distributions tell us about the exchange of salt and nutrients? 3)Is growth of primary producers limited by N or P in OP and SP? 4)Were there any important changes between salinity, oxygen, or nutrients between 2001 and 2004 in OP?
 What do these distributions tell us about the exchange of salt and nutrients. 3)Is growth of primary producers limited by N or P in OP and SP. 4)Were there any important changes between salinity, oxygen, or nutrients between 2001 and 2004 in OP .")
3
Nitrogen – Ammonium, Nitrate (NH 4, NO 3 ) Phosphorus- Phosphate (PO 4 ) Dissolved Oxygen (O 2 ) Salinity (ppt ) Eutrophication and Variables of Interest
 Phosphorus- Phosphate (PO 4 ) Dissolved Oxygen (O 2 ) Salinity (ppt ) Eutrophication and Variables of Interest")
4
Experimental Procedure/Data Collection Mid- and high-tide collection Surface to bottom measurements at 1 meter increments Recorded temperature and O 2 using YSI probe; record salinity using refractometer; collect water samples for nutrient analysis Sample bottles filtered and frozen for measurement with “ Lachat ” auto-analyzer Standard spectrophotometric methods Bathymetric profiles of all 6 variables for OP and SP

5
Oyster Pond and Salt Pond transect points Salt PondOyster Pond

6
Salinity (ppt) 0 0 2 4 6 Depth (m) 0 1 2 4 5 0 0 0 1-2 3 6-8 12 3 32 25 27 26 Higher at SP 3 OP SP -transect pts & depth (dots) -averages -max. depth OP- 6.5m SP- 4m -anoxic zone NS.

7
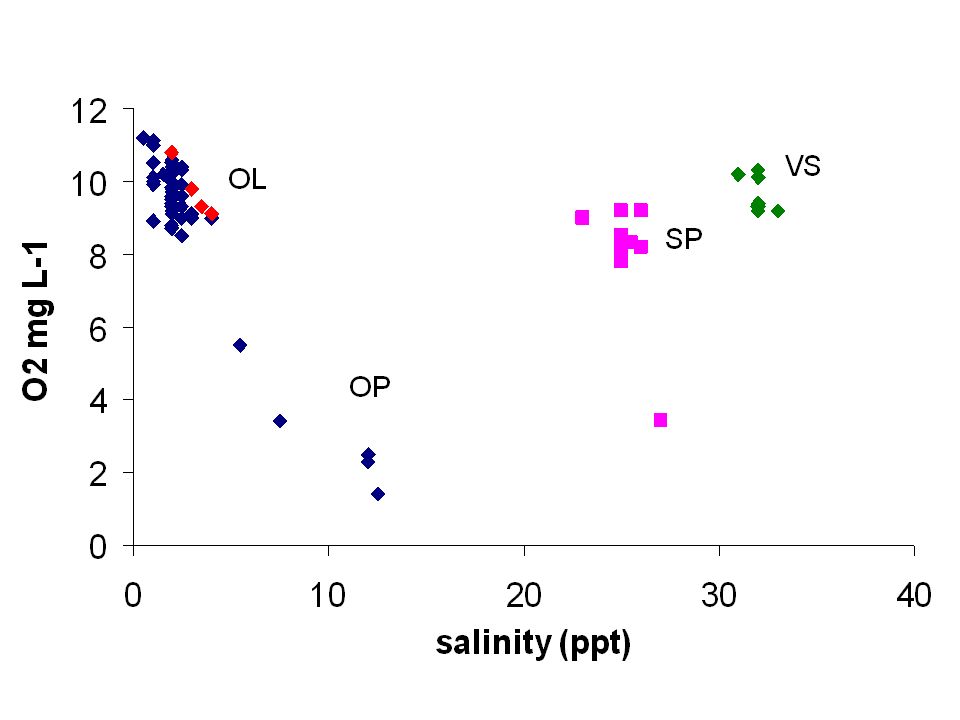
O 2 (mg l -1 ) 0 2 4 6 Depth (m) 0 1 2 3 4 5 0 0 9-11 6 3 1-2 8 9 3-5 Similar OP SP NS
 Depth (m) Similar OP SP NS")
8
NO 3 (µM) 0 0 1-2 2 ≤ 1 1.5 <1 1 2 1-2 0 3 4.5 5.25.5 Generally higher at SP 0 Depth (m) 0 2 4 6 0 1 2 3 4 5 OP SP NS 5
 ≤ < Generally higher at SP 0 Depth (m) OP SP NS 5")
9
NH 4 (µM) 0 0 0 1-2 4-5 3 5-6 16 22 50-110 2 4-7 8 17 1-2 7 2-3 4-5 55 8-10 5 1 More variation and higher in deep water at OP Depth (m) 0 2 4 6 0 1 2 3 4 5 OP SP NS
 More variation and higher in deep water at OP Depth (m) OP SP NS")
10
PO 4 (µM) 0 0 0 0 0-.6 3 14-21 4 1 0-.6 Similar overall, but higher in deep water in OP Depth (m) 0 2 4 6 0 1 2 3 4 5 OP SP NS
 Similar overall, but higher in deep water in OP Depth (m) OP SP NS")
12
Oyster PondSalt Pond Salinity (ppt)1-2 (12.5)25 (27) Dissolved Oxygen (mgL -1 ) 9-11 (1.4)8 (3) Nitrate µM1 (0)3 (0) Ammonium µM1-2 (107)4-5 (55) Phosphate µM0-.6 (21)0-.6
1-2 (12.5)25 (27) Dissolved Oxygen (mgL -1 ) 9-11 (1.4)8 (3) Nitrate µM1 (0)3 (0) Ammonium µM1-2 (107)4-5 (55) Phosphate µM0-.6 (21)0-.6")
13
-phosphate concentrations low, salinities above 10ppt usually N-limited

14
Oyster Pond Transect Points 2004 points2001 points

15
2004 OP 2001 to 2004 Comparison Plots

16
Conclusions Comparison of Oyster Pond to Salt Pond - no difference in dissolved oxygen - lower nitrate, ammonium, salinity in OP - higher phosphate (only at depth) in OP Limiting nutrients -Both nitrogen and phosphate are limiting in OP and SP Interannual difference in Oyster Pond - no difference in salinity or dissolved oxygen - lower nitrate than 2001 - higher ammonium and phosphate (only at depth) than 2001
 in OP Limiting nutrients -Both nitrogen and phosphate are limiting in OP and SP Interannual difference in Oyster Pond - no difference in salinity or dissolved oxygen - lower nitrate than higher ammonium and phosphate (only at depth) than 2001")
17
Acknowledgments Oyster Pond Watershed Residents Jen Bowen & Ivan Valiela The Fish Group Boston University Marine Program

Similar presentations


 and dissolved.>")


