Download presentation
Presentation is loading. Please wait.

2
Simple Steps Significant Results

3
What is my Income Potential?

5
Actions - Recognition Top 3 – Vice President Sales Leader / Executive Vice President Sales Leader Top 5 – Senior Executive Sales Leader Top 7 – Executive Sales Leader Top 10 – Sales Leader Top 20 – Team Coordinator Top 50 – Sales Consultants

6
Almost Achievers Send an email to all Consultants who have sales between $1000 - $1499. Sample Copy: Congratulations! As a result of your hard work and dedication to your business, your personal sales in June were over $1000! If you submit $1500 in Subtotal A Sales in July, you will earn free NEW products.

7
Communication Strategy for Sales Consultants Dormant & Inactive will receive: Impressions Newsletter 1 st of month email One email on the 5 th of each month that speaks directly to the Consultant about product; highlighting Customer specials, product tips & demo ideas with a link to the Impressions newsletter.

8
Flash Sale

10
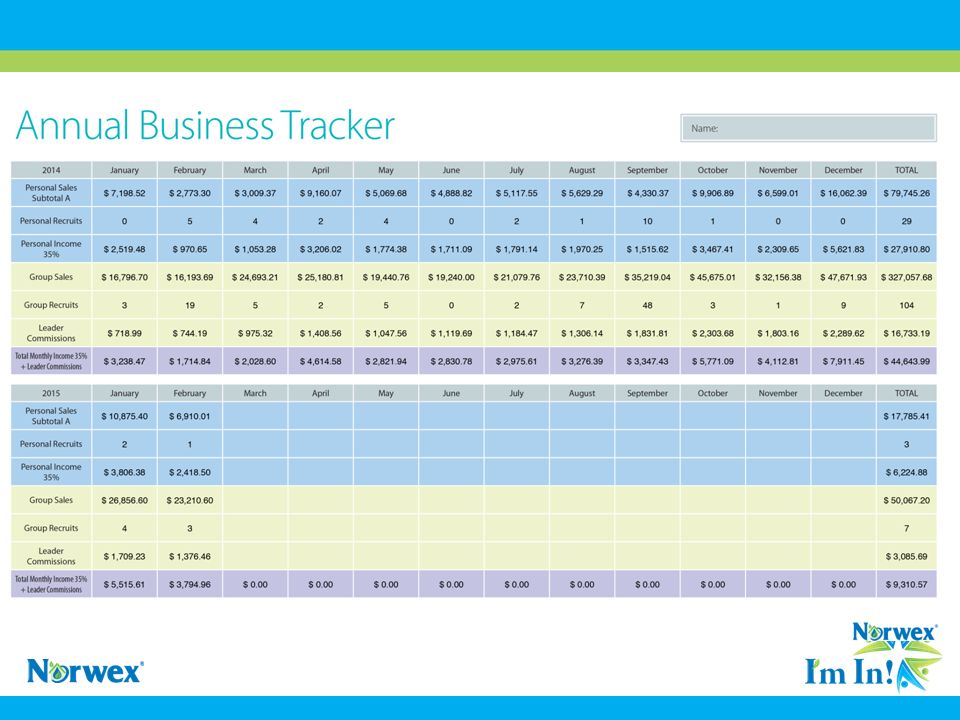
2 Month Plan and Annual Tracker

11
Benefits of the Business Tracker – Track % of growth or decline How to calculate percentages: % Increase = New Number - Original Number Then: divide the increase by the original number and multiply the answer by 100. % increase = Increase ÷ Original Number × 100 http://www.percentagecalculator.net/

12
Percentage Increase Number of Parties Sales – Personal and Group Recruits – Personal and Group Leader Promotions

13
4878.00 (new) - 4050.08 (original) = 827.92 (increase) 827.92/4050.08 =.204 x 100 = 20.44% Increase in Personal Sales in 2015 is 20.44%
 (original) = (increase) / =.204 x 100 = 20.44% Increase in Personal Sales in 2015 is 20.44%")
14
25,382.00 (new) - 21,000.00 (original) = 4,382.00 (increase) 4382/21000 =.2086 x 100 = 20.86% Increase in Group Sales in 2015 is 20.86%
 - 21, (original) = 4, (increase) 4382/21000 =.2086 x 100 = 20.86% Increase in Group Sales in 2015 is 20.86%")
15
Recruiting – How much in Sales = 1 New Consultant 2014: Recruits = 9 / Sales =26,397.88 = 1 Recruit per every $2933.09 in Sales 2015: Recruits = 16 / Sales = 24,050.92 = 1 Recruit per every $1503.18 in Sales

16
2014: Recruits = 7 / Sales =110,491.20 = 1 Recruit per every $15,784.45 in Group Sales 2015: Recruits = 33 / Sales = 210,679.00 = 1 Recruit per every $6,384.21 in Sales Group Recruits

17
Conversion Rate Personal 2014: Recruits = 9 in 6 months Sales =26,397.88 1 Recruit for every $2933.09 in Sales Personal 2015: Recruits = 16 in 6 months Sales = 24,050.92 1 Recruit for every $1503.18 in Sales Group 2014: Recruits = 7 in 6 months Sales =110,491.20 1 Recruit for every $15,784.45 in Group Sales Group 2015: Recruits = 33 in 6 months Sales = 210,679.00 1 Recruit for every $6,384.21 in Sales

18
What is my Income Potential?

19
Monthly, Quarterly, Annual

21
Simple Steps Significant Results

22
Senior Leader Reception You are Invited Thursday, July 30 Hilton Minneapolis Conrad A 9;30 pm

Similar presentations