Download presentation
Presentation is loading. Please wait.

1
Decision Trees November 18, 2013

2
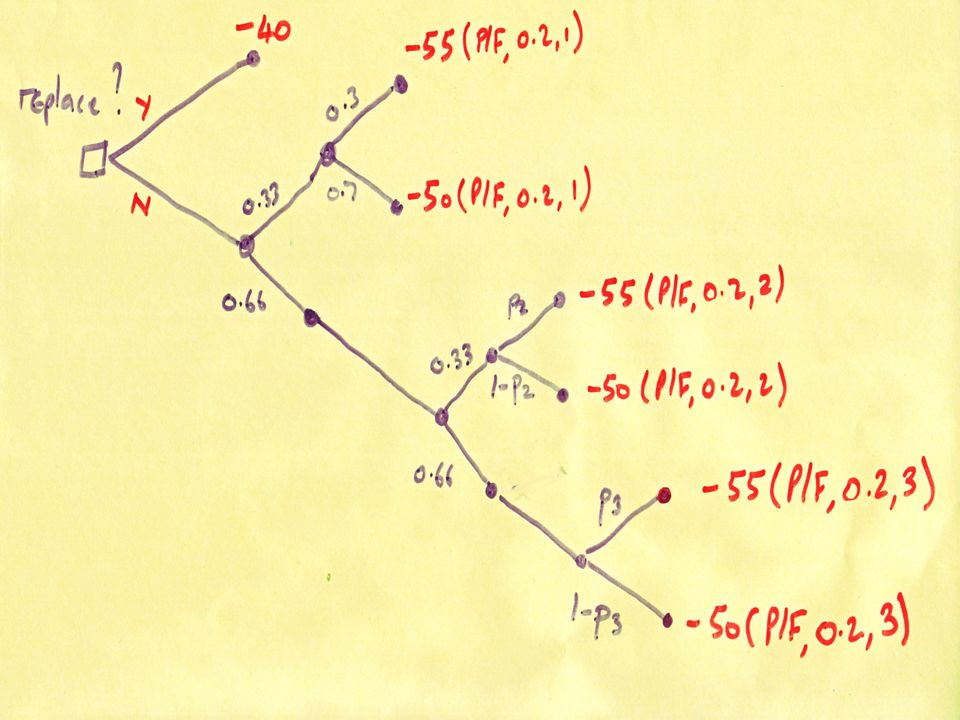
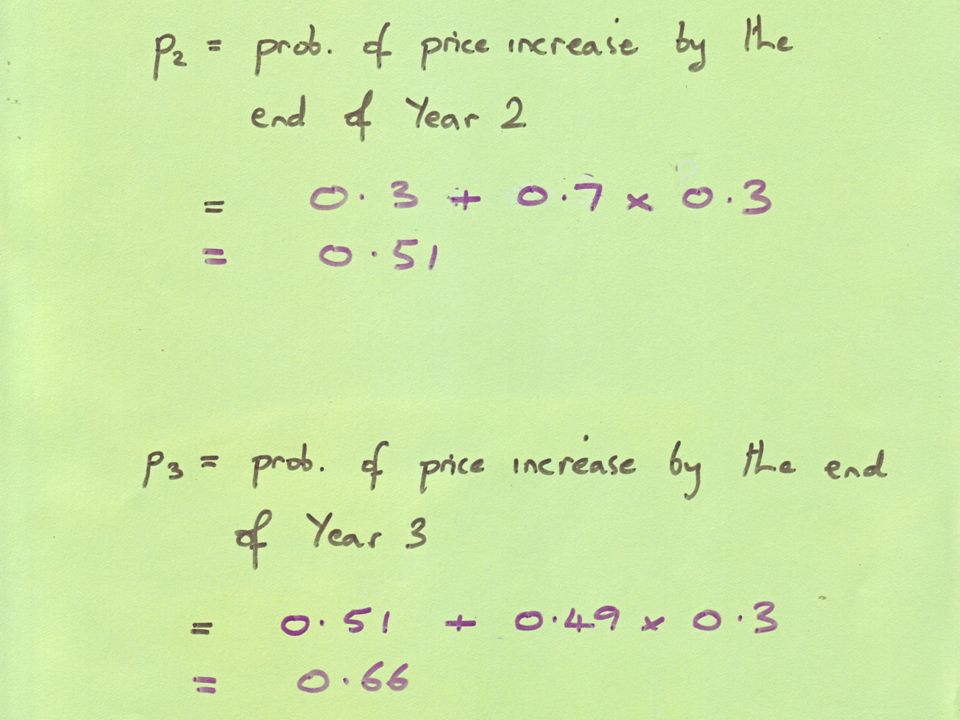
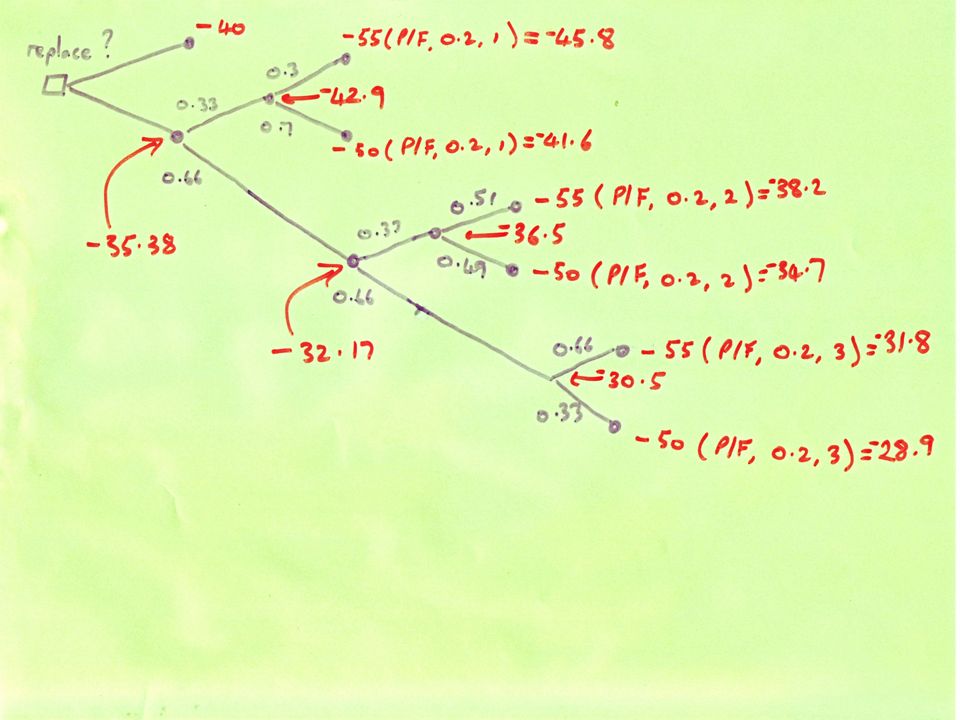
Example: we have a machine which may break down at any time over the next three years. We can replace it now, at a cost of $40,000, or we can keep it in service till it breaks. That will cost us $10,000 in lost production, and we will have to pay to have it replaced. Every year, there is a 30% chance that the cost of a replacement will go up by $5,000, though we don’t expect there to be more than one such increase in the next three years. Our MARR is 20%.

4
Example: we have a machine which may break down at any time over the next three years. We can replace it now, at a cost of $40,000, or we can keep it in service till it breaks. That will cost us $10,000 in lost production, and we will have to pay to have it replaced. Every year, there is a 30% chance that the cost of a replacement will go up by $5,000, though we don’t expect there to be more than one such increase in the next three years. Our MARR is 20%.

7
Your company has developed a new design of mobile phone. You need to decide whether to manufacture and market it in China or North America. If you manufacture in China, the fixed costs will be $4,000,000, and the variable costs per phone will be $15. If you manufacture in North America, the fixed costs may be anywhere from $3,000,000 to $4,000,000, and the variable costs per phone will be between $15 and $20. Shipping across the Pacific will add $10 per phone. If you sell at $30 in China, you expect to sell 300,000-400,000 units. If you sell for $40, you can expect these figures to be halved. In North America, if you sell at $40 you expect to sell 100,000 to 300,000, and these figures will be halved if you sell at $50.

8
North America China Start with a decision node…

9
Make further decisions… Make in China Make in NA Sell in China Sell in NA

10
Make further decisions… $30 $40 $50 $40 $50 Sell China Sell NA Sell China Sell NA

11
Label leaf nodes… $30 $40 $50 $40 $50 Sell China Sell NA Sell China Sell NA NN40 NN50 CC3 0

12
Construct `chance’ trees from leaf nodes… CC30 Sell 300,000 Sell 400,000

13
Calculate PW (omit (P/F) factors, since they’re the same on all branches; figures in $000’s) CC30 Sell 300,000 Sell 400,000 PW = -4,000+300(30-15) = -4,000+4,500 = 500 PW = -4,000+400(30-15) = -4,000+6,000 = 2,000
 factors, since they’re the same on all branches; figures in $000’s) CC30 Sell 300,000 Sell 400,000 PW = -4, (30-15) = -4,000+4,500 = 500 PW = -4, (30-15) = -4,000+6,000 = 2,000")
14
Calculate average PW CC30 Sell 300,000 Sell 400,000 PW = 500 PW = 2,000 E(x)=1,250
=1,250")
15
Calculate variance and standard deviation CC30 Sell 300,000 Sell 400,000 PW = 500 PW = 2,000 E(x)=1,250 Var(x) = 0.5 × (1,250-500) 2 + 0.5 × (1,250-2,000) 2 = 562,500 s.d. = 750

16
For some leaf nodes, the process is more complicated… NN40 Fixed cost 300,000 Fixed cost 400,000 VC 15 VC 20 Sell 100,000 Sell 300,000

17
NN40NN40 NN40NN40 VC 15 VC 20 Sell 100K Sell 300K FC 300K PW=-3,000+100(40-15) = -500 PW=-3,000+300(40-15) = 5,500
 = -500 PW=-3, (40-15) = 5,500")
18
NN40NN40 NN40NN40 VC 15 VC 20 Sell 100K Sell 300K FC 300K PW=-3,000+100(40-15) = -500 PW=-3,000+300(40-15) = 5,500 FC 400K PW= -1,000 PW= 3,000 PW= -1,500 PW= 4,500 PW= -2,000 PW= 2,000
 = -500 PW=-3, (40-15) = 5,500 FC 400K PW= -1,000 PW= 3,000 PW= -1,500 PW= 4,500 PW= -2,000 PW= 2,000")
19
NN30NN30 NN30NN30 VC 15 VC 20 Sell 100K Sell 300K FC 300K PW= -500 PW= 5,500 FC 400K PW= -1,000 PW= 3,000 PW= -1,500 PW= 4,500 PW= -2,000 PW= 2,000 E(x) = 1,250 Var = 4,570,000 s.d. = 2,137

20
Mark these results on the decision tree $30 $40 $50 $40 $50 Sell China Sell NA Sell China Sell NA Mean = 1,250, sd = 750 Mean = 375, sd = 625 Mean = -1,000, sd = 1,500 Mean = -1,500, sd = 1,250 Mean = 1,250, sd = 2,137 Mean = -250, sd = 1,639 Make in China Make in NA

21
Mark these results on the decision tree $30 $40 $50 $40 $50 Sell China Sell NA Sell China Sell NA Mean = 1,250, sd = 750 Mean = 375, sd = 625 Mean = -1,000, sd = 1,500 Mean = -1,500, sd = 1,250 Mean = 1,250, sd = 2,137 Mean = -250, sd = 1,639 Make in China Make in NA

22
The China/China option is mean-variance dominant $30 $40 $50 $40 $50 Sell China Sell NA Sell China Sell NA Mean = 1,250, sd = 750 Mean = 375, sd = 625 Mean = -1,000, sd = 1,500 Mean = -1,500, sd = 1,250 Mean = 1,250, sd = 2,137 Mean = -250, sd = 1,639 Make in China Make in NA

23
The Monte Carlo Method

25
Illustrative example: How to calculate π using a shotgun

26
Step One:Draw a circle in a square

27
Note that, if the side of the square is 2, then the area of the square is 4 and the area of the circle is π 2

28
Blast the target with your shotgun

29
Count the number of holes inside the circle and the number inside the square. Their ratio approximates π /4

30
In this case, we find that π is about 4 × 10 ⁄ 13 = 3.08

31
To get an improved estimate, we take more shots

32
j = 0; for (i=1; i <= 1000000; i++) { x = rnd(); y = rnd(); if ((x 2 + y 2 ) < 1) j++; pi_Estimate = 4 * real(i)/real(j) }
 { x = rnd(); y = rnd(); if ((x 2 + y 2 ) < 1) j++; pi_Estimate = 4 * real(i)/real(j) }")
33
j = 0; for (i=1; i <= 1000000; i++) { x = rnd(); y = rnd(); if ((x 2 + y 2 ) < 1) j++; pi_Estimate = 4 * real(i)/real(j) } In the square
 { x = rnd(); y = rnd(); if ((x 2 + y 2 ) < 1) j++; pi_Estimate = 4 * real(i)/real(j) } In the square")
34
j = 0; for (i=1; i <= 1000000; i++) { x = rnd(); y = rnd(); if ((x 2 + y 2 ) < 1) j++; pi_Estimate = 4 * real(i)/real(j) } Is it in the circle?
 { x = rnd(); y = rnd(); if ((x 2 + y 2 ) < 1) j++; pi_Estimate = 4 * real(i)/real(j) } Is it in the circle")
35
π

36
π

37
π

38
π

39
Applying Monte Carlo analysis to economic problems:

40
Your company has developed a new design of mobile phone. You need to decide whether to manufacture and market it in China or North America. If you manufacture in China, the fixed costs will be $4,000,000, and the variable costs per phone will be $15. If you manufacture in North America, the fixed costs may be anywhere from $3,000,000 to $4,000,000, and the variable costs per phone will be between $15 and $20. Shipping across the Pacific will add $10 per phone. If you sell at $30 in China, you expect to sell 300,000-400,000 units. If you sell for $40, you can expect these figures to be halved. In North America, if you sell at $40 you expect to sell 100,000 to 300,000, and these figures will be halved if you sell at $50. It will take 2 to 4 years to begin manufacture, and your MARR is between 10 and 15%.

41
Step 1: Build the deterministic model (this may be a computer program or set of spreadsheet formulae) PW(NN30) = (Fixed_Cost – Sales(30 -Variable_Cost))(P/F, i, N) PW(NN40) = (Fixed_Cost – Sales(40 -Variable_Cost))(P/F, i, N) Do a sample calculation to make sure it works.
 PW(NN30) = (Fixed_Cost – Sales(30 -Variable_Cost))(P/F, i, N) PW(NN40) = (Fixed_Cost – Sales(40 -Variable_Cost))(P/F, i, N) Do a sample calculation to make sure it works.")
42
Step 2: Decide what the probability distribution is for each random variable: Fixed Cost p(Fixed Cost) $3M$3.5M$4M
 $3M$3.5M$4M")
43
Step 3: The random numbers you are going to generate will be uniformly distributed between 0 and 1. This is fine if the variable you are modelling happens to be uniformly distributed between 0 and 1, but what if it’s normally distributed between $3M and $4M?

44
First form the cumulative distribution function Fixed Cost $3M$4M p(Fixed Cost < x)
")
45
Then discretize it x2x2 $3M$4M x1x1 x3x3 p(x<x 1 ) p(x<x 2 ) p(x<x 3 )
 p(x<x 2 ) p(x<x 3 )")
46
Pick z = rnd() x2x2 $3M$4M x1x1 x3x3 p(x<x 1 ) p(x<x 2 ) p(x<x 3 ) z
 x2x2 $3M$4M x1x1 x3x3 p(x<x 1 ) p(x<x 2 ) p(x<x 3 ) z")
47
Now if p(x<x 2 ) < z < p(x<x 3 ), X =(x 2 +x 3 )/2 x2x2 $3M$4M x1x1 x3x3 p(x<x 1 ) p(x<x 2 ) p(x<x 3 ) z X
 < z < p(x<x 3 ), X =(x 2 +x 3 )/2 x2x2 $3M$4M x1x1 x3x3 p(x<x 1 ) p(x<x 2 ) p(x<x 3 ) z X")
48
Step 3a: The random numbers you are going to generate will be uniformly distributed between 0 and 1. This is fine if the variable you are modelling happens to be uniformly distributed between 0 and 1, but what if it’s a discrete random variable?

49
For example: ``There is a 30% probability that the government will levy a surcharge on phones imported from China.’’ Let z = rnd(); if z > 0.3, no surcharge
; if z > 0.3, no surcharge")
50
In this way, we generate random estimates for each parameter in the problem. Then we plug these parameters into the deterministic model, and get one possible value of the present worth. PW(NN30) 1 = (Fixed_Cost 1 – Sales 1 (30 -Variable_Cost 1 ))(P/F, i 1, N 1 ) Now do this a thousand times. PW(NN30) 1000 = (Fixed_Cost 1000 – Sales 1000 (30 -Variable_Cost 1000 ))(P/F, i 1000, N 1000 ) PW(NN30) 2 = (Fixed_Cost 2 – Sales 2 (30 -Variable_Cost 2 ))(P/F, i 2, N 2 )......
 1 = (Fixed_Cost 1 – Sales 1 (30 -Variable_Cost 1 ))(P/F, i 1, N 1 ) Now do this a thousand times. PW(NN30) 1000 = (Fixed_Cost 1000 – Sales 1000 (30 -Variable_Cost 1000 ))(P/F, i 1000, N 1000 ) PW(NN30) 2 = (Fixed_Cost 2 – Sales 2 (30 -Variable_Cost 2 ))(P/F, i 2, N 2 )")
51
What do we do with the 1,000 PW’s? We create a histogram: Find highest and lowest PW’s. Divide the interval between them into N bins of equal size. (N could be 10 or thereabouts) Count the number of cases in each bin. Then repeat for other possible strategies
 Count the number of cases in each bin. Then repeat for other possible strategies.")
52
Cases in Bin Present worth ($000’s) -5005500 NN30
 NN30")
53
Cases in Bin Present worth ($000’s) -5005500 NN30 CC30
 NN30 CC30")
54
Making a decision: The histogram provides somewhat more information than mean + variance. We may want to choose the strategy that has no chance of making a loss.

55
Other applications of the Monte Carlo method: First used in the Manhattan project N. Metropolis and S. Ulam, "The Monte Carlo Method", Journal of the American Statistical Association, volume 44, number 247, pp. 335–341 (1949)
.")
57
Used to simulate combustion in diesel engines:

58
Start with N 1 packets of air and N 2 packets of fuel. Each packet of fuel has an N 1 /(N 1 +N 2 ) chance of mixing with a packet of air.
 chance of mixing with a packet of air..")
59
After mixing has taken place, there is a delay for vaporization, then a second delay before combustion starts.

60
After combustion starts, each packet of fuel has a certain chance of mixing with air, and a certain chance of mixing with an already-combusted packet.

61
The outputs of the process are histograms of various output parameters: Soot emissionsNo x emissions

Similar presentations


>")


