Download presentation
Presentation is loading. Please wait.

2
Co-variation or co-relation between two variables These variables change together Usually scale (interval or ratio) variables
 variables")
3
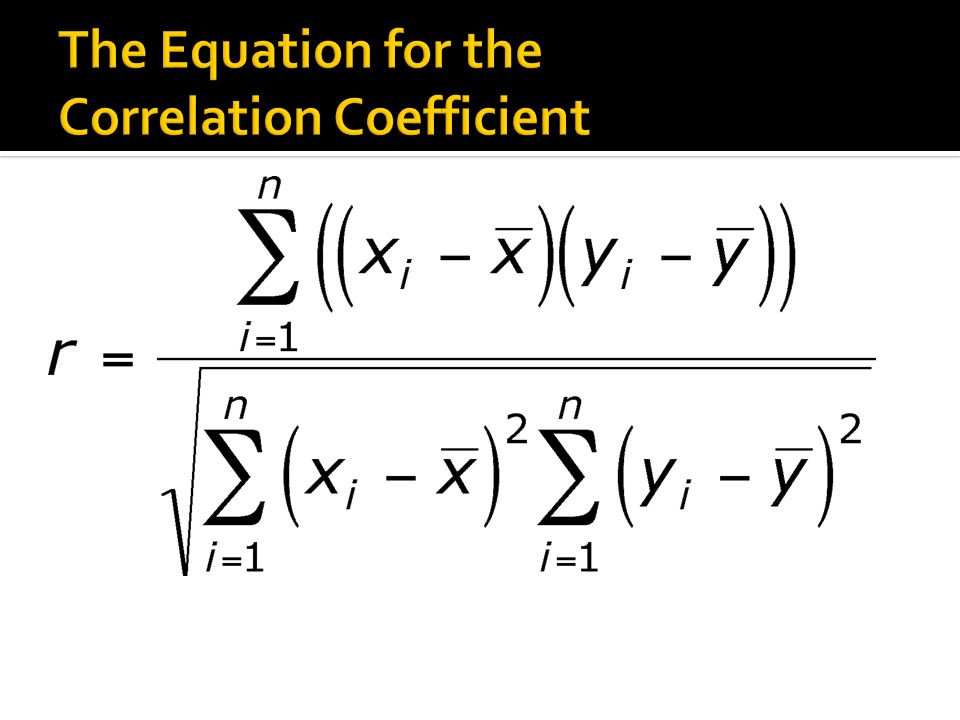
A statistic that quantifies a linear relation between two variables Can be either positive or negative Falls between -1.00 and 1.00 The value of the number (not the sign) indicates the strength of the relation
 indicates the strength of the relation")
5
Y X Y X Y Y X X Linear relationshipsCurvilinear relationships Slide from: Statistics for Managers Using Microsoft® Excel 4th Edition, 2004 Prentice-Hall

6
Y X Y X Y Y X X Strong relationshipsWeak relationships Slide from: Statistics for Managers Using Microsoft® Excel 4th Edition, 2004 Prentice-Hall

7
Y X Y X No relationship Slide from: Statistics for Managers Using Microsoft® Excel 4th Edition, 2004 Prentice-Hall

8
8

9
Association between variables such that if one variable increases, then the other increases. A direct relation between the variables

10
Association between variables such that if one variable increases, then the other decreases An inverse relation between the variables

13
+.70 or higher Very strong positive relationship +.40 to +.69 Strong positive relationship +.30 to +.39 Moderate positive relationship +.20 to +.29 Weak positive relationship +.01 to +.19 No or negligible relationship -.01 to -.19 No or negligible relationship -.20 to -.29 Weak negative relationship -.30 to -.39 Moderate negative relationship -.40 to -.69 Strong negative relationship -.70 or higher Very strong negative relationship

14
Something to think about There is a 0.91 correlation between ice cream consumption and drowning deaths. Does eating ice cream cause drowning? Does grief cause us to eat more ice cream?

15
15 Correlation is NOT causation -e.g., armspan and height

17
Correlation is not causation. Invisible third variables Three Possible Causal Explanations for a Correlation

18
Correlation coefficient quantifies the linear relationship of two variables Also called r or r factor Shows how strongly they are connected Not proof of causality (causation)
")
Similar presentations


>")
. Correlation coefficient: statistic.>")


