Download presentation
Presentation is loading. Please wait.

1
Battelle for Kids and ACT, Inc.: Using Value-Added Analyses and QualityCore in Ohio to Better Prepare All Student for College and Career Jim Morris, ACT, Inc. jim.morris@act.org Mark Hartman, Battelle for Kids mhartman@battelleforkids.org Mark Black, Principal, GlenOak High School blackm@plainlocal.org

2
College Readiness Benchmarks *The ACT Benchmark Score indicates a 50% chance of obtaining a “B” or a 75% chance of obtaining a “C” in corresponding credit-bearing college courses. Test College Course(s)EXPLOREPLAN ACT English English Composition13/141518 Math College Algebra17/181922 Reading Social Sciences15/161721 Science Biology20/202124
EXPLOREPLAN ACT English English Composition13/ Math College Algebra17/ Reading Social Sciences15/ Science Biology20/")
3
Common Course Patterns Value Added for English and Mathematics

4
Common Course Patterns Value Added for Social Science and Natural Science

5
Every student should be prepared to a standard of readiness for postsecondary education and work

6
October 2004 Crisis at the Core 2005 College Readiness Standards February 2005 On Course for Success May 2006 Ready for College and Ready for Work: Same or Different? March 2006 Reading Between the Lines April 2007 National Curriculum Survey May 2007 Rigor at Risk 20052006200720082009 2008 The Forgotten Middle Research The Foundation of ACT

7
1950196019701980199020002010 November 7, 1959 First administration of the ACT Assessment to 75,406 students 1986 First administration of PLAN 1989 Enhanced ACT introduced: English, Math, Reading & Science 1992 First administration of EXPLORE 2005 Optional Writing test added to The ACT 2007 QualityCore is introduced History College Readiness System

8
Six Steps to Improving College Readiness Components of ACT’s College Readiness System That Can Help Essential StandardsCollege Readiness Standards – validated as the standards most essential for readiness to succeed in college or in a career Common ExpectationsLongitudinal Assessments – help measure student progress in Core curriculum coursework Clear Performance StandardsCollege Readiness Benchmark Scores – Provide the scores students need to have a high likelihood of being on target for college readiness Rigorous High School CoursesInstruction – QualityCore – 9 th -12 th grade instructional improvement Early Monitoring and InterventionLongitudinal Assessments, EXPLORE & PLAN – help facilitate early intervention Data-Driven DecisionsLongitudinal System – helps schools monitor student performance from middle school through high school College Readiness System The Solution

9
College Readiness Standards Benchmarks National Curriculum Survey Postsecondary expectations Secondary instruction High Achieving Schools Courses, Practices, Materials QualityCore Course-specific knowledge and skills Best Practices Development

10
Is a uniquely research-based curriculum program designed to raise the quality and intensity of high school core courses for all students Focuses on fewer, clearer, and higher standards that are essential for college and career readiness in each course Uses formative and summative assessments to guide effective, targeted instruction Features of QualityCore

11
Measures student progress in each course toward college and career readiness Provides professional development resources, tools and opportunities to teachers and leaders Customizes instruction to the needs of specific classrooms, schools, and districts

12
QualityCore Course Objectives and College Readiness Standards Alignment document between QualityCore course objectives and College Readiness Standards Available on SharePoint.

13
Internationally Benchmarked Benchmarked against the frameworks and standards of high performing countries. Like the Common Core, QualityCore aligns well to international standards and frameworks.

15
English 9, 10, 11, 12 Algebra I Geometry Algebra II Pre-Calculus Biology Chemistry Physics U.S. History Available Courses

16
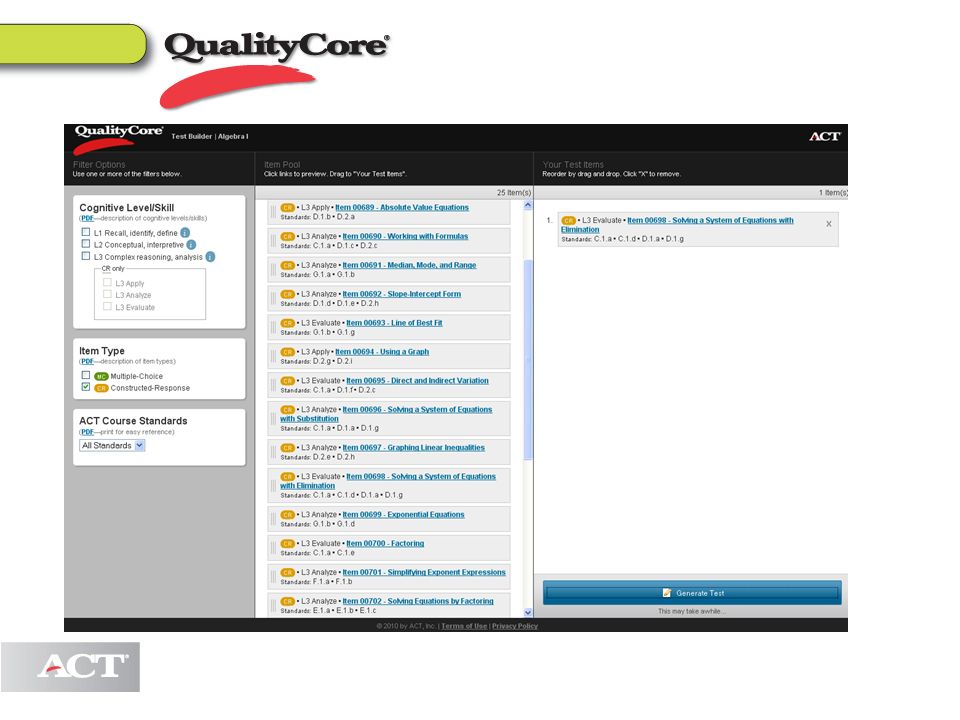
Course-specific college readiness skills End-of-Course assessments A live formative item pool for benchmark assessments Instructional resources Implementation support Professional Development option QualityCore consists of…

17
24/7 Online Access for Educators

19
Two 45-minute multiple-choice components (35 score items each) OR One multiple-choice component plus a 45- minute constructed-response component. (1-3 items) End-of-Course Assessments NOTE: Available in paper and pencil and computer based formats
 End-of-Course Assessments NOTE: Available in paper and pencil and computer based formats.")
21
Student Overview Report Includes estimated College Readiness Indicator based on ACT’s College Readiness Benchmark

22
Long term vs. Short term preparation There is a difference! Quality Core is the answer to long term foundational improvement

23
Ohio Value-Added High Schools Project Mark Hartman, Battelle for Kids

24
Copyright ©2010. Battelle for Kids. Understand the goals and outcomes of OVAHS including value-added/T-CAP Understand the possibility of future reports Discover what we have learned from highly effective teachers Learning Targets

25
Copyright ©2010. Battelle for Kids. The right people! The right metrics! The right practices! About us – http://www.battelleforkids.org

26
Copyright ©2010. Battelle for Kids. Why Use Value-Added in Lieu of Pure Achievement? Student A Student B Proficient

27
Copyright ©2010. Battelle for Kids. School Achievement and Poverty Level

28
Copyright ©2010. Battelle for Kids. School Value-Added Gains and Poverty Level

29
Copyright ©2010. Battelle for Kids. Teacher Effects

30
Copyright ©2010. Battelle for Kids. What Has Happened So Far? High schools ordered more than 62,000 end-of- course exams (over 80,000 in year 2) High schools completed and scored 53,312 end-of- course exams 25,422 students participated in the testing in nine subject areas (projecting 31,000) 36 (44) Ohio urban, rural and suburban high schools administered the tests. In addition, STEM, digital, career technical and early college high schools were represented in the mix.
 High schools completed and scored 53,312 end-of- course exams 25,422 students participated in the testing in nine subject areas (projecting 31,000) 36 (44) Ohio urban, rural and suburban high schools administered the tests. In addition, STEM, digital, career technical and early college high schools were represented in the mix..")
31
Copyright ©2010. Battelle for Kids. Hope! Jobs $1 million for ever student $10,000 - $50,000 for every family A talented and qualified workforce All students!

32
Copyright ©2010. Battelle for Kids. Ohio Job Outlook

33
Copyright ©2010. Battelle for Kids. The Key to Opportunity is Education Less than high school High school graduate Some college, no degree Associate’s degree Bachelor’s degree Master’s degree Graduate degree Professional degree Unemployment RateAverage Annual Earnings 7.00% 3.50% 0.00% $0K$40K$80K$120K Source: Bureau of the Census, Bureau of Labor Statistics; published by Postsecondary Education OPPORTUNITY; 2006 Unemployment rate, 2005 Earnings

34
Copyright ©2010. Battelle for Kids. Not Just Another Test! Cultural Changes For teachers For students For parents For communities

35
Copyright ©2010. Battelle for Kids. 15%59%55%

36
Copyright ©2010. Battelle for Kids. What Will the August Reports Say?

37
Copyright ©2010. Battelle for Kids. ACT College Entrance – OVAHS Trends OVAHS English 4% Math 5.11% Science 3% Reading 3% CCNY “Deep Dive” English 7.61% Math 9.15% Science.83% Reading 6.87% Note: 3 of 7 ACT administration - 2009

38
Copyright ©2010. Battelle for Kids. Introductio n Professiona l Learning Teams Overview Learning Targets Assessmen t Design Actionable Strategies AFL Works!

39
Copyright ©2010. Battelle for Kids. 1. Teacher Value-Added Summary 2. District Alert Summary 3. Annual School Value-Added and Diagnostic Summary What Creative Reporting is Occurring?

40
Copyright ©2010. Battelle for Kids. Teacher Value- Added Summary Jane Doe John Doe James Doe

41
Copyright ©2010. Battelle for Kids. Teacher Value- Added Summary Jane Doe John Doe James Doe Jane Doe John Doe James Doe Jason Doe Janet Doe

42
Copyright ©2010. Battelle for Kids.

45
Sample T-CAP Report

46
Copyright ©2010. Battelle for Kids. BFKLINK™

47
Copyright ©2010. Battelle for Kids. BFKLINK™

48
Copyright ©2010. Battelle for Kids. XYZ

49
Copyright ©2010. Battelle for Kids. Jane Doe

50
Copyright ©2010. Battelle for Kids. Jane Doe

51
Copyright ©2010. Battelle for Kids. Jane Doe

52
Copyright ©2010. Battelle for Kids. Jane Doe John Doe Jane Doe John Doe Jane Doe John Doe Jane Doe John Doe Jane Doe John Doe Jane Doe John Doe Jane Doe John Doe Jane Doe John Doe Jane Doe John Doe Jane Doe John Doe Jane Doe John Doe Jane Doe

53
Copyright ©2010. Battelle for Kids. College Projections Level 2: Youngstown State University, University of Akron and Cleveland State University Level 3: Kent State University, Bowling Green State University, University of Toledo and Wright State University Level 4: University of Cincinnati and Ohio University Level 5: Ohio State University and Miami University Level 5+: Brown University, Columbia University, Cornell University, Dartmouth College, Harvard University, Princeton University, University of Pennsylvania and Yale University

54
Copyright ©2010. Battelle for Kids. Adapted Competing Values Framework Flexibility & Openness Structure & Control Internal FocusExternal Focus Child-Centered Focus Relationships Support Collaboration Responsive teaching Student ownership of learning Relevance Classroom Environment Rules Structures Control Routines Classroom management/control Professional Growth and Leadership Passion Adaptability Flexibility Creativity Instructional improvement Instruction that works for every student High Expectations Productivity High quality student work Rigor Differentiation Competitiveness

55
Copyright ©2010. Battelle for Kids. Evaluation Congruence Study

56
Copyright ©2010. Battelle for Kids. T-CAP Lessons Learned Professional Development Data Quality Source Data Attribution Linkage White Paper: The Importance of Accurately Linking Instruction to Students to Determine Teacher Effectiveness (funded by The Bill & Melinda Gates Foundation & available at www.Battelleforkids.org)

57
Copyright ©2010. Battelle for Kids. OVAHS Lessons Learned A college- and career-ready curriculum matters! QualityCore Teachers want reliable data to help them improve their practice Teacher-level value-added reports Collaboration with other professionals matters when it is backed up by data Formative assessment makes a difference

58
Copyright ©2010. Battelle for Kids. Questions?

59
www.BattelleforKids.org Mark Hartman, Battelle for Kids mhartman@BattelleforKids.org

60
GlenOak High School Plain Local School District Canton, Ohio

61
GlenOak High School Student Population * 1950 Teacher Population * 96 Academy Focus Course Offerings Career Tech and Tech Prep Dual Credit AP Courses PSEO Virtual Offerings

62
GlenOak High School Demographics & Disadvantage Breakdown Ethnicity Percentages Asian 1% African American 13% Hispanic 1% Multi-Racial 3% Caucasian 82% Free and Reduced Lunch 31% Special Education Population 17.54%

63
Community Partners Mercy Medical Stark State Mount Union Buckeye Council Stark County Library Plain Township Parks Department Herbert W. Hoover Foundation

64
WHAT IS OUR SERVICE AGREEMENT SERVICE AGREEMENT WITH OUR STAKEHOLDERS?

65
At GlenOak High School We Believe Our Service Agreement is: Focusing on learning. Developing the whole child. Maximizing student potential. Valuing each student as an individual. Personalizing a learning environment that is relevant. that is relevant.

66
Our Initiatives Here at GlenOak High School GLOBAL SCHOLARSEXPLORE SCHEDULES SBE ATTENDANCE PLC PSAT SBE ATTENDANCE PLC PSAT OGT INTERSESSION ACADEMIC ASSIST OGT INTERSESSION ACADEMIC ASSIST DISCIPLINE CONFERENCES OCIS DISCIPLINE CONFERENCES OCIS AP RTI ACT SAS AP RTI ACT SAS GRADING TECHNOLOGY OIP CAPSTONE CORE CURRICULUM ACT DUAL CREDIT BLT CORE CURRICULUM ACT DUAL CREDIT BLT PSEO END-OF-COURSE EXAM SAT PLAN DECISION FRAMEWORK COMPASS ELECTRONICS DECISION FRAMEWORK COMPASS ELECTRONICS

67
Goals for Service Agreement Average Composite Score of 25 on the ACT Every AP student to take the AP Test and average a score of 3.5 average a score of 3.5 To have a National Merit Scholar every year Performance Index Score to be 110

68
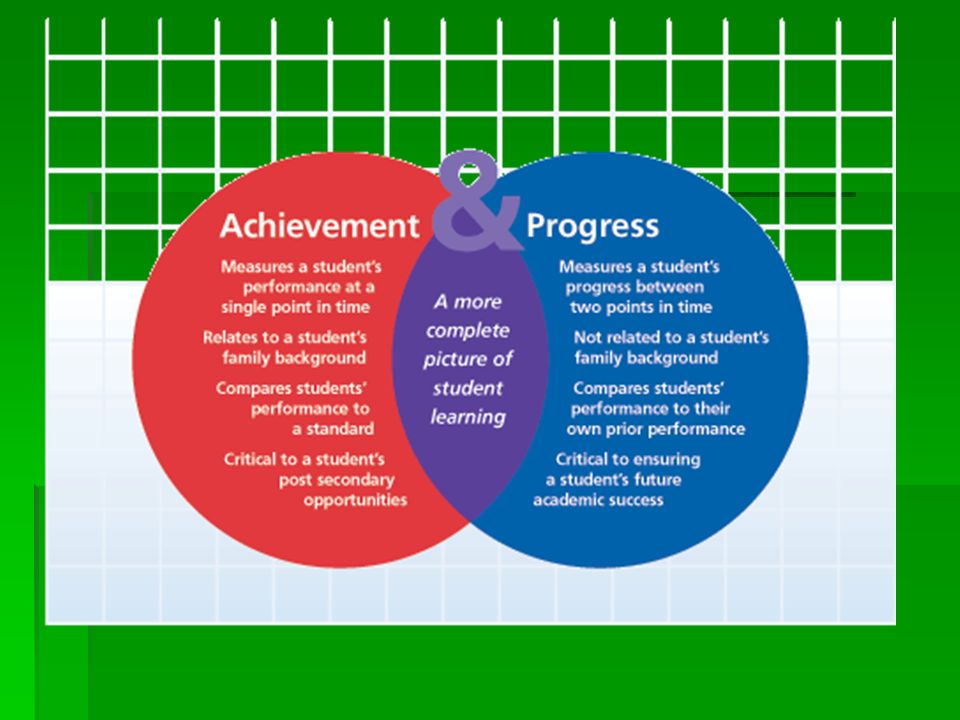
We came to understand that Soaring Beyond Excellence We came to understand that Soaring Beyond Excellence is a progression of student growth. is a progression of student growth. How can we measure both How can we measure both student achievement and progress? student achievement and progress?

69
“Soaring Beyond Excellent” is not achieved through rote compliance, but by understanding that relevance makes rigor possible.

70
QUESTIONS How do we aspire students to be excellent? What does it mean to be excellent? How do you measure excellence? How do our students measure their excellence?

71
Achievement vs. Progress Achievement has typically been measured by a student’s performance on state tests based on the proficiency bar. Progress is measured by how much “gain” or “growth” students make over time (i.e., year to year, semester to semester, etc)
.")
73
A View of Student Progress: Accountability Perspective Student A Student B Proficient

74
Next Steps in Moving Towards Excellence We aspire to prepare our students to be college ready and career ready...

75
TOOLS FOR MEASURING ACADEMIC ACHIEVEMENT/PROGRESS FORMATIVE ASSESSMENTS SUMMATIVE ASSESSMENTS EXPLORE PLAN END OF THE COURSE EXAMS

76
BENEFITS OF THE PLAN TEST Show the strengths and weaknesses in English, Math, Reading, And Science Identifies if you are on target for college Assists the student in finding careers that match their interest Prepares students for the ACT exam Identifies growth development from Explore Test taken in the 8 th grade year

77
BENEFITS OF THE EXPLORE TEST Allows for a student to know where they stand right now Provides students with information on college/career readiness requirements Students are able to review their plans/goals after high school Identify students strengths and weaknesses

78
BENEFITS OF THE END-OF-COURSE EXAMS All stakeholders will have information that will allow them to monitor all students progress from low achieving to high achieving and to ensure growth opportunities for everyone Teachers can better assess their effectiveness by examining both progress and achievement measures Administrators can make a valid comparison between buildings both within and across school districts District to engage staff at all levels in conversation about improvements Students and parents are provided with data to make an informed decision on courses and career paths

79
SHARING THE EXPLORE, PLAN & END-OF COURSE RESULTS Share results with Administrative Team & Curriculum Department Team Leaders PLC Students Parents

80
IMPACT OF THE EXPLORE, PLAN & END-OF-COURSE EXAMS AT GLENOAK HIGH SCHOOL Changing the way We do business…

81
We aspire to have all students college ready/work ready ASSESS ENRICH OR INTERVENE ACCESS

82
English & Social Studies Courses 9th Grade 10th Grade 11th Grade 12th Grade 9th Grade 10th Grade 11th Grade 12th Grade Dual Cred English IV Dual Cred English IV Hon English I Hon English II AP English III AP English IV English I English II English III English IV Hon World St AP US HistoryAP US Political World St US HistoryUS Political Electives for 11th/12th: AP World History (full-year) Electives for 11th/12th: AP World History (full-year) Psychology (sem) / AP Psychology(sem) Psychology (sem) / AP Psychology(sem) Sociology (sem)Holocaust (sem) Sociology (sem)Holocaust (sem)
 Electives for 11th/12th: AP World History (full-year) Psychology (sem) / AP Psychology(sem) Psychology (sem) / AP Psychology(sem) Sociology (sem)Holocaust (sem) Sociology (sem)Holocaust (sem)")
83
Mathematics Courses Mathematics Courses Year 1 Year 2 Year 3 Year 4 Year 5 Year 1 Year 2 Year 3 Year 4 Year 5 Hon Alg IHon Geom Hon Alg II Dual Cred Precalc AP Calc Alg I Geom Alg II Precalc AP Stats Alg I Geom Alg II Precalc AP Stats College Alg College Alg Dual Cred College Alg Dual Cred College Alg Alg IIA Alg IIB Alg IIA Alg IIB

84
Science Courses Required 9th: Integrated Physical Science I Honors Integrated Physical Science Required 10th:Biology Honors Biology AP Biology (replaces Biogenetics) Elective Science Courses for Grades 10 - 12 Anatomy & PhysiologyChemistryTropical Biology Dual Credit Anatomy & PhysiologyHonors Chemistry Scientific Research AP Chemistry AP Chemistry PhysicsEarth Science (new) Dual Credit PhysicsEnvironmental Science (replaces Ecology) AP PhysicsAP Environmental Science (new)
 Elective Science Courses for Grades Anatomy & PhysiologyChemistryTropical Biology Dual Credit Anatomy & PhysiologyHonors Chemistry Scientific Research AP Chemistry AP Chemistry PhysicsEarth Science (new) Dual Credit PhysicsEnvironmental Science (replaces Ecology) AP PhysicsAP Environmental Science (new)")
85
Foreign Language Courses Hon Spanish IHon Spanish II Hon Spanish IIIAP Spanish Spanish ISpanish II Spanish IIISpanish IV French IFrench II French IIIAP French German IGerman II German IIIAP German

86
HS Visual Arts Offerings Experiential Courses Experiential Courses Foundations of Arts & Communication ( 1/2 credit) Foundations of Arts & Communication ( 1/2 credit) Art I ( 1/2 credit) & Art II ( 1/2 credit) Art I ( 1/2 credit) & Art II ( 1/2 credit) Art History ( 1/2 credit) Art History ( 1/2 credit) *Eliminated Art III (sem) and Art History II (sem) *Eliminated Art III (sem) and Art History II (sem) More Specialized Courses Enriched Art I (1 credit)Ceramics I ( 1/2 credit) Enriched Art II (1 credit)Ceramics II ( 1/2 credit) Enriched Art III (1 credit)Ceramics III ( 1/2 credit) AP Studio Art (1 credit)Ceramics IV ( 1/2 credit)
 Foundations of Arts & Communication ( 1/2 credit) Art I ( 1/2 credit) & Art II ( 1/2 credit) Art I ( 1/2 credit) & Art II ( 1/2 credit) Art History ( 1/2 credit) Art History ( 1/2 credit) *Eliminated Art III (sem) and Art History II (sem) *Eliminated Art III (sem) and Art History II (sem) More Specialized Courses Enriched Art I (1 credit)Ceramics I ( 1/2 credit) Enriched Art II (1 credit)Ceramics II ( 1/2 credit) Enriched Art III (1 credit)Ceramics III ( 1/2 credit) AP Studio Art (1 credit)Ceramics IV ( 1/2 credit)")
87
OPPORTUNITIES PROVIDED FOR STAFF AND STUDENTS TO FOCUS ON ACADEMIC GROWTH

88
TEAM COLLABORATION THROUGH FOCUS GROUPS Intersession Team Academic Assist Team Communication Team Senior Year Team Intervention And Enrichment Teams Curriculum Team Athletic Study Tables Team Data Team Transition Team Professional Learning Communities

Similar presentations


 PROGRAM PARENT ADVISORY COMMITTEE Transitioning to High School.>")


