Download presentation
Presentation is loading. Please wait.

1
Migratory Connectivity: Science and Technology for Policy and Conservation Peter P. Marra Smithsonian Migratory Bird Center

2
Migratory Connectivity: The geographic linking of individuals or populations between different stages of the annual cycle, including between breeding, migration, and winter stages.

3
Hypothetical Species species range breeding wintering

4
Weak Connectivity Birds from one breeding population disperse throughout wintering range, and vice versa. Hypothetical Species Population Connections

5
Strong Connectivity One-to-one connections between summer and winter populations Hypothetical Species Population Connections

6
For most species, we dont know the we dont know the strength of migratory connectivity Hypothetical Species

7
J F M A M J J A S O N D breeding wintering migration molt Periods of the annual cycle are inextricably linked

8
Why Study Migratory Connectivity? Conservation Population Vulnerability

10
Why Study Migratory Connectivity? Population Abundance Ecology, Behavior, Evolution Demography, Mating Systems Life History Strategies Human Health Spread of Invasive Disease (HPAI,WNV) Conservation Population Vulnerability
 Conservation Population Vulnerability.")
11
Why Study Migratory Connectivity? Population Abundance Conservation Population Vulnerability

12
Seasonal Interactions Events in one period of the annual cycle influence events in subsequent periods. 2. Individual-level (carry-over effects) 1. Population-level (density effects)
 1. Population-level (density effects).")
13
(Sutherland 1996) Seasonal Interaction Model: Population-level Total Population Size Per Capita Rate E Winter Mortality Net Breeding Output
 Seasonal Interaction Model: Population-level Total Population Size Per Capita Rate E Winter Mortality Net Breeding Output")
14
(Sutherland 1996) Seasonal Interaction Model: Population-level Total Population Size Per Capita Rate E Winter Mortality Net Breeding Output E1E1
 Seasonal Interaction Model: Population-level Total Population Size Per Capita Rate E Winter Mortality Net Breeding Output E1E1")
15
(Sutherland 1996) Seasonal Interaction Model Population-level Population change depends on the relative strengths of density dependence between winter and summer. The consequences of habitat loss is greatest for the season in which there is the strongest density-dependence. For Oystercatchers, winter was the most limiting season. Total Population Size Per Capita Rate E Winter Mortality Net Breeding Output E1E1 E2E2

16
Few examples of population-level seasonal interactions exist. Weak understanding of migratory connectivity Few estimates of DD from non-breeding season Little research during the non-breeding season

17
Individual-level: Carry-over effects

18
Study Design 2002 - 2006 Font Hill Nature Reserve American redstart 3 mangrove, 3 scrub sites Range in size 1 - 5 ha

19
Performance is driven by habitat occupancy Black mangrove Second-growth scrub Physical condition Spring departure date Annual Survival maintain early high decline late low

20
Hypothesis: Environmental conditions on wintering grounds influence reproductive success via carry-over effects

21
Arrival dynamics Winter habitat (wet / dry) Breeding territory quality Fecundity Hypothesis: Environmental conditions on wintering grounds influence reproductive success via carry-over effects
 Breeding territory quality Fecundity Hypothesis: Environmental conditions on wintering grounds influence reproductive success via carry-over effects")
22
Moisture Gradient WETDRY C3C3 C4C4 Enriched 13 CDepleted 13 C

23
Wet Lowland Forest Black Mangrove Forest Second- growth Forest 13 C (mean +/- se) Carbon Isotope Signatures from American Redstart N = 5 N = 10 N = 34 N = 8 N = 24 -25.0 -24.5 -24.0 -23.5 -23.0 - 22.5 -22.0 -21.5 -21.0 Jamaica Honduras
 Carbon Isotope Signatures from American Redstart N = 5 N = 10 N = 34 N = 8 N = Jamaica Honduras")
24
Prediction: 1. have lower levels of 13 C relative to redstarts arriving later. American redstarts arriving early will 2. be in better physical condition than those arriving later.

26
13 C and arrival date in ASY males R 2 = 0.38, p < 0.0001 n=35 R 2 = 0.34, p = 0.0004 n = 32 20012002 0 5 10 15 20 25 Arrival date -24-23.5-23-22.5-22-21.5-21 13 C 5 10 15 20 25 Arrival date -24-23.5-23-22.5-22-21.5 13 C

27
Arrival Date (May) Mass Corrected for Body Size Physical Condition vs. Arrival Date P = 0.02 r = -0.52 -2.5 -2 -1.5 -0.5 0 0.5 1 1.5 2 2.5 12141618202224262830

28
Predicted changes in number of young fledged

29
Summary Winter habitat occupancy drives patterns of reproductive success on the breeding grounds Our other work suggests: 1) Winter conditions drive mortality during migration 2) Winter habitat drives natal dispersal 3) Reproductive costs influence feather color and quality
 Winter conditions drive mortality during migration 2) Winter habitat drives natal dispersal 3) Reproductive costs influence feather color and quality")
30
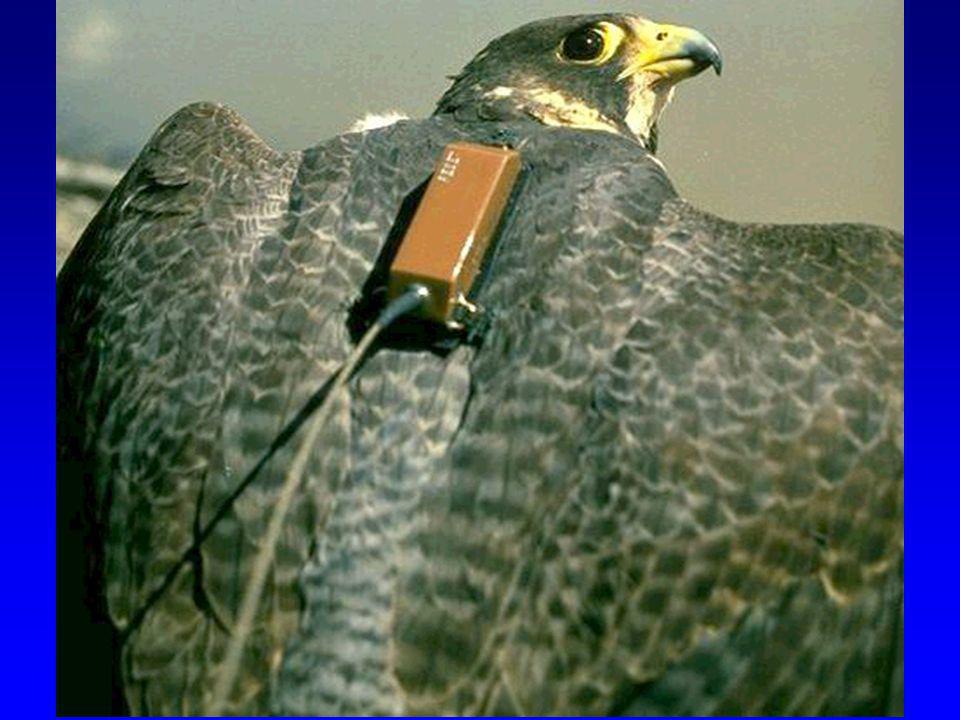
Where are we in tracking wide-ranging animals? Transmitters (radio & satellite ) Isotopes (individual & population) 1. Intrinsic Banding (capture-recapture) 2. Extrinsic Microbes and Parasites Molecular Markers Trace elements
 Isotopes (individual & population) 1. Intrinsic Banding (capture-recapture) 2. Extrinsic Microbes and Parasites Molecular Markers Trace elements.")
31
Band Recovery Data - Purple Martins

32
Atlantic Ocean NJ DE PA NY MD Atlantic City Philadelphia Trenton 100 km Delaware Bay 5 1 3 1 3 1 4 (10) 3 3 4 6 7 9 2 3 6 7 (10) 4 3 4 5 4 12 3
 (10)")
33
www.IcarusInitiative.org

34
International Space Station

35
Birds in Space

38
Copyright ©2006 by the National Academy of Sciences Shaffer, Scott A. et al. (2006) PNAS 103, 12799-12802 Sooty Shearwater Migrations
 PNAS 103, Sooty Shearwater Migrations.")
39
Isotopes

40
Stable-hydrogen isotopes vary with latitude Feathers sampled in the nonbreeding period reflect origins in the previous summer -45 -95 -75 -55 -50 -125 -115 -165 -135

41
H isotopes and banding data American redstart Setophaga ruticilla

42
Summary We still have no clear solution for measuring connectivity …..but we are getting there The best approach will probably be to integrate multiple markers

43
Conclusions Seasonal interactions and carry- over effects influence the ecology and evolution of species Investment in technological research is critical Understanding migratory connectivity is critical for conservation International cooperation through treaties

Similar presentations


>")


