Download presentation
Presentation is loading. Please wait.

1
Transitioning to the Smarter Balanced Assessment System North Carolina Superintendent Association Susan Gendron Senior Fellow International Center June 17 2012

2
Key to Effective Instruction Is Alignment Organizational Leadership Instructional Leadership Teaching

3
Organizational Leadership Instructional Leadership Student Achievement

4
What will our students need to: Know Do 4

5
PISA 2009 1 Shanghai-China556 2 Korea539 3 Finland536 4 Hong Kong-China533 5 Singapore526 6 Canada524 7 New Zealand521 8 Japan520 9 Australia515 10 Netherlands508 17 United States500 20 Germany497 21 Ireland496 22 France496 25 United Kingdom494 33 Spain481 43 Russian Federation459 48 Mexico425 53 Brazil412 57 Indonesia402 Overall Reading Scale Significantly Above OECD Average Not Significantly Different (OECD Average 493) Significantly below OECD Average
 Significantly below OECD Average")
6
PISA 2009 Overall Math Scale Significantly Above OECD Average Not Significantly Different (OECD Average 496) Significantly below OECD Average 1 Shanghai-China600 2 Singapore562 3 Hong Kong-China555 4 Korea546 6 Finland541 9 Japan529 10 Canada527 11 Netherlands526 13 New Zealand519 15 Australia514 16 Germany513 22 France497 28 United Kingdom492 31 United States487 32 Ireland487 34 Spain483 38 Russian Federation468 51 Mexico419 57 Brazil386 61 Indonesia371
 Significantly below OECD Average 1 Shanghai-China600 2 Singapore562 3 Hong Kong-China555 4 Korea546 6 Finland541 9 Japan Canada Netherlands New Zealand Australia Germany France United Kingdom United States Ireland Spain Russian Federation Mexico Brazil Indonesia371")
7
PISA 2009 Overall Science Scale Significantly Above OECD Average Not Significantly Different (OECD Average 501) Significantly below OECD Average 1 Shanghai-China575 2 Finland554 3 Hong Kong-China549 4 Singapore542 5 Japan539 6 Korea538 7 New Zealand532 8 Canada529 10 Australia527 11 Netherlands522 13 Germany520 16 United Kingdom514 20 Ireland508 23 United States502 27 France498 36 Spain488 39 Russian Federation478 50 Mexico416 53 Brazil405 60 Indonesia383
 Significantly below OECD Average 1 Shanghai-China575 2 Finland554 3 Hong Kong-China549 4 Singapore542 5 Japan539 6 Korea538 7 New Zealand532 8 Canada Australia Netherlands Germany United Kingdom Ireland United States France Spain Russian Federation Mexico Brazil Indonesia383")
8
Reading Risk Mapping State Proficiency Standards onto NAEP Scales, IES August 2011 NC

9
Proficiency Grade 4 Reading 2009 Proficiency Grade 4 Reading 2009 Proficient Required NAEP Score North Carolina 69 %204 Massachusetts 54 %234 Missouri 47 %229 New Hampshire 74%211 Oregon 84 %177 Washington 73 %205 Vermont 70%214

10
Reading Risk Mapping State Proficiency Standards onto NAEP Scales, IES August 2011 NC

11
Proficiency Grade 8 Reading 2009 Proficiency Grade 8 Reading 2009 Proficient Required NAEP Score North Carolina 66%246 Minnesota 67%259 Missouri 50%267 Vermont 69%259 Oregon 69%250 Washington 68%253

12
Math Risk Mapping State Proficiency Standards onto NAEP Scales, IES August 2011 NC

13
Proficiency Grade 4 Mathematics 2009 Proficiency Grade 4 Mathematics 2009 Proficient Required NAEP Score North Carolina 81 %220 Massachusetts 48 %255 Hawaii 50 %239 New Hampshire 73 %237 New Mexico 77 %224 Washington 52 %243 Missouri 45 %246

14
Math Risk Mapping State Proficiency Standards onto NAEP Scales, IES August 2011 NC

15
Proficiency Grade 8 Mathematics 2009 Proficiency Grade 8 Mathematics 2009 Proficient Required NAEP Score North Carolina 80 %253 Massachusetts 49 %300 Missouri 47 %287 Hawaii 39 % 286 Minnesota 58 %287 Oregon 71 %266 Washington 51 %288

16
Elbow partner What are your risks? How will you prepare your school for a potential dip in scores? Do you have a communication strategy and a clear vision for the future? 16

17
Organizational Leadership Student Achievement

18
Culture Organizational Leadership

19
Levin and Elmore Everyone needs to collaborate to ensure that daily teaching and learning practices are the focus of the school All responsible for success Principals and teachers are fundamentally evaluators Leaders responsible for cultural changes – by displacing specific norms, structures, and processes by others

20
How will you create a culture in your schools of ALL students “college and career ready”? 20

21
Rigor and Relevance Teaching

22
Rigor/Relevance For All Students 22 AB DC

23
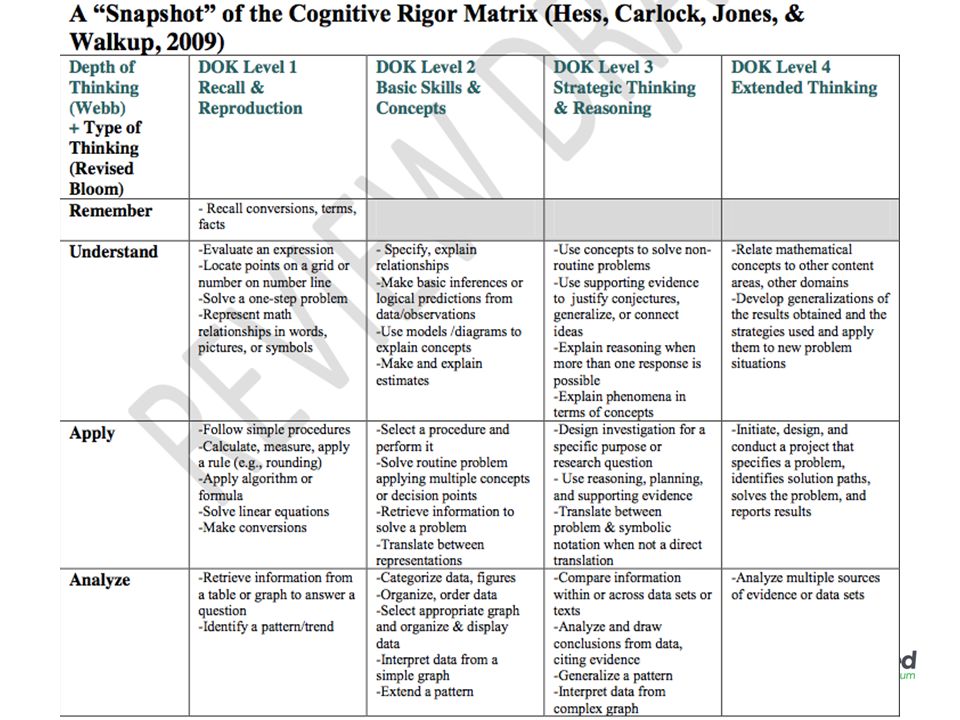
1.Awareness 2.Comprehension 3.Application 4.Analysis 5.Synthesis 6.Evaluation Knowledge Taxonomy Knowledge Taxonomy 23

24
Application Model 1. Knowledge in one discipline 2. Application within one discipline 3. Application across disciplines 4. Application to real-world predictable situations 5. Application to real-world unpredictable situations 24

25
25

26
Curriculum-Instruction-Assessment Connections

27
Observation Interpretation Cognition “Assessment Triangle” Evidence-Based Design Framework

28
Models of Cognition Describe how students acquire knowledge and develop competence in a particular area Reflect recent and credible scientific evidence of typical learning processes and informed experiences of expert teachers Describe typical learning progression toward competence, including milestones (benchmarks)
")
31
31

32
Observation Models A set of specifications for assessment tasks that will elicit illuminating responses from students The tasks or situations are linked to the cognitive model of learning and should prompt students to say, do, or create something that provides evidence to support inferences about students’ knowledge, skills, and cognitive processes

33
Interpretation Interpretations use the evidence from observations to make claims about what students understand and can do Claims – Frame a manageable number of learning goals around which instruction can be organized – Guide the specification of appropriate evidence – Provides a basis for meaningful reporting to different interested audiences

34
An Overview of SBAC’s Approach Content Specifications … –Create a bridge between standards and assessment and, ultimately, instruction –Organize the standards around major constructs & big ideas –Express what students should learn and be able to do

35
Each claim is described for assessment Rationale for each claim – Why is this learning goal important for College & Career Readiness (CCR)? – What does the research say about learning in this area? What does ‘sufficient’ evidence look like? – What types of items/tasks? – What content/texts will be emphasized? What are some suggested reporting categories?

36
Summative Assessment Targets Indicate proposed prioritized content for the summative assessment- link CCSS to the kinds of items/tasks students will respond to Show how one or more (or parts) CCSS addresses the target – ‘bundles’ CCSS (examples on next slide) – Standards or parts of standards that relate to same type of understanding & comparable rigor/DOK demands – Several similar CCSS from different strands
 CCSS addresses the target – ‘bundles’ CCSS (examples on next slide) – Standards or parts of standards that relate to same type of understanding & comparable rigor/DOK demands – Several similar CCSS from different strands")
37
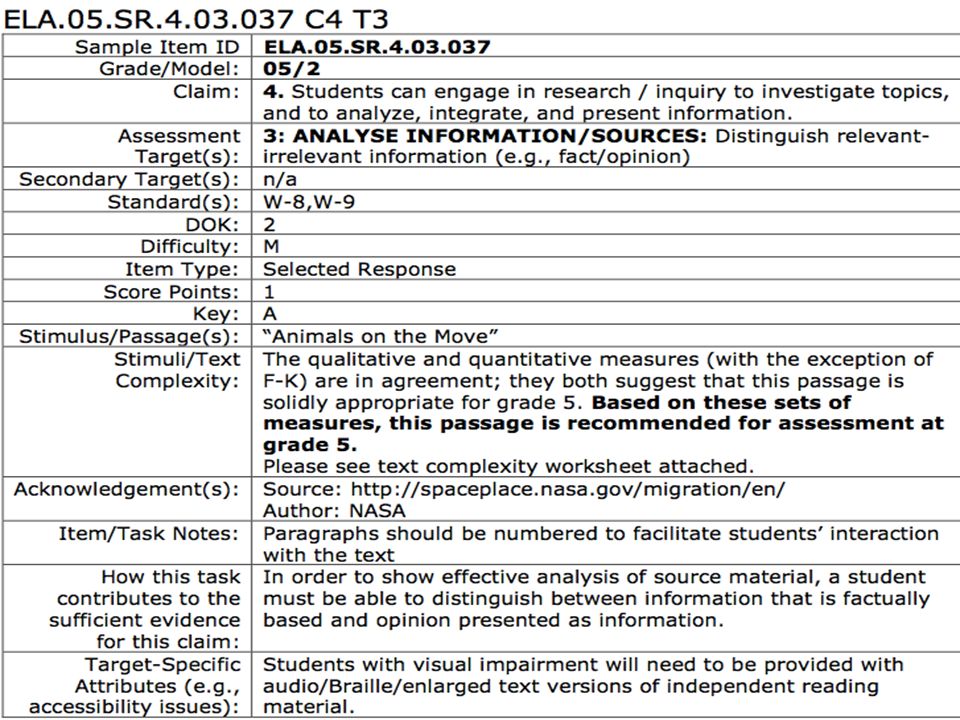
Assessment Claims for English Language Arts/Literacy Students can read closely and analytically to comprehend a range of increasingly complex literary and informational texts. Reading Students can produce effective and well- grounded writing for a range of purposes and audiences. Writing Students can employ effective speaking and listening skills for a range of purposes and audiences. Speaking/Listening Students can engage in research and inquiry to investigate topics, and to analyze, integrate, and present information. Research/Inquiry (a/o Round 2 – released 9/20/11)
.")
38
Draft Overall Assessment Claims for English Language Arts/Literacy OVERALL 3-8 OVERALL 9-12 (a/o Round 2 – released 9/20/11) Students can demonstrate progress toward college and career readiness in English language arts and literacy. Students can demonstrate college and career readiness in English language arts and literacy.

39
English Language Arts and Literacy Standards “Roadmap” READING WRITING SPEAKING & LISTENING LANGUAGE 10 Anchor Standards for College and Career Readiness 10 Anchor Standards for College and Career Readiness 6 Anchor Standards for CCR ELA Standards K-12 Literacy Standards 6-12 ELA Standards K-12 Literacy Standards 6-12 Literary Text Hist. / S.S. Sci. / Tech Subj. Inform Text 1 K 2 3 4 5 6 7 8 9-10 11-12 9-10 11-12 6-8 9-10 11-12 6-8 11-12 1 K 2 3 4 5 6 7 8 9-10 11-12 6-8 1 K 2 3 4 5 6 7 8 9-10 11-12 1 K 2 3 4 5 6 7 8 9-10 11-12 K 1 2 3 4 5 9-10 11-12 6 7 8 Found- ational Skills 1 2 3 4 5 K → → → → → → → → → → → → → →

40
40 English Language Arts and Literary Shifts engageny

41
Smarter Balanced Assessment Consortium

42
The Assessment Challenge How do we get from here......to here? All students leave high school college and career ready Common Core State Standards specify K-12 expectations for college and career readiness...and what can an assessment system do to help?

43
Next Generation Assessments More rigorous tests measuring student progress toward “college and career readiness” Have common, comparable scores across member states, and across consortia Provide achievement and growth information to help make better educational decisions and professional development opportunities Assess all students, except those with “significant cognitive disabilities” Administer online, with timely results Use multiple measures Source: Federal Register / Vol. 75, No. 68 / Friday, April 9, 2010 pp. 18171-85

44
Smarter Balanced Background

45
A National Consortium of States 28 states representing 44% of K-12 students 21 governing, 7 advisory states Washington state is fiscal agent

46
Smarter Balanced Approach

47
Seven Key Principles 1.An integrated system 2.Evidence-based approach 3.Teacher involvement 4.State-led with transparent governance 5.Focus: improving teaching and learning 6.Actionable information – multiple measures 7.Established professional standards

48
A Balanced Assessment System Common Core State Standards specify K-12 expectations for college and career readiness Common Core State Standards specify K-12 expectations for college and career readiness All students leave high school college and career ready Teachers and schools have information and tools they need to improve teaching and learning Interim assessments Flexible, open, used for actionable feedback Summative assessments Benchmarked to college and career readiness Teacher resources for formative assessment practices to improve instruction

49
A Balanced Assessment System School Year Last 12 weeks of the year* DIGITAL CLEARINGHOUSE of formative tools, processes and exemplars; released items and tasks; model curriculum units; educator training; professional development tools and resources; scorer training modules; and teacher collaboration tools. English Language Arts and Mathematics, Grades 3-8 and High School Computer Adaptive Assessment and Performance Tasks Computer Adaptive Assessment and Performance Tasks Scope, sequence, number and timing of interim assessments locally determined *Time windows may be adjusted based on results from the research agenda and final implementation decisions. Summative Performance Tasks For Accountability Reading Writing Math Re-take option Summative End Of Year Adaptive Assessment for Accountability Optional Interim Assessment Optional Interim Assessment

50
Using Computer Adaptive Technology for Summative and Interim Assessments Turnaround in weeks compared to months today Faster results Fewer questions compared to fixed form tests Shorter test length Provides accurate measurements of student growth over time Increased precision Item difficulty based on student responses Tailored to student ability Larger item banks mean that not all students receive the same questions Greater security GMAT, GRE, COMPASS (ACT), Measures of Academic Progress (MAP) Mature technology
, Measures of Academic Progress (MAP) Mature technology")
51
Technology Identify Tech Needs Design the Technology System Build the Systems Pilot and Field Test IT readiness survey: Available January 2012 System architecture: Available January 2012 Vendors start building the system: February 2012 Vendors start building the system: February 2012 Improve the technology throughout pilot and field test: 2012 and 2013

52
Technology New Purchases (as of April 2012) – Hardware – 1GHz processor, 1 GB RAM, 9.5 inch screen size (10 inch class), screen resolution of 1024 x 768 Must have tools to temporarily disable features ( i.e.. web browser, Bluetooth connections, application switching) – Operating Systems – Windows 7, Mac 10.7, Linux (Ubuntu 11.10, Fedora 16), Chrome, iOS, Android 4.0 Will consider older versions and Linux after survey data and cognitive labs – Network – Must be able to connect to the Internet
 – Operating Systems – Windows 7, Mac 10.7, Linux (Ubuntu 11.10, Fedora 16), Chrome, iOS, Android 4.0 Will consider older versions and Linux after survey data and cognitive labs – Network – Must be able to connect to the Internet.")
53
Technology New Purchases (as of April 2012) – Form Factors –Desktops, laptops, netbooks, thin- client, and tablets ) iPad, Windows and Android) that meet the above specifications – Additional Accessories – Headphones may be required for audio support Physical keyboards (as opposed to virtual) and/or mice may be required for use with tablets
 – Form Factors –Desktops, laptops, netbooks, thin- client, and tablets ) iPad, Windows and Android) that meet the above specifications – Additional Accessories – Headphones may be required for audio support Physical keyboards (as opposed to virtual) and/or mice may be required for use with tablets")
54
Technology Anticipate by 2016-17 up to 25% of the mathematics assessment will comprise items/tasks requiring student-produced illustrations or calculations. Students will need access to tablet (or other device) that employs a stylus for user input Future required use will be described in the August 2012 guidelines
 that employs a stylus for user input Future required use will be described in the August 2012 guidelines.")
56
Technology Plan What is your vision? Designing an infrastructure – CoSN, SETDA, Horizon report, Maine Learning Technology Initiative Define the type of learning you want for your students. Professional Development – Teachers, Principals, Technology Coordinators

57
57

58
2012 Horizon Time to Adoption One Year or Less: –Mobiles and Apps –Tablet Computing 58

59
2012 Horizon Time to Adoption Two to Three Years: –Game-Based Learning –Personal Learning Environments Horizon Report 2012 44

60
Personal Learning Environments Horizon Report 2012

61
2012 Horizon Time to Adoption Four to Five Years: –Augmented Reality –Natural User Interfaces 61 Horizon Report 2012

62
Key Trends (Horizon Report 2012) Abundance of resources Cost of technology dropping, More common for students to bring their own device Schools including online learning, hybrid learning and collaborative models 62
 Abundance of resources Cost of technology dropping, More common for students to bring their own device Schools including online learning, hybrid learning and collaborative models 62")
63
Key Trends (Horizon Report 2012) One to one computing spreading across the world and US People expect to work, learn, and study whenever Technology profoundly affects the way we work, collaborate, communicate and succeed New emphasis on challenged-based and active learning 63
 One to one computing spreading across the world and US People expect to work, learn, and study whenever Technology profoundly affects the way we work, collaborate, communicate and succeed New emphasis on challenged-based and active learning 63")
64
Challenges (Horizon Report 2012) Demand for personal learning is not supported by current technology Lack of digital media literacy for teachers Economic pressures – new models of education – unprecedented competition Institutional barriers Blending of formal and informal learning 64
 Demand for personal learning is not supported by current technology Lack of digital media literacy for teachers Economic pressures – new models of education – unprecedented competition Institutional barriers Blending of formal and informal learning 64")
65
Challenges (Horizon Report 2012) Learning that incorporates real life learning – is undervalued Many activities related to learning take place outside the walls of classrooms Putting 21 st century technology into 19 th century schools is a major undertaking We don’t use digital media for formative assessment 65
 Learning that incorporates real life learning – is undervalued Many activities related to learning take place outside the walls of classrooms Putting 21 st century technology into 19 th century schools is a major undertaking We don’t use digital media for formative assessment 65")
66
What is on your Horizon? Download the NMC 2012 Horizon Report www.CoSN.org/Horizon 66

67
Assessment System Components Summative Assessment (Computer Adaptive) Assesses the full range of Common Core in English language arts and mathematics for students in grades 3–8 and 11 (interim assessments can be used in grades 9 and 10) Measures current student achievement and growth across time, showing progress toward college and career readiness Can be given once or twice a year (mandatory testing window within the last 12 weeks of the instructional year) Includes a variety of question types: selected response, short constructed response, extended constructed response, technology enhanced, and performance tasks
 Assesses the full range of Common Core in English language arts and mathematics for students in grades 3–8 and 11 (interim assessments can be used in grades 9 and 10) Measures current student achievement and growth across time, showing progress toward college and career readiness Can be given once or twice a year (mandatory testing window within the last 12 weeks of the instructional year) Includes a variety of question types: selected response, short constructed response, extended constructed response, technology enhanced, and performance tasks")
68
Assessment System Components Interim Assessment (Computer Adaptive) Optional comprehensive and content-cluster assessment to help identify specific needs of each student Can be administered throughout the year Provides clear examples of expected performance on Common Core standards Includes a variety of question types: selected response, short constructed response, extended constructed response, technology enhanced, and performance tasks Aligned to and reported on the same scale as the summative assessments Fully accessible for instruction and professional development
 Optional comprehensive and content-cluster assessment to help identify specific needs of each student Can be administered throughout the year Provides clear examples of expected performance on Common Core standards Includes a variety of question types: selected response, short constructed response, extended constructed response, technology enhanced, and performance tasks Aligned to and reported on the same scale as the summative assessments Fully accessible for instruction and professional development")
69
Assessment System Components Extended projects demonstrate real- world writing and analytical skills May include online research, group projects, presentations Require 1-2 class periods to complete Included in both interim and summative assessments Applicable in all grades being assessed Evaluated by teachers using consistent scoring rubrics The use of performance measures has been found to increase the intellectual challenge in classrooms and to support higher-quality teaching. - Linda Darling-Hammond and Frank Adamson, Stanford University “ ” Performance Tasks

70
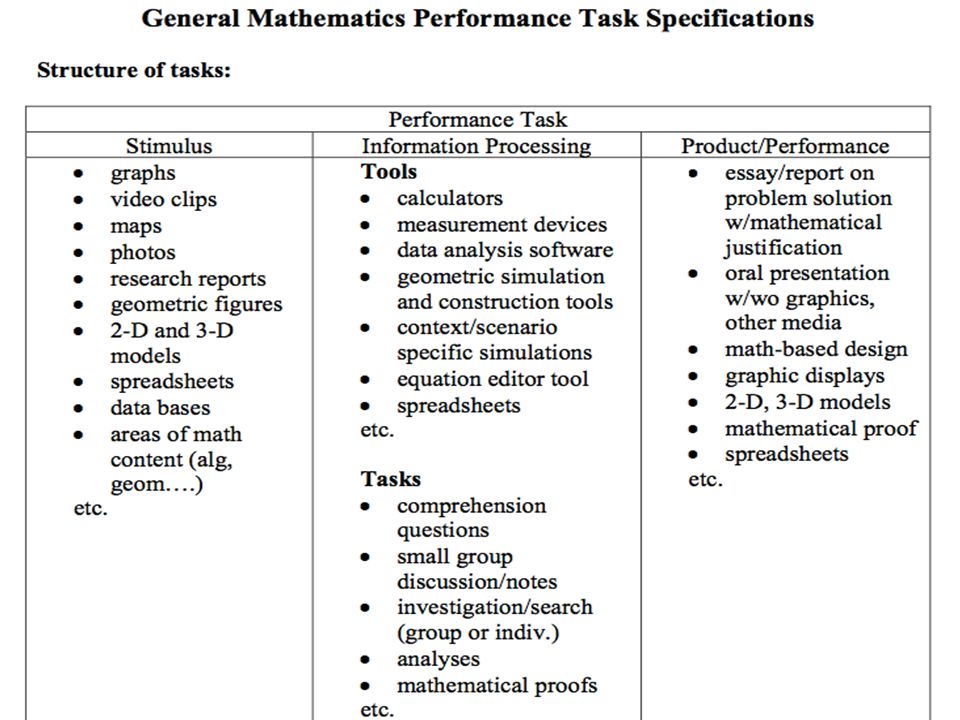
Performance Task Guidelines Integrate knowledge and skills across multiple standards or strands Measure capacities such as depth of understanding, research skills, complex analysis, and identification/providing of relevant evidence Require student-initiated planning, management of information and ideas, interaction with other materials 70

71
Performance Task Guidelines Require production of more extended responses (e.g., oral presentations, exhibitions, product development, in addition to more extended written responses which might be revised and edited Reflect a real-world task and/or scenario-based Allow for multiple approaches Represent content that is relevant and meaningful to students 71

72
Performance Task Guidelines Allow for multiple points of view and interpretations Require scoring that focuses on the essence of the task Be feasible for the school/classroom environment 72

73
Performance Task Guidelines Allow for demonstration of important knowledge & skills, including those that address 21st century skills such as critically analyzing, synthesizing media texts 73

80
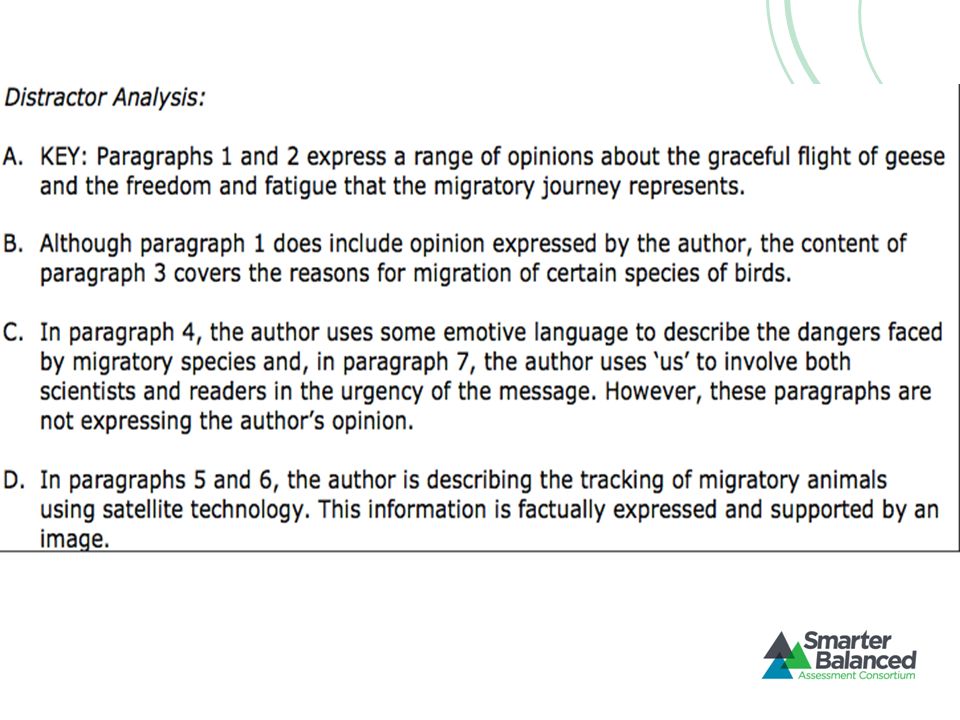
Grade 08 ELA Sample CR Item Assessment Target- 11. REASONING & EVALUATION: Apply reasoning and a range of textual evidence to justify inferences or interpret author’s presentation of information (author’s line of reasoning; point of view/purpose; relevance of evidence and/or elaboration to support claims, concepts, ideas) Standards: RI-6, RI-8, RST 6 DOK - 3
 Standards: RI-6, RI-8, RST 6 DOK - 3.")
85
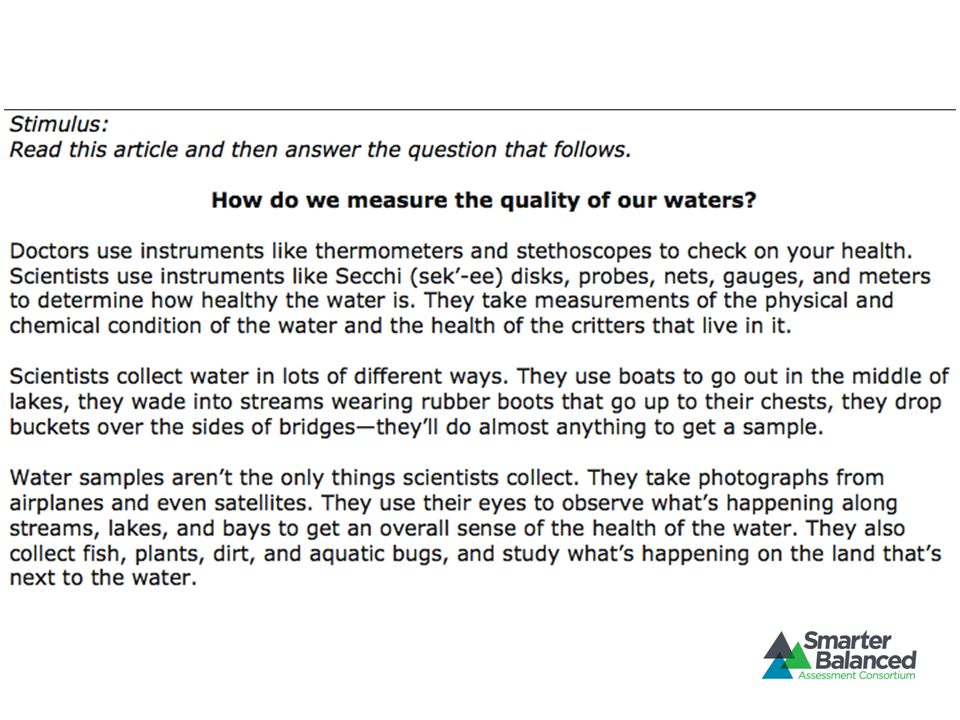
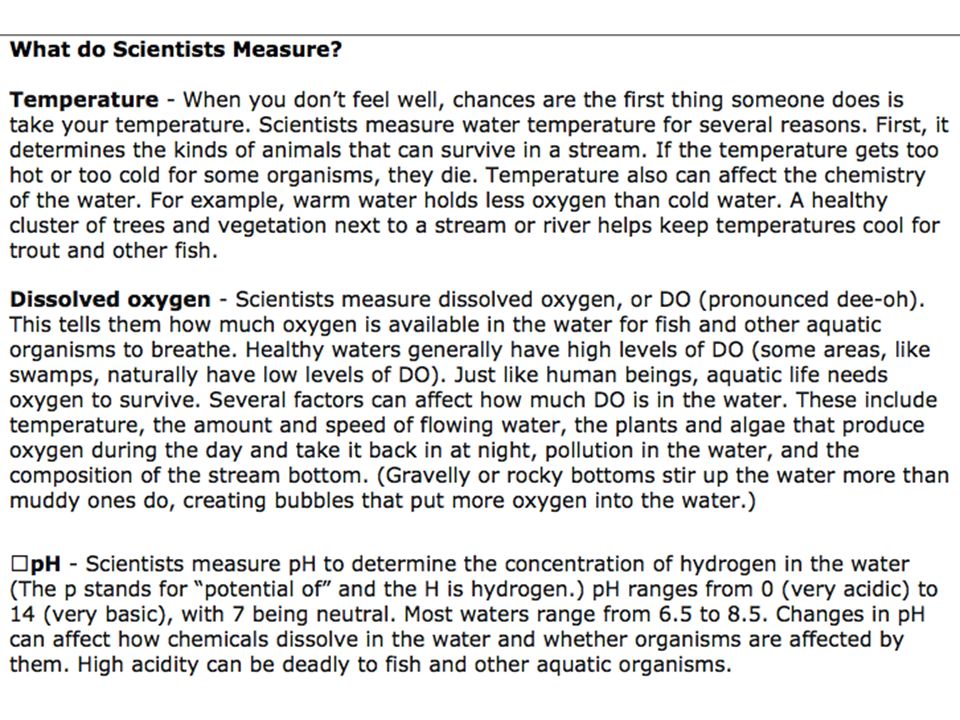
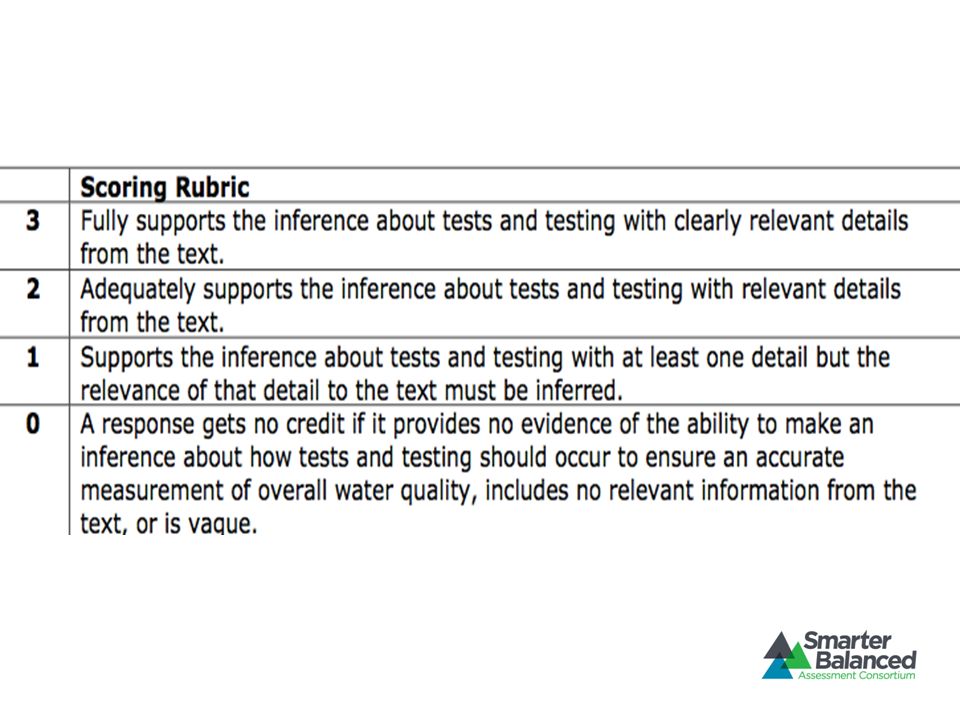
Item Prompt Based on the text, what inference can be made about how tests and testing should occur to ensure an accurate measurement of overall water quality? Explain your inference using details from the text.

100
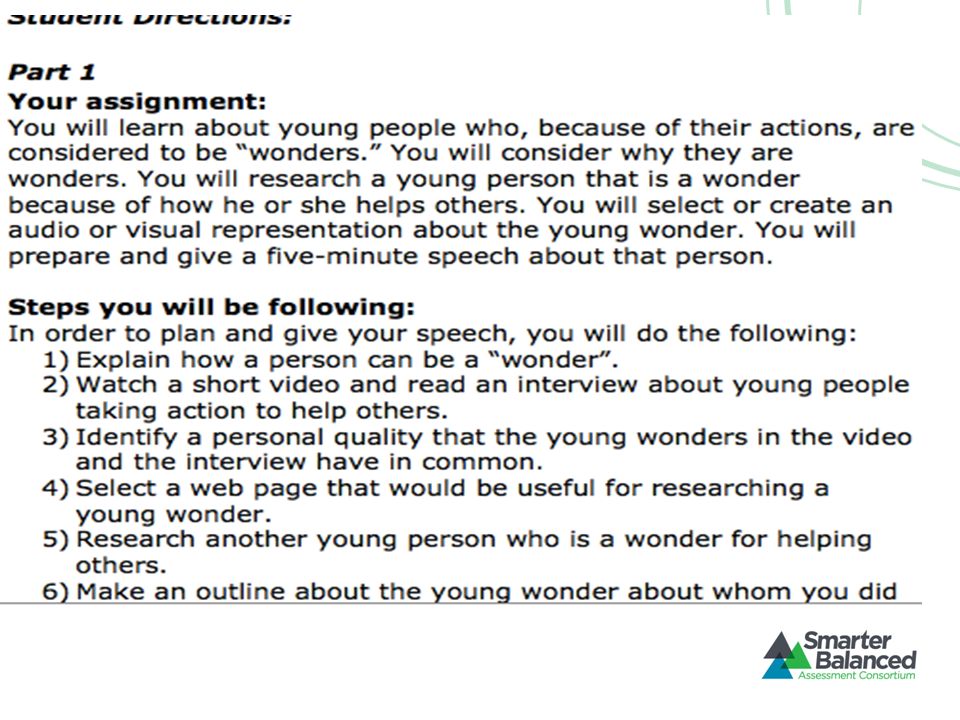
Questions to be answered in the speech In two sentences, use your own words to tell what a wonder is and explain how a person who helps others can be considered a wonder. Write 2 or 3 sentences identifying a personal quality that both Mickey and Ana display. Give an example from both the video and the interview to support your answer.

101
Questions to be answered in the speech Tell which website you think would be most useful for learning about another young person that is a wonder because he or she helps others. Cite the web site by giving the web address. Use details from the website to support your answer.

103
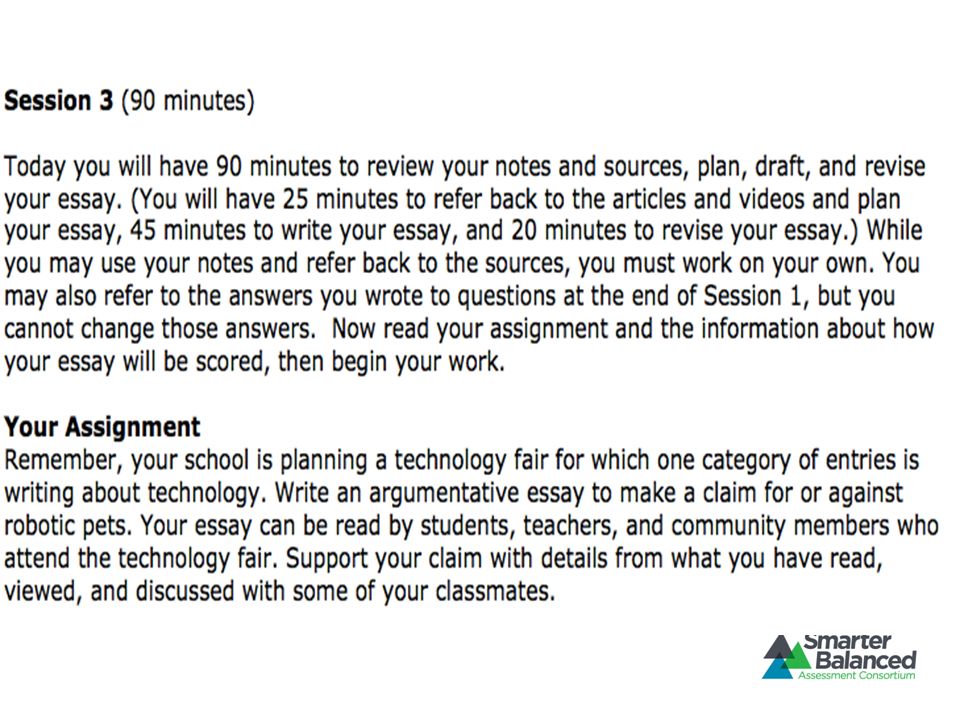
Performance Tasks Sources (2 articles, 3 videos) Article 1 Metro Daily News June, 2011 The Rise of the Robot Pet by Elena Soto Video 1: Fugitsu’s cute teddy-bear robot shows what it can do, May 2010. http://www.youtube.com/watch?v=AwWeN1ARy74 --This is an introduction to the Fujitsu robot teddy bear. (1:58) Video 2: Pleo: Robot, pet or both? December 2007 http://www.youtube.com/watch?v=F6LCEFr8SxQ --The host of a technology show provides an introduction to a specific robot pet. (3:10) Article 2 Technology Trends Quarterly Fall, 2010 Love In the Time of Robots by Frank Mullin Video 3: Maya’s Human Interaction – Sensors (A Genibo-QD film), February 2010. http:// www.youtube.com/watch?v=9b4jx5RzqAk --The Genibo robot dog displays some of its capabilities. (1:49)
 Video 2: Pleo: Robot, pet or both. December v=F6LCEFr8SxQ --The host of a technology show provides an introduction to a specific robot pet. (3:10) Article 2 Technology Trends Quarterly Fall, 2010 Love In the Time of Robots by Frank Mullin Video 3: Maya’s Human Interaction – Sensors (A Genibo-QD film), February v=9b4jx5RzqAk --The Genibo robot dog displays some of its capabilities. (1:49).")
107
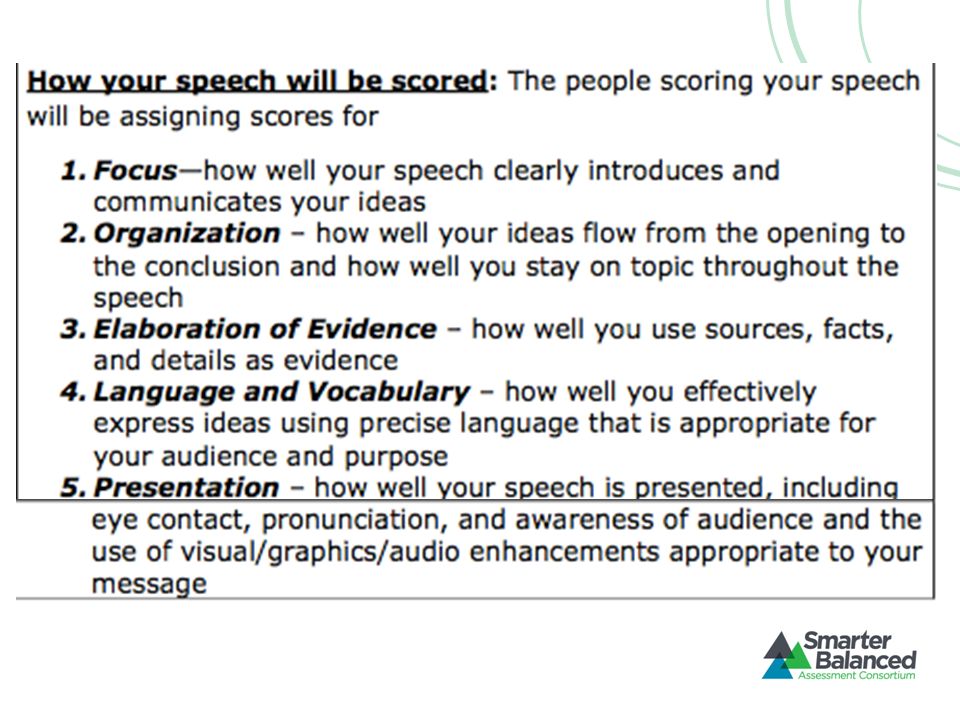
Scoring 1. Establishing a claim 2. Presentation of relevant evidence 3. Organization 4. Conventions 5. Language, tone, purpose, audience 6. Content

110
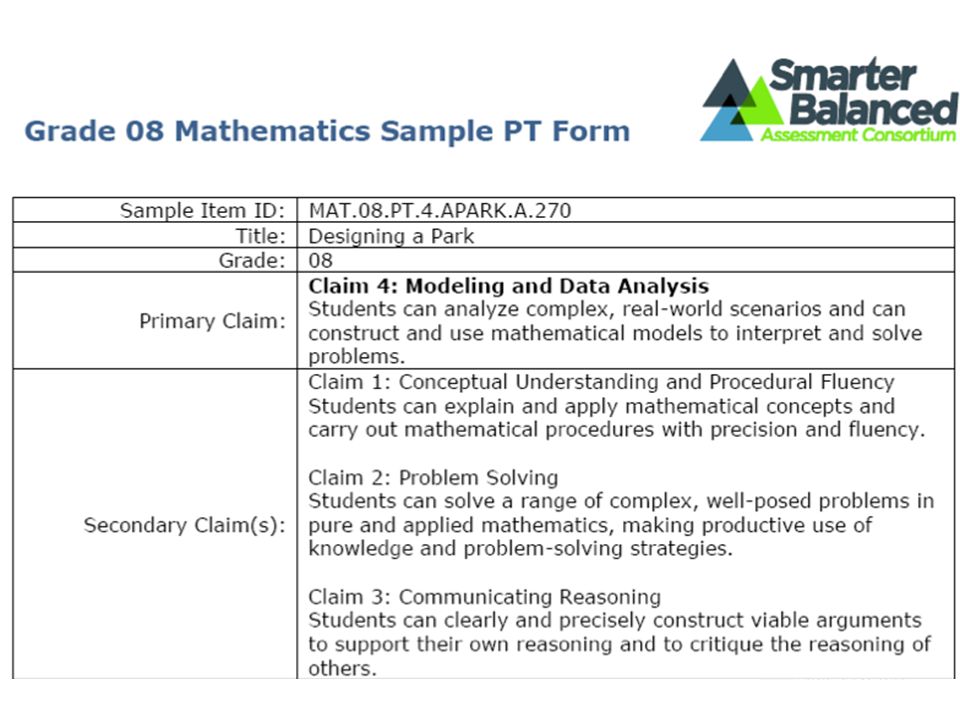
Draft Assessment Claims for Mathematics “Students can explain and apply mathematical concepts and interpret and carry out mathematical procedures with precision and fluency.” Concepts and Procedures “Students can solve a range of complex well-posed problems in pure and applied mathematics, making productive use of knowledge and problem solving strategies.” Problem Solving “Students can clearly and precisely construct viable arguments to support their own reasoning and to critique the reasoning of others.” Communicating Reasoning “Students can analyze complex, real-world scenarios and can construct and use mathematical models to interpret and solve problems.” Modeling and Data Analysis (a/o Round 2 – released 12/9/11)
")
114
A Schematic representation of CCSSM content

115
“Hurdles Race”

116
Think of the Content involved Interpreting distance-time graphs in a real-world context Realizing “to the left” is faster Understanding points of intersection in that context (they’re tied at the moment) Interpreting the horizontal line segment Putting all this together in an explanation
 Interpreting the horizontal line segment Putting all this together in an explanation")
117
Think of the Practices involved Make sense of problems and persevere in solving them. Reason abstractly and quantitatively. Construct viable arguments… Model with mathematics. Use appropriate tools strategically. Attend to Precision. Look for and make use of structure. Look for and express regularity in repeated reasoning.

118
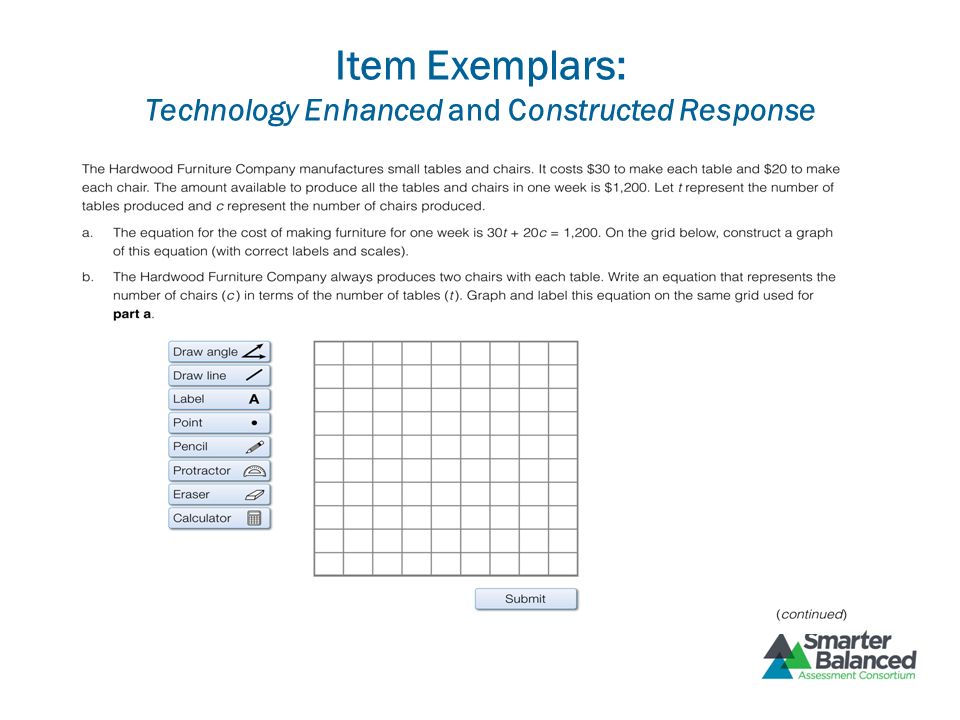
Item Exemplars: Technology Enhanced and Constructed Response

144
Few initiatives are backed by evidence that they raise achievement. Formative assessment is one of the few approaches proven to make a difference. - Stephanie Hirsh, Learning Forward Assessment System Components Formative Assessment Practices Research-based, on-demand tools and resources for teachers Aligned to Common Core, focused on increasing student learning and enabling differentiation of instruction Professional development materials include model units of instruction and publicly released assessment items, formative strategies “ ”

145
145 Definition: Assessment that takes place continuously during the course of teaching and learning to provide teachers and students with feedback to close the gap between current learning and desired goals. Assessment Reform Group, 2002; Bell & Cowie, 2001; Black et al., 2003; Black & Wiliam, 1998; OECD, 2005; Sadler, 1989; Shepard, 2000)
.")
146
Advantages of Formative Assessment Students learn faster Teachers know what students already know & adjust instruction Students aware of progress Most powerful moderator in student achievement Works for at risk students

147
Formative Assessment Strategies ( Black, Wiliam,1998; Sadler, 1998; Stiggins, 2007;Heritage, 2007) Pre-assessing students Sharing Learning goals with students Co-creating classroom discourse & questioning Rich & challenging tasks elicit student response Identifying gaps
 Pre-assessing students Sharing Learning goals with students Co-creating classroom discourse & questioning Rich & challenging tasks elicit student response Identifying gaps")
148
Formative Assessment Strategies (Black, Wiliam,1998; Sadler, 1998; Stiggins, 2007;Heritage, 2007) Providing feedback/how to improve Self-assessments Peer- assessments Opportunities to close the gap Celebrations
 Providing feedback/how to improve Self-assessments Peer- assessments Opportunities to close the gap Celebrations")
149
Feedback Student Work Feedback Student work Feedback Student Proficient Celebrate

150
Strategies Traffic Light feedback Gallery Walk Portfolio Concept Map Ticket out the door

151
What do students say Class discussion Debate Oral presentation story/event telling Agree/disagree Choral reading Think-Pair-Share You’re the Judge Ask a question Make a Statement Radio Show Small group talk Play/drama Reciting a poem/speech Panel discussion Music Interviews Think aloud Answer specific Podcasts Read aloud Other____

152
Take a Three Minute Pulse After 10-15 discussion, reading, lecture Reflect, discuss what they learned using higher order thinking skills Suggested questions: (Marzano) – How does this information relate to you? – How does what we’ve just learned relate to.. – How is what we just learned similar or different to – Identify one thing you knew and one thing that was new to you…

153
Exit Sheet I think I Got It This is what I learned: This is how your lesson helped: Still Need More Practice I’m still struggling with: My biggest question is: Tomorrow, Tomorrow Can I have help with: I could practice by: Teach Me More Mini-lesson idea: This would help me because:

154
One Minute Response What I learned today…What I am unclear/unsure aboutComments…

155
Grades Supported GradesSummativeInterim (Optional) Formative Tools and Professional Learning (Optional) ✔✔✔ 1-2 Performance Tasks as Required to Cover CCSS ✔ EOC and Comprehensive ✔ ✔✔ EOC and Comprehensive ✔ Optional ✔ EOC and Comprehensive ✔ 3 8 9 10 11 12
 Formative Tools and Professional Learning (Optional) ✔✔✔ 1-2 Performance Tasks as Required to Cover CCSS ✔ EOC and Comprehensive ✔ ✔✔ EOC and Comprehensive ✔ Optional ✔ EOC and Comprehensive ✔")
156
Data are only useful if people are able to access, understand and use them… For information to be useful, it must be timely, readily available, and easy to understand. -Data Quality Campaign Assessment System Components Online Reporting Static and dynamic reports, secure and public views Individual states retain jurisdiction over access and appearance of online reports Dashboard gives parents, students, practitioners, and policymakers access to assessment information Graphical display of learning progression status (interim assessment) Feedback and evaluation mechanism provides surveys, open feedback, and vetting of materials “ ”
 Feedback and evaluation mechanism provides surveys, open feedback, and vetting of materials .")
157
Support for Special Populations Accurate measures of progress for students with disabilities and English Language Learners Accessibility and Accommodations Work Group engaged throughout development Outreach and collaboration with relevant associations Common- Core Tests to Have Built-in Accommodations - June 8, 2011 “ ”

158
Timeline Formative Processes, Tools, and Practices Development Begins Writing and Review of Pilot Items/Tasks (including Cognitive Labs and Small-Scale Trials) Field Testing of Summative and Interim Items/Tasks Conducted Content and Item Specifications Development Pilot Testing of Summative and Interim Items/Tasks Conducted Preliminary Achievement Standards (Summative) Proposed and Other Policy Definitions Adopted Operational Summative Assessment Administered Procurement Plan Developed Writing and Review of Field Test Items/Tasks (throughout the school year) Writing and Review of Field Test Items/Tasks (throughout the school year) Final Achievement Standards (Summative) Verified and Adopted Common Core State Standards Adopted by All Member States Summative Master Work Plan Developed and Work Groups Launched
 Field Testing of Summative and Interim Items/Tasks Conducted Content and Item Specifications Development Pilot Testing of Summative and Interim Items/Tasks Conducted Preliminary Achievement Standards (Summative) Proposed and Other Policy Definitions Adopted Operational Summative Assessment Administered Procurement Plan Developed Writing and Review of Field Test Items/Tasks (throughout the school year) Writing and Review of Field Test Items/Tasks (throughout the school year) Final Achievement Standards (Summative) Verified and Adopted Common Core State Standards Adopted by All Member States Summative Master Work Plan Developed and Work Groups Launched")
159
Find Out More The Smarter Balanced Assessment Consortium can be found online at http://www.smarterbalanced.org

160
Solid Implementation Focus Fidelity of Implementation Leading and Lagging Indicators

161
Proportions of students scoring in each decile of the MCAS 8 th grade ELA distribution

162
Proportions of students scoring in each decile of the MCAS 8 th grade Math distribution

163
MCAS Math gains 8 th to 10 th grade, compared to others from the same 8 th grade decile (School Rank Percentile)
")
164
MCAS ELA gains 8 th to 10 th grade, compared to others from the same 8 th grade decile (School rank percentile/100)
")
165
Defining your Literacy Priorities Examine your student data What is your process for selecting text? Do you meet the expectations for Literary and Information text Do your teachers use text dependent questions? How will you achieve writing across the content areas, common process, rubrics Do your students produce one research project per quarter Do you need to address domain specific vocabulary Rigor/Relevance – Quadrant D

167
Mapping an implementation strategy Are your current math courses aligned? Review the domains, clusters and standards for your grade level or HS conceptual category What is different, where do you need to make shifts Identify 2-3 action areas

168
susangendron1@gmail.com 1587 Route 146 Rexford, NY 12148 Phone (518) 399-2776 Fax (518) 399-7607 E-mail - info@LeaderEd.com www.LeaderEd.com
 Fax (518)")
Similar presentations


 So what... › Implications and Impact in NH ›>")
 NGSS, CCSS ELA/Literacy, CCSS Mathematics, MMC K-12 Science Framework and NGSS Review in Terms of CCR 1.>")


