Download presentation
Presentation is loading. Please wait.

1
Motion in One Dimension

2
Velocity can be interpreted graphically The velocity of an object can be determined if the object’s position is known at specific times along its path. One way to determine this is to make a graph of the motion. pg41Physics Serway/Faugh (Holt)
.")
3
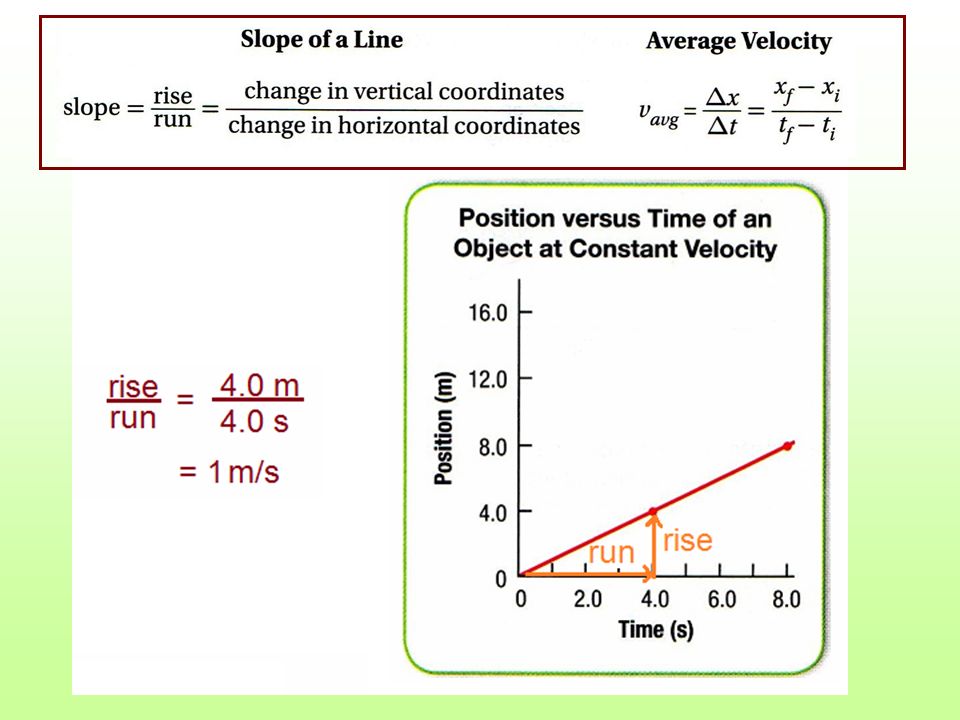
A Graph Showing Constant Velocity The Physics Classroom

4
Pg 41 The object moves 4.0 m in the time interval between t = 0 s and t = 4.0 s. The object moves an addi- tional 4.0 m in the time interval between t = 4.0 s and t = 8.0 s. From these data we see that the avg. velocity for these time intervals as 1m/s.

5
Because the average velocity does not change, the object is moving with a constant velocity of +1.0 m/s, and its motion is represented by a straight line on the position-time graph. Pg41 Physics Serway/Faugh (Holt)
.")
6
Slope of the line = Avg. Velocity For any position-time graph, we can also determine the average velocity by drawing a straight line between any two points on the graph and calculating the slope of that line. (Pg 41)
.")
7
Slope =Rise over the Run Just think of a step.

9
Position-Time graphs for 3 objects Object 1 - has a constant positive velocity because position increases uniformly with time. (Its slope is positive) Object 2 – has zero velocity because its position does not change. The object is at rest. (The slope of this line is zero.) Object 3 – has a constant negative velocity because its position decreases with time. It moves to the west. (The slope of this line is negative.) Pg41 Physics Serway/Faugh (Holt)
 Object 2 – has zero velocity because its position does not change. The object is at rest. (The slope of this line is zero.) Object 3 – has a constant negative velocity because its position decreases with time. It moves to the west. (The slope of this line is negative.) Pg41 Physics Serway/Faugh (Holt).")
10
A Graph Showing Changing Positive Velocity. The Physics Classroom

11
Comparison of Constant Velocity and Changing Positive Velocity

12
Instantaneous and Average Velocities may be different. If the position-time graph is curved, velocity increases with time. It is moving through large displacement with each interval (pg42)
.")
13
Between t = 0 s and t = 2.0 s the object moves 8.0 m and its average velocity for this time interval is 4.0 m/s. (v avg = 8.0m/2.0s) Between t = 0 s and t = 4.0 s the object moves 32 m and its average velocity for this time interval is 8.0 m/s. (v avg = 32m/4.0s) Different average velocities depending upon the time interval. Pg41 Physics Serway/Faugh (Holt)
 Between t = 0 s and t = 4.0 s the object moves 32 m and its average velocity for this time interval is 8.0 m/s. (v avg = 32m/4.0s) Different average velocities depending upon the time interval. Pg41 Physics Serway/Faugh (Holt).")
14
To Find Instantaneous velocity from the Position-Time graph Construct a straight line that is tangent to the position-versus- time graph at the point or instant in question. Calculate the slope of that line.

Similar presentations


 time(s) Describe the motion of the object represented by this graph This object is at rest 2m.>")


 is defined as the rate of change of velocity. It has units of m/s 2 Acceleration can be positive, negative, or zero. An.>")