Download presentation
Presentation is loading. Please wait.

1
REGIONAL / LOCAL WAVE MODELING María Paula Etala Naval Hydrographical Service Naval Meteorological Service Argentina

2
HIGH SEAS AND OFF-SHORE FORECASTS zona Fin del Mundo zona Patagonia Sur zona Golfo San Jorge zona Valdéz zona El Rincón zona Mar del Plata zona Río de la Plata zona Río Grande ZONA OCEANICA zona Islas Malvinas

3
Combination of manual methods for swell propagation

4
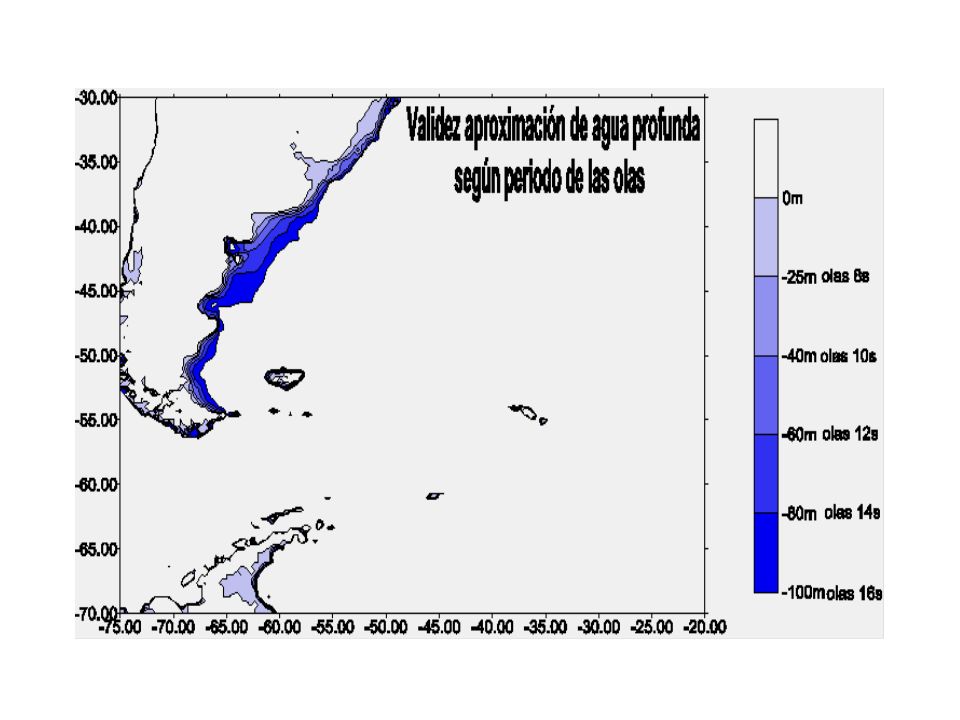
Simple facilities: swell propagation and decay

5
Building total sea at a point over time

7
Wave / Surge Model Operations H - data assimilation cycle H hincast periodforecast period restart from previous run H + forecast period Data assimilation cycle = analysed wind fields frequency analysed windsforecasted winds new restart

8
Nivel inferior de viento + especification 0 and 1 er order continuity Planetary Boundary Layer Surface Layer U (z) = A+ Bz Boundary Layer Wind Drag coefficient: u * 2 = C D ( U) 2 Iterative Method Z 0 h top CDCD u*u*
 = A+ Bz Boundary Layer Wind Drag coefficient: u * 2 = C D ( U) 2 Iterative Method Z 0 h top CDCD u*u*")
9
10 - m Wind Dependence of the Drag Coefficient Field Experiments results vs. this numerical model Conclusions: This iterative approach is in accordance with field experiments results. The convenience of using either empirical relationships or the numerical model to retrieve the surface stress over the sea depends on available data.

10
Local Effects: Atmospheric stability Air – sea temperature contrast

11
General Conditions of Atmospheric Stability Wind profile in the surface layer whereObukhov length virtual potential temperature make

12
Drag coefficient C D as a function of 10 m wind and temperature Hellerman and Rosenstein (1983 ) This model Atmospheric stability effect on the surface wind stress
 This model Atmospheric stability effect on the surface wind stress")
13
Running Numerical Models The approach for input wind / pressure fields Real Time Data Flow / Operations Data Assimilation Time HH + cut-offH + cut-off + NWP Data reception Data assimilation + NWP run Wave / Surge Models run Products available FTP Wave / Surge Models run

14
Numerical Models for Marine Forecasts SMARA / WAM WAM ciclo 4.0 (Komen et al., 1994). Nested versions: Southeastern South Atlantic 1º x 1º Continental Shelf 1/4º x 1/4º Río de la Plata 1/20º x 1/20º Depth averaged tide and surge model (Etala, 2000; 1996). Nested versions: Continental Shelf : 1/3º x 1/3º Río de la Plata: 1/20º x 1/20º Bahía Blanca 1/180º x 1/120º Wave ModelsStorm Surge Models
. Nested versions: Continental Shelf : 1/3º x 1/3º Río de la Plata: 1/20º x 1/20º Bahía Blanca 1/180º x 1/120º Wave ModelsStorm Surge Models.")
15
Currently, it is accepted that roughness length is a function of wave age (Johnson et al., 1998). WAM-4 introduces dependence for Charnock parameter (Janssen, 1989) Over the waves, total surface stress turbulent surface wind stress wave induced stress In classic theory, roughness length over the water is (Charnock, 1955) Air – Sea Momentum Exchange ch Charnock parameter
 Over the waves, total surface stress turbulent surface wind stress wave induced stress In classic theory, roughness length over the water is (Charnock, 1955) Air – Sea Momentum Exchange ch Charnock parameter.")
16
Coupled System The May 2000 Storm Wind at the lowest sigma level of NCEP reanalisis 16 May 2000 12:00 Z. Isotachs every 2,5 m/s.

17
Surface Stress in the Storm Surge Model decoupled, coupled, friction velocity u* as calculated by WAM-4. s = a u * 2

18
Normalized Wave Induced Stress Tn (%) 16 May 2000 12:00 Z Shelf SMARA / WAMRio de la Plata SMARA / WAM
 16 May :00 Z Shelf SMARA / WAMRio de la Plata SMARA / WAM")
19
Normalized Wave Induced Stress Tn (%) and Significant Wave Height Hs(dm) Off-shore the Uruguay maritime coast At the outer Río de la Plata the minimum of Tn is associated to the maximum wave development.
 and Significant Wave Height Hs(dm) Off-shore the Uruguay maritime coast At the outer Río de la Plata the minimum of Tn is associated to the maximum wave development.")
20
The Model Bathimetry The Shelf Sea Tide – Surge Model The Model Grid

21
COUPLED Storm Surge Water Level in Río de la Plata 16 May 2000 15Z DECOUPLED

22
Storm Surge Water Level in Buenos Aires ( Inner estuary ) 0 0.5 1 1.5 2 2.5 3 3.5 15/05/00 0:00 15/05/00 12:00 16/05/00 0:00 16/05/00 12:00 17/05/00 0:00 17/05/00 12:00 18/05/00 0:00 18/05/00 12:00 nivel (m) observadaU10 (no acoplado)Usig (no acoplado) U10 (acoplado)Usig (acoplado) Observed water level and modeled values as from 10 - m wind (U10) and lowest sigma level (Usig) of the NCEP reanalyses. Coupled and decoupled runs.

23
The wave induced stress acts in the scale of wave development, which is similar to the storm surge scale. At the initial stage of the event, the wave induced stress may be the same order of the turbulent stress. The wave induced stress action has direct consequences on the storm surge forecast, BUT.... The benefit introduced by the coupling may be still of less magnitude than the error introduced by surface wind uncertainty. The Rio de la Plata is a large estuary where wave growth may be important and this interaction has got enough time to develop its effects. Depending on local and regional features, the consideration of other types of interactions can be more relevant in determining total water level. Remarks

24
STORM SURGE / TIDAL MODEL A SIMPLE INTERACTIVE SCHEME ATMOSPHERIC MODEL WAVE MODEL surface wind stress sea level pressure wave stress tidal and surge currents water level total surface stress

25
The Bahía Blanca estuary

26
The Model Bathimetry The Model Grid

27
M2M2 Bahia Blanca M 2 Tide

28
Modeled hourly currents during 30 days

29
D u (i,t+ t) > dmin flooded grid point where D u (i,t+ t) = H u (i) + (h (i,t+ t) + h (i+1,t+ t) ) / 2 and D (i,t+ t) > dmin y D (i+1,t+ t) > dmin or D (i,t+ t) > dmin y D (i+1,t+ t) dmin pero h (i,t+ t) - h (i+1,t+ t) > or D (i,t+ t) dmin y D (i+1,t+ t) > dmin pero h (i+1,t+ t) - h (i,t+ t) > from Flather and Heaps (1975) Flooding and Drying Algorithm d min h = 0 i i + 1 h h i + ½ i i + 1 h h i + ½ Flooded Point i i + 1 hh i + ½ Dry Point i i + 1 hh i + ½ h = 0 d min
 > dmin flooded grid point where D u (i,t+ t) = H u (i) + (h (i,t+ t) + h (i+1,t+ t) ) / 2 and D (i,t+ t) > dmin y D (i+1,t+ t) > dmin or D (i,t+ t) > dmin y D (i+1,t+ t) dmin pero h (i,t+ t) - h (i+1,t+ t) > or D (i,t+ t) dmin y D (i+1,t+ t) > dmin pero h (i+1,t+ t) - h (i,t+ t) > from Flather and Heaps (1975) Flooding and Drying Algorithm d min h = 0 i i + 1 h h i + ½ i i + 1 h h i + ½ Flooded Point i i + 1 hh i + ½ Dry Point i i + 1 hh i + ½ h = 0 d min")
30
The Tide / Surge Model Equations where: Hmean water level hwater level perturbation over the mean u,vcomponents of depth averaged current F s,G s components of the surface wind stress F B,G B components of the bottom stress patmospheric pressure D=H+htotal water depth rconstant water density Rradius of the Earth Ahorizontal diffusion parameter

31
Surface Stress a = air density W = surface wind c s = drag coefficient Bottom Stress q = depth averaged current c B = drag coefficient

32
In the scale of the tide... Increases or disminishes the storm surge. Factors affecting the nature of the interaction: Large VELOCITIES enhance FRICTION interaction. Large AMPLITUDES enhance SHALLOW WATER interaction (either for local permanent factors or transitory astronomical factors) Small depth enhances both. Interaction is favoured when the tidal and surge waves travel together for a long distance. Tide / Surge Interaction In the storm surge scale... Changes the phase of the tidal wave. It may modify the tidal amplitude if it is close to resonance. Reverses the frictional interaction effect in the scale of the tidal wave, according to its increasing or decreasing stage.
 Small depth enhances both. Interaction is favoured when the tidal and surge waves travel together for a long distance. Tide / Surge Interaction In the storm surge scale... Changes the phase of the tidal wave. It may modify the tidal amplitude if it is close to resonance. Reverses the frictional interaction effect in the scale of the tidal wave, according to its increasing or decreasing stage..")
33
V = 5 m/sV = 10 m/s V = 20 m/s Iffriccional interaction prevails. Constant Wind Simulation (Bahia Blanca Estuary) ¿ Which is the main cause of interaction ?
 ¿ Which is the main cause of interaction .")
34
15/6/97 0:00 Z Surface Pressure. Isobars every 3 hpa.NCEP 10-m wind. Isotachs every 2,5 m/s. Case Study: 14 - 15 june 1997

35
The surge on the shelf interval 0.20 m

36
Tidal Constants in the Bahia Blanca Estuary Amplitude Phase

37
Water level at Bahia Falsa. An anticipation of the combined wave with respect to the tide is observed, due to the shallow water interaction. -1.5 -0.5 0 0.5 1 1.5 2 2.5 3 13/6/97 21:0014/6/97 9:0014/6/97 21:0015/6/97 9:0015/6/97 21:00 nivel (m) total tide surge Shallow water Interaction
 total tide surge Shallow water Interaction.")
38
Modeled Storm Surge Water Level at three points along the Main Channel Observed and Modeled Storm Surge Water Level and Total Water Level Puerto Belgrano

39
0 0.2 0.4 0.6 0.8 1 1.2 1.4 1.6 1.8 13/6/97 21:0014/6/97 9:0014/6/97 21:0015/6/97 9:0015/6/97 21:00 nivel (m) no tide Reference run Puerto Belgrano Effect on water Level Is the surge / tide interaction responsible for the modulations ? Frictional Interaction

40
Analisis of Modeled Currents Puerto Belgrano where i = t+s - t - s is interaction on variable positive sign towards the mouth of the estuary (ebb) negative sign towards the head (flood)
 negative sign towards the head (flood)")
41
Ebb Tide Water Level (m) and Currents 14/6/97 8 Z Storm Surge Tidal Wave Combined Wave
 and Currents 14/6/97 8 Z Storm Surge Tidal Wave Combined Wave")
42
Flood Tide Water Level (m) and Currents 14/6/97 14 Z Storm Surge Tidal Wave Combined Wave
 and Currents 14/6/97 14 Z Storm Surge Tidal Wave Combined Wave")
43
Water Level (m) and Currents 14/6/97 17 Z High Tide Storm Surge Tidal Wave Combined Wave
 and Currents 14/6/97 17 Z High Tide Storm Surge Tidal Wave Combined Wave")
44
The Tide and Surge relative Phase Currents produced by the tide / surge interaction when modifying the relative phase of the waves. Evolution of the surge level near high tide when varying its phase with respect to the tide.

45
M 2 Tidal Constants and Tidal Current Ellipses Scenario of Strong Tidal Currents Implications for waves and surge

46
M 2 Tidal Currents Ellipses __ after Rivas (1997) __ this model
 __ this model")
47
Stations used for tidal model verification

48
Verification of Tidal Constants in the Shelf Sea (M 2 )
")
49
Wave Height Verification Vs. Topex - Poseidon

50
Wind Speed Verification Vs. Topex - Poseidon

51
Concluding Remarks Local / regional applications main challenge is to be accurate while practicable, that is, to keep in mind the final objective that useful forecasts reach the public in a timely fashion. Each developer identifies local or regional fenomena features and consequently chooses the approach and tools that better represent them, always fitting real capabilities for achieving sustained services. International cooperation, data and models availability provide a favourable scenario for the development of such applications. At the same time, they provide a frame for local products quality, that forecasters currently know they can obtain.

Similar presentations


 Resources: Lecture notes available at:>")
>")
 Área de Conocimiento y Análisis del Medio Físico Puertos del.>")


, during 2004 was used as an example. Click to continue A demonstration.>")


 Buenos Aires ARGENTINA.>")
 Overview of models Slab (integral) models K-closure model K-profile.>")

