Download presentation
Presentation is loading. Please wait.

1
Territorial Impacts of the CAP. ESPON Project 2.1.3 Final Report Mark Shucksmith, Ken Thomson, Deb Roberts, and partners University of Newcastle upon Tyne and Arkleton Centre for Rural Development Research University of Aberdeen, Scotland

2
Introduction Aims: In the context of the ESDP to deepen understanding of the territorial impacts of the CAP and RDP, across EU-27 at NUTS3. Methods: –Assessed against higher-level EU objectives using multivariate techniques –Case Studies and literature –Used outputs from CAPRI model of MTR

3
Gradual CAP reforms. MacSharry reforms (1992) and Agenda 2000 reduced price support, tariffs and export subsidies, but offset by direct payments. New pressures from WTO & EU expansion. Movement from market support (Pillar 1) to rural development measures (Pillar 2). Mid Term Review of CAP in June 2003 introduced partial decoupling.
 and Agenda 2000 reduced price support, tariffs and export subsidies, but offset by direct payments. New pressures from WTO & EU expansion. Movement from market support (Pillar 1) to rural development measures (Pillar 2). Mid Term Review of CAP in June 2003 introduced partial decoupling..")
4
CAP Subsidies EAGGF expenditure totalled 40.5bn in 2000. –Intervention expenditure (30.5bn) of which most are direct payments to farmers (25.6bn). –Export refunds (5.6bn) –Rural development payments (4.2bn) (Pillar 2) Expenditure figures exclude Market Price Support - subsidies (c. 56bn) received by farmers thru higher prices paid by consumers.
 of which most are direct payments to farmers (25.6bn). –Export refunds (5.6bn) –Rural development payments (4.2bn) (Pillar 2) Expenditure figures exclude Market Price Support - subsidies (c. 56bn) received by farmers thru higher prices paid by consumers..")
5
Key Findings Most CAP support is through Pillar 1 - Market Price Support, Direct Payments, etc (90bn pa). This support benefits richer, core regions, with lower unemployment rates. This reflects their larger farms, farm type and core location. Only direct payments are consistent with economic cohesion, but these are outweighed by dominant Market Price Support (56bn pa.)
.")
6
Map 4.1 Total Pillar 1 support per AWU, 1999

7
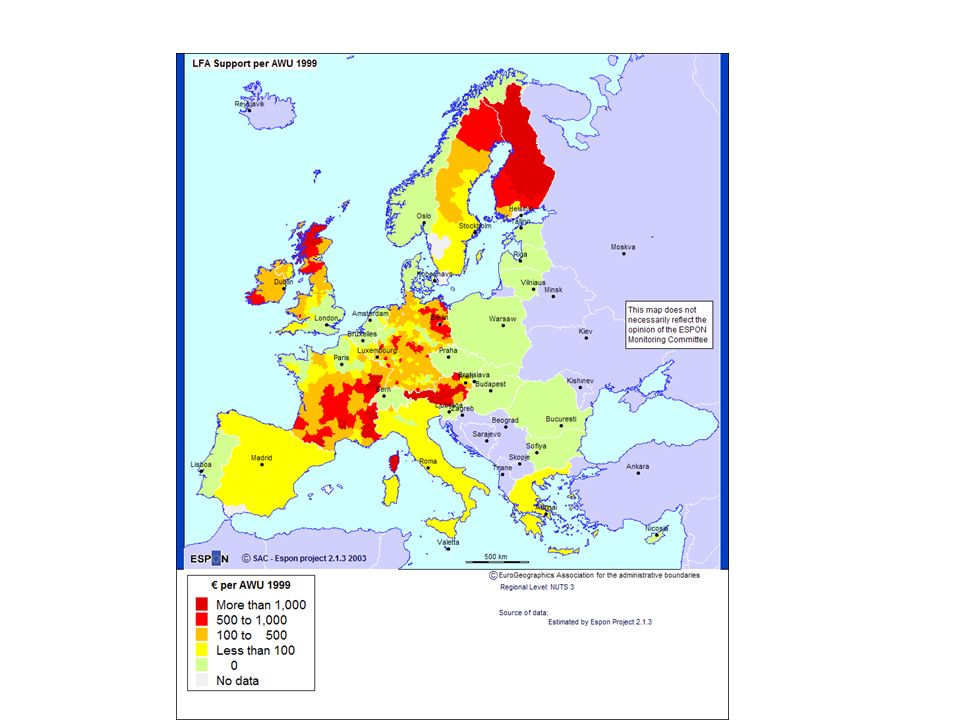
Key Findings Surprisingly, Pillar 2 (4.6bn) does not support cohesion either. Agri-Environmental, and even LFA payments tend to benefit richer regions, mainly because of differing national priorities. Poorer countries prioritise farm modernisation. Nevertheless, there is potential to adjust Pillar 2 so as to support cohesion objectives.

11
Key Findings MTR makes little difference. Reformed CAP will still work against cohesion, unless national implementation aims at territorial cohesion through their Rural Development Plans.

13
Accessibility and regional type While Pillar 1 favours core, Pillar 2 favours more peripheral and less accessible regions. Using OECD typology, rural regions receive 45% of Pillar 1 and 50% of Pillar 2 support. Using TPG 1.1.2 urban-rural typology, though, CAP support goes to urban regions. Our own typology confirms support goes to core regions and meso-accessible regions.

14
Impacts of Selected Measures Case Studies of selected measures: –Farm household adaptation to changing policies –Agri Environment programmes –Less Favoured Area Scheme –Early Retirement Scheme –LEADER and Article 33 measures to deepen insights into the core issues and to elaborate the cause/effect relationships.

15
LEADER-type measures The measure most closely related to the concept of integrated rural development. Emphasis on multi-sectoral approach and on local participation and institution-building. Flexible programme structure can be adapted to the diverse contexts of rural regions – unusual in being suitable for addressing regional inequalities. Now more effective and targeted. Process of capacity-building and collective learning.

16
Policy Proposals Welcome the Commissions gradualist proposals to allow member states to spend more on LEADER-type measures (Commissions proposals for RDR 2007-13). Increase Pillar 2 budget progressively, as proposed by the Commission. Broaden RDR to include more measures for sustainable rural devt beyond agriculture. Support rural community development.

17
Policy Proposals Review rates of co-financing in convergence countries, since this inhibits use of the RDR. Allocate RDR budget according to criteria of relative needs for rural development and environmental management. The more that WTO negotiations lead to cuts in Pillar 1 Market Price Support, the greater the resulting consistency of the CAP with the EUs territorial cohesion objectives.

18
Policy Proposals Review institutional arrangements for rural development and agriculture. Finally, information on CAP expenditure and implementation at regional level is very poor. It will be very important to support policy-making in future through improving the database to enable comparable European wide analysis, and this will require administration of CAP instruments to take into account the regional and territorial dimension.

Similar presentations


 DEVELOPMENT>")


