Download presentation
Presentation is loading. Please wait.

1
Regional Policy 2011 Annual reports EU Overview reporting 23/11 – MS Evaluation Network REGIO B2 – Evaluation and European Semester J Walsh / A Abdulwahab

2
Regional Policy Key points Focus of strategic reports / calendar Data transfer Indicators / evaluations - Core indicators (ERDF/CF) Categorisation (inputs) – Dimensions Next steps Submisison / publication COCOF presentations – early 2012 End March Commisison summary Inter institutional debates
 Categorisation (inputs) – Dimensions Next steps Submisison / publication COCOF presentations – early 2012 End March Commisison summary Inter institutional debates")
3
Regional Policy Focus of NSRs 2012 Clear picture on programme implementation and achievements of CP compared to its objectives – evidence on the performance and effectiveness Assessing impacts of the economic and financial crisis on the programmes Contribution to Europe 2020 and Growth Compact A source of input to the next round of programming - good data quality important

4
Regional Policy Time Schedule June 2012 Submission of OP annual reports July 2012 Following the submission of the 2011 AIRs, the Commission will engage in quality checks and seek to correct with the programmes the clear inaccuracies – Deadline 30/9/2012 October 2012 Commission will present the MS with a harmonised analysis of the data from the AIR Commission will provide each MS with an extract from its database on the financial implementation of the Ops December 2012 The body of the reports should be presented electronically through SFC, by no later than 31/12/2012

5
Regional Policy Core Indicators 2012: Progress Achieved Results of 2011: Programmes accelerating, progress against all core indicators Reporting on targets have improved but achievements are still better reported Increased coverage but not all OPs reporting core indicators Reporting actual values (instead of contracted) increased Many technical problems seem resolved Decimals: dot vs. comma Typos or incomprehensible numbers 5

6
Regional Policy Most Frequent Problems Much of the data in SFC is still of insufficient quality for automatic aggregation. Recurrent mistakes: Not Cumulative (vs. annual) values Incorrect Measurement units – i.e. measurement unit for induced investment (m vs ) Missing target values Baselines are included in target values Quality of job creation indicator: completion vs. construction, double counting, men+women 6
 values Incorrect Measurement units – i.e. measurement unit for induced investment (m vs ) Missing target values Baselines are included in target values Quality of job creation indicator: completion vs. construction, double counting, men+women 6.")
7
Regional Policy Categorisation - introductory remarks Categorisation … vital part of monitoring, transparency, strategic reports An information system (not control / eligibility) for tracking financial inputs Decided Programmed Reprogramming Allocated to projects, by MS, Objective, themes But not procured or spent Progress, improvements in reliability
 for tracking financial inputs Decided Programmed Reprogramming Allocated to projects, by MS, Objective, themes But not procured or spent Progress, improvements in reliability")
8
Regional Policy Overview Project selection data 1.Priority Themes a)By MS b) By themes c) Lisbon earmarking d) Reprogramming 2.Form of finance 3.Territorial dimension 4.Economic Dimension 5.Location – NUTS
By MS b) By themes c) Lisbon earmarking d) Reprogramming 2.Form of finance 3.Territorial dimension 4.Economic Dimension 5.Location – NUTS")
9
Regional Policy 1. Project Selection - aggregate trends DateEUR Billion% allocated 09/200993.427.1% 12/200990.826.4% 12/201018152.2% 12/201124470.4% Mid-2012 (informal) 27879.9% Total Budget decided (2012) 346.7100%
 % Total Budget decided (2012) %.")
10
Regional Policy 1 a) Allocated reported by Member States 2009-2010-2011 Compare each MS to EU average.. why? Different selection procedures / definitions Different balances between Infrastructure and soft measures Remaining data weaknesses (+/- 8 bn corrections 2011): Annualised / non cumulative reporting; Some reports not based on selection but procurement, spending; Missing / incomplete / erroneous data.
: Annualised / non cumulative reporting; Some reports not based on selection but procurement, spending; Missing / incomplete / erroneous data..")
11
Regional Policy Allocated 2010

12
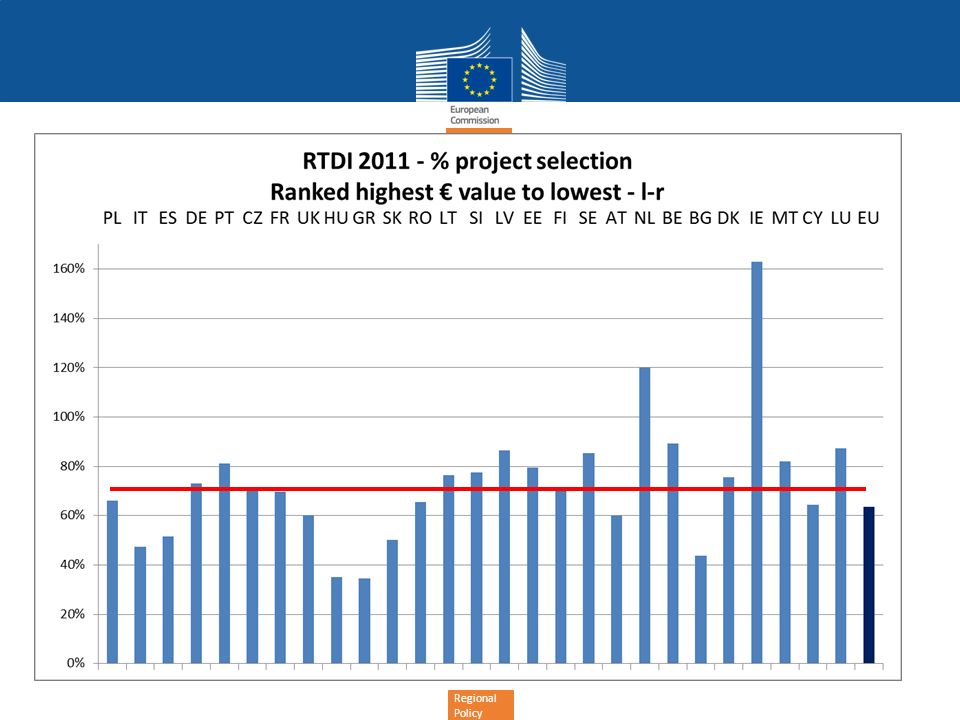
Regional Policy Allocated 2011

13
Regional Policy Allocated mid-2012 (informal @ 09/2012)
")
14
Regional Policy Allocated (2011) vs payments (09/2012)
 vs payments (09/2012)")
15
Regional Policy MS trends NB: Differences in selection definitions … but expect that MS uses it own defintion consistently Some MS have already front loaded – 100% selection (risk of dormant projects ? failure in implementation?) Some MS have indicated that open selection processes will soon see full allocation (i.e. DE, PL, UK) Other MS have still have to formalise significant selection processes
 Some MS have indicated that open selection processes will soon see full allocation (i.e. DE, PL, UK) Other MS have still have to formalise significant selection processes.")
16
Regional Policy 1 b) Thematic Implemenation by Objective
 Thematic Implemenation by Objective")
17
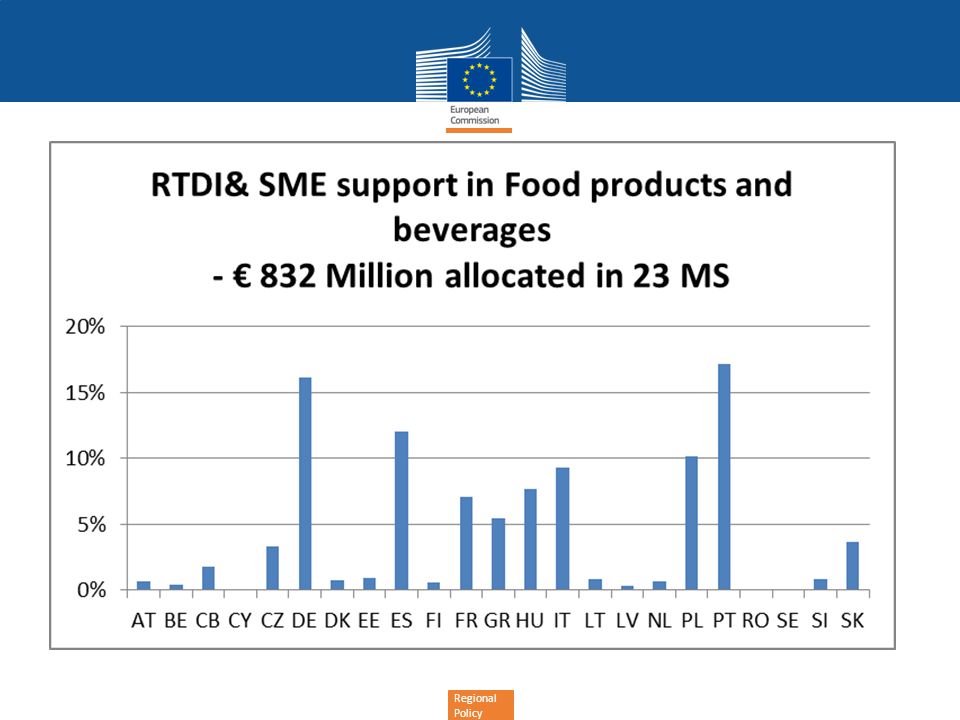
Regional Policy Project Selection 2011 - major themes

18
Regional Policy Components of "Rail"

19
Regional Policy

20
Components of "road"

21
Regional Policy

23
GR= 460%; DK = 570%

24
Regional Policy

26
Components of ENV

27
Regional Policy Thematic trends Data already 11 Months old … long time lag Persistent sectoral delays in some MS clear Rail, Energy, Broadband, Capacity Building, Etc; Growing signs of over / under programming not reflected in formal reprogramming;

28
Regional Policy Convergence 2007-2013 – AIR 2011 – rate of selection by Lisbon earmarks

29
Regional Policy 1 c) Convergence 2007-2010: Rate of implementation of Lisbon earmarking 2010 AIR
 Convergence : Rate of implementation of Lisbon earmarking 2010 AIR")
30
Regional Policy RCE 2007-2010: 2011 AIR Rate of selection by Lisbon earmarks CZ: 250% or over for Lisbon / non-Lisbon; GR: 216% for Lisbon earmarked

31
Regional Policy RCE 2007-2010: 2010 AIR Rate of implementation of Lisbon earmarking vs non earmarked

32
Regional Policy 1 d) Reprogramming Can take different forms Thematic reprogramming (see below) Reprogramming co-financing Increase co-financing within regulatory limits Top up (programme countries) Reprogramming to accelerate use flexibility within priority axes
 Reprogramming Can take different forms Thematic reprogramming (see below) Reprogramming co-financing Increase co-financing within regulatory limits Top up (programme countries) Reprogramming to accelerate use flexibility within priority axes")
33
Regional Policy 1 d) Decided thematic reprogramming – 28 billion - 8% total EU NB : IE = 41%
 Decided thematic reprogramming – 28 billion - 8% total EU NB : IE = 41%")
34
Regional Policy Thematic reprogramming - Graph

35
Regional Policy Decided reprogramming - EU - 2007-2012 (@22/10/2012) Positive mNegative m Net Change m Net Change % Rail1,635.7-1,982.9-347.2-1.5% Road2,917.5-2,010.5907.02.2% Other transport1,282.7-2,102.0-819.3-4.9% Energy1,821.2-878.0943.28.1% Broadband302.8-297.45.40.2% Environment2,502.1-3,685.0-1,182.8-2.6% Culture & social2,811.5-1,578.41,233.15.1% Innovation & RTD6,609.2-4,607.32,001.93.9% Entrepreneurship725.3-1,096.9-371.5-4.6% ICT services1,031.0-1,493.3-462.3-3.7% Generic Bus. Supprt1,541.3-681.6859.65.9% Human capital926.9-1,957.0-1,030.1-3.5% Labour market2,376.1-979.31,396.75.8% Capacity Building147.3-885.6-738.3-6.5% Social Inclusion228.2-311.8-83.6-2.0% Territorial Dimension1,326.6-673.6652.94.3% Technical Assistance305.9-849.1-543.3-5.4% Sum:28,491.2-26,069.72,421.4

36
Regional Policy Other Dimensions …

37
Regional Policy Form of finance - 2011

38
Regional Policy Form of finance - 2010

39
Regional Policy Territorial Dimension - 2011

40
Regional Policy Territorial Dimension - 2010

41
Regional Policy Territorial Dimension Comments: -Improved ventilation: IT, UK NB: Rural = Mountains, Islands, sparsly populated, RUP and other rural Other = ex-Border regions, Cooperation (transnational, interrregional..)
")
42
Regional Policy Economic end use – 2010

43
Regional Policy Economic Dimension – AIR 2011

44
Regional Policy Economic Dimension Less than 20% of allocations to projects not allocated to economic end use; … but very high rates of non allocation in UK, LU, FR, BE, IE, BG, DK and ETC; Improved reporting in SE; Neary 60% allocated to service sectors - including 'public sector'.

45
Regional Policy

47
PT = 50%

48
Regional Policy Labour Market measures (63, 64, 65, 66, 67, 69) by economic sector – AIR 2011
 by economic sector – AIR 2011")
49
Regional Policy Location (NUTS 2/3)
")
50
Regional Policy Next Steps National reports – by end 2012 Outputs / results / evaluations Crisis response EUROPE 2020 contribution Future pointers / reprogramming / post2014 COCOF presentations by delegations Commission analysis Report by 31/3/2013

Similar presentations


 financial engineering instruments for SMEs 5 th Plenary Meeting JEREMIE Networking Platform.>")