Download presentation
Presentation is loading. Please wait.

1
Better Data, Better Science! [ Better Science through Better Data Management ] Todd D. OBrien NOAA – NMFS - COPEPOD
![Better Data, Better Science. [ Better Science through Better Data Management ] Todd D.](http://images.slideplayer.com/2/738425/slides/slide_1.jpg "OBrien NOAA – NMFS - COPEPOD.")
2
BETTER DATA is … Easily Accessible Well Documented Integrated / Interlinked The Best Quality possible

3
Oops! (When Data Management Fails)
")
4
BETTER DATA is … Easily Accessible Well Documented Integrated / Interlinked The Best Quality possible

5
BETTER DATA is … Easily Accessible Well Documented Integrated / Interlinked The Best Quality possible

6
WHY QC? To find errors in the data …

7
WHY QC? To find errors in the data … –To detect instrument failure or sampling problems

8
WHY QC? To find errors in the data … –To detect instrument failure or sampling problems –To detect phenomena of scientific interest Natural physical or biological events Something new

9
WHY QC? To find errors in the data … that were not present in the original data ?!

10
WHY QC? To find errors in the data … that were not present in the original data ?! –Data Pathway errors human error computer error

11
WHAT TO QC? Individual values (the measurements)? Profile of multiple values? Cruise of multiple profiles? Project of multiple cruises? Region or Ocean of multiple Projects? Entire World of multiple Regions?

12
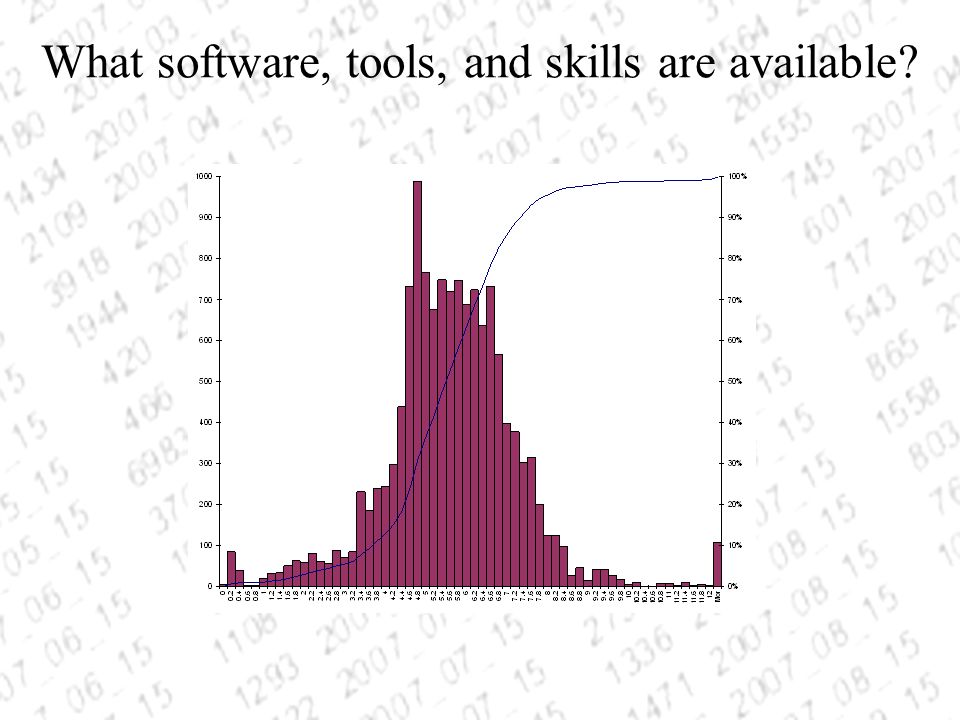
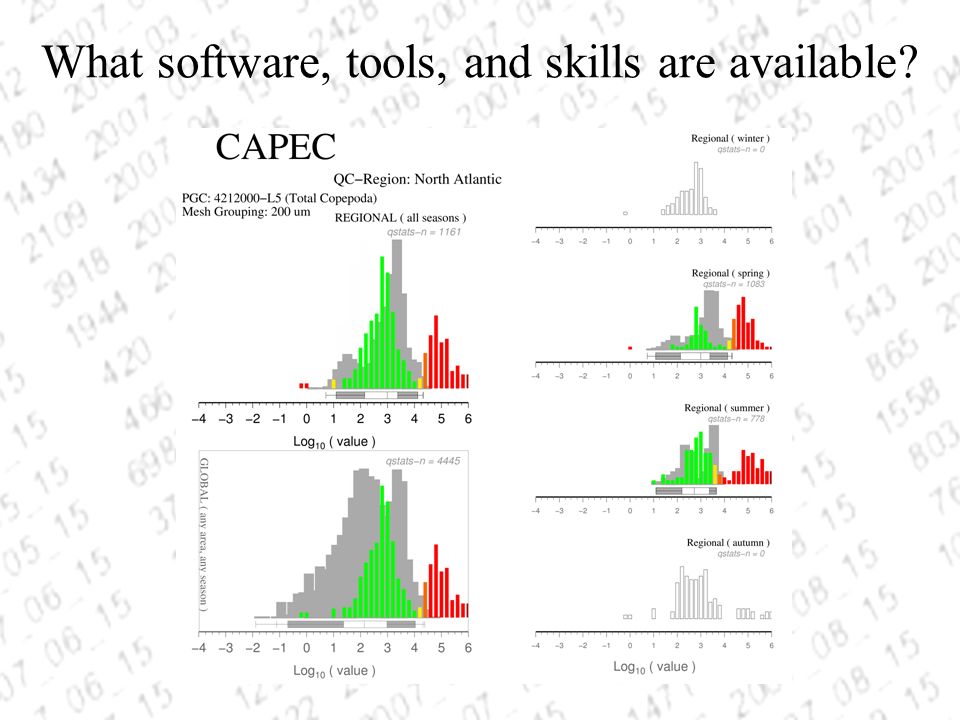
What software, tools, and skills are available?

19
Lets get started …

20
QC OF THE WHAT & HOW

21
Need to first understand the methods, variables, and units of the data before trying to QC the data

22
QC OF THE WHAT & HOW Need to first understand the methods, variables, and units of the data before trying to QC the data –Are all labels clear and unambiguous –Are methods provided (or a reference) –What are the value units
 –What are the value units")
23
QC OF THE WHEN & WHERE

24
Primary Data: –First, check the master ship record –Then check PI files

25
QC OF THE WHEN & WHERE Primary Data: –First, check the master ship record –Then check PI files Simple Range Checks –Time (0-23? 1-24?) What is the time zone? –Lat +/- 90 Lon +/- 180 Are hemisphere signs present (E/W) or described
 What is the time zone. –Lat +/- 90 Lon +/- 180 Are hemisphere signs present (E/W) or described.")
26
QC OF THE WHEN & WHERE Map the Cruise Track –sorted by station sequence –sorted by sampling time

27
QC OF THE WHEN & WHERE Calculate ship speed (distance/time) between stations
 between stations")
28
QC OF THE HOW MUCH

29
First, look at the background environment Check for depth inversions Check for density inversions Look at T vs. S plot

30
QC OF THE HOW MUCH Look at the variable vs. depth

31
QC OF THE HOW MUCH Check against basic value ranges

32
QC OF THE HOW MUCH Check against basic value ranges Check for excessive gradients (spikes) between values at adjacent depths
 between values at adjacent depths")
33
QC OF THE HOW MUCH

34
Expert / Specialist Data Centers

35
Can provide guidance on –Metadata (standards, minimum requirements) –Data Formats (format suggestions / review) –Tools and Methods
 –Data Formats (format suggestions / review) –Tools and Methods")
36
Expert / Specialist Data Centers Can provide guidance on –Metadata (standards, minimum requirements) –Data Formats (format suggestions / review) –Tools and Methods May have advanced visualization or QC methods available for your data.
 –Data Formats (format suggestions / review) –Tools and Methods May have advanced visualization or QC methods available for your data.")
38
Empirical Comparisons with Historical Observations (ECHO)
")
39
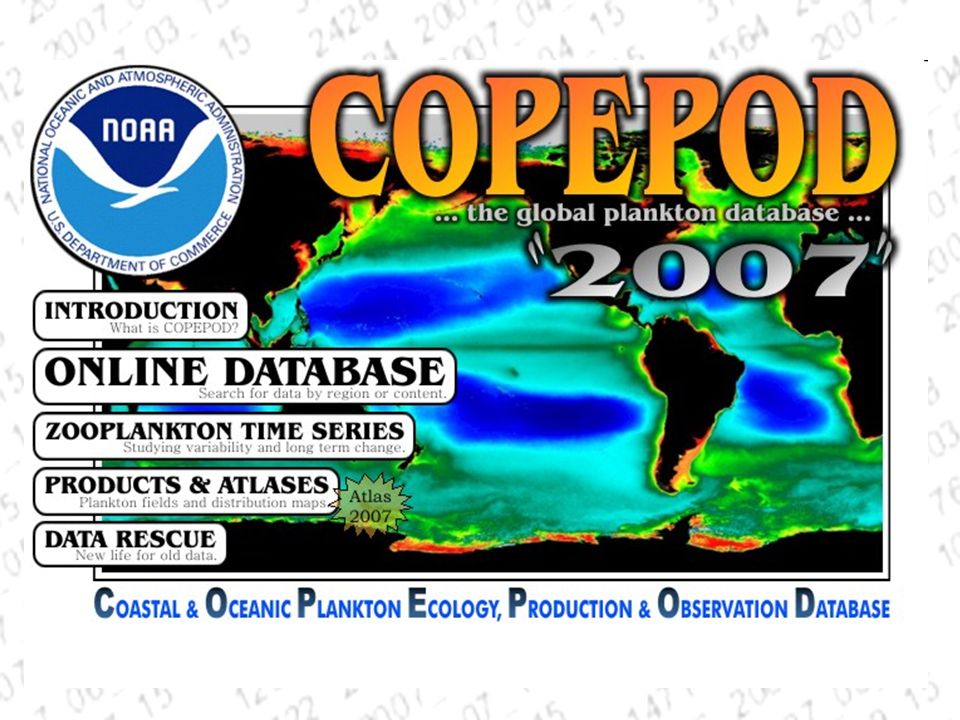
Expert / Specialist Data Centers (just a few examples) CCHDO- CLIVAR Carbon & Hydrographic Data Office BCO-DMO- Biological and Chemical Oceanography Data Management Office BODC- British Oceanographic Data Centre COPEPOD- Coastal & Oceanic Plankton Ecology, Production & Observation Database
 CCHDO- CLIVAR Carbon & Hydrographic Data Office BCO-DMO- Biological and Chemical Oceanography Data Management Office BODC- British Oceanographic Data Centre COPEPOD- Coastal & Oceanic Plankton Ecology, Production & Observation Database")
40
The Conclusions

41
Some Conclusions Each additional layer of QC and examination may highlight issues that were previously undetected.

42
Some Conclusions Each additional layer of QC and examination may highlight issues that were previously undetected. Each instance of transfer or reformatting the data has a chance of introducing new errors (or data loss).
..")
43
Some Conclusions Each additional layer of QC and examination may highlight issues that were previously undetected. Each instance of transfer or reformatting the data has a chance of introducing new errors (or data loss). The comprehensiveness of the co-stored metadata will determine the extent to which the data are still usable/understandable 10+ years after the project.
. The comprehensiveness of the co-stored metadata will determine the extent to which the data are still usable/understandable 10+ years after the project..")
44
BETTER DATA is … Easily Accessible Well Documented Integrated / Interlinked The Best Quality possible

Similar presentations


 Jonathan Callahan (University of Washington) Steve Hankin (NOAA/PMEL – PI) Roland Schweitzer, Kevin.>")

 EDM Workshop 2014, Silver Spring,>")


 Review developments over last year Current status Future work.>")


 BODC Adam Leadbetter British Oceanographic Data Centre Joseph Proudman Building 6 Brownlow Street Liverpool.>")
