Download presentation
Presentation is loading. Please wait.

1
DLI Orientation: Concepts A Framework for Thinking about Statistical Information Train the Trainers Montreal, March 9, 2004 Chuck Humphrey Data Library University of Alberta February 2004 Wendy Watkins Carleton University

2
Statistical Information Two models for identifying and selecting appropriate statistical information: 1. A chart of statistical information Distinguishing statistics & data Distinguishing aggregate data & microdata

3
Statistical Information 2. Continuum of access Matching dissemination channels with desired products

4
Statistics or Data Statistics numeric facts/figures created from data, i.e, already processed presentation-ready Data numeric files created and organized for analysis requires processing not ready for display

5
Statistics or Data

8
Chart of Statistical Information

9
This is a typology of the categories or classes of statistical information. Remember the relationship between statistics and data, however, is causal. Statistics are created from data.

10
Chart of Statistical Information

11
An overlap occurs in this chart between Statistics: Databases and Data: Aggregate, which will be discussed below.

12
Chart of Statistical Information In print

13
In Print Rely on yearbooks, statistical abstracts, catalogues, and indexes to locate statistics in print. Examples of online indexes to print resources: Statistical Universe and Tablebase Example of an online catalogue to print resources: Statistics Canadas Online Catalogue

14
Chart of Statistical Information Online

15
Online Statistics Example of e-publications Statistics Canada Downloadable Publications (DSP) Example of e-tables Canadian Statistics (STC Website) Example of statistical databases CANSIM II (STC Website, E-STAT, CHASS)
 Example of e-tables Canadian Statistics (STC Website) Example of statistical databases CANSIM II (STC Website, E-STAT, CHASS)")
16
E-Publications Tend to be available in PDF format Can use the Select Text Tool in the Adobe Reader and copy columns to another application

17
Statistical Information

18
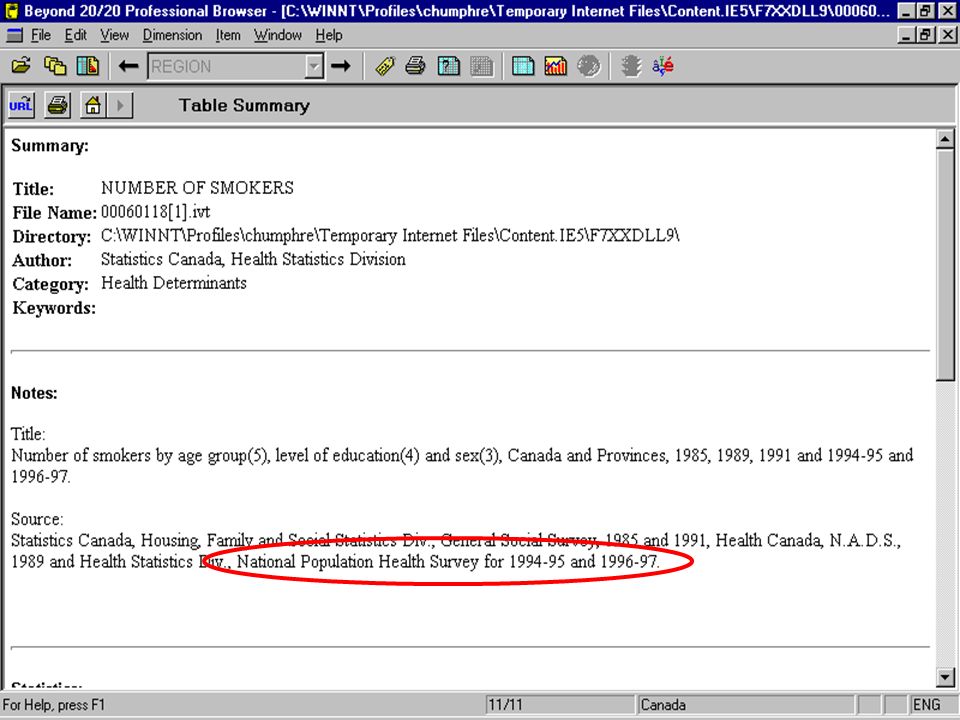
E-Tables Tend to be displayed in HTML May provide a pull-down list to view other categories in the table Some e-tables will provide an alternate format for the table that can be downloaded (e.g., the Census tables are available in comma-separated ASCII, IVT, and print-friendly formats)
")
20
Databases Often use HTML forms to define the statistics to be retrieved May offer a variety of output formats for the retrieved statistics (e.g., E-STAT provides IVT format for Beyond 20/20, graphs, charts, maps, and ASCII formats for spreadsheets and databases)
")
23
Chart of Statistical Information Aggregate Data

24
Aggregate Data Aggregate data are statistics organized in databases or in data files. The data structure usually consists of tabulations structured by time, geography, or social content.

25
Aggregate Data Data Structure Time Geography Social Content Example: CANSIM II

26
Aggregate Data Time series data have long fueled econometric models. Comma-separate values (CSV) has become an important format for time series data, which is often manipulated in Excel if not analyzed in a spreadsheet.
 has become an important format for time series data, which is often manipulated in Excel if not analyzed in a spreadsheet..")
27
Aggregate Data Data Structure Time Geography Social Content Example: CENSUS

28
Aggregate Data Increased access to GIS software has created greater demand for Census statistics. Beyond 20/20 has become a popular tool for reshaping census statistics from 1996 and 2001 for use with GIS software. DBF is the most commonly used format to share census statistics with GIS software.

29
Aggregate Data A map from E-STAT of Montreal Census Tracts

30
Aggregate Data Small area statistics are a special category of aggregate data. These data files consist of statistics for small geographic areas usually calculated from a population or manufacturing census or an administrative database with enough cases to create accurate summaries for small areas.

31
Aggregate Data Data Structure Time Geography Social Content Example: Cause of Death (HID)
")
32
Aggregate Data Also known as cross-classified data, these files tend to consist of tables constructed from social content variables. Examples of cross-classified tables in DLI are found in education and justice.

33
Chart of Statistical Information Microdata

34
Raw data organized in a file where the lines in the file represent a specific unit of observation and the information on the lines are the values of variables.

35
Confidential Microdata Master files: these files contain the fullness of detail captured about each case of the unit of observation. This detail is specific enough that the identify of a case can often be easily disclosed. Therefore, these files are treated as confidential.

36
Confidential Microdata Share files: these are confidential files in which the cases have signed a consent form permitting Statistics Canada to allow access to their information for approved research.

37
Public Use Microdata These microdata are specially prepared to minimize the possibility of disclosing or identifying any of the cases in a file. The original data from the master file are edited to create a public use microdata file.

38
Public Use Microdata Steps in Anonymizing Microdata Remove of all personal identification information (names, addresses, etc); Include only gross levels of geography; Collapse detailed information into a smaller number of general categories; Cap the upper range of values of variables with rare cases; Suppress the values of a variable; or Suppress entire cases.
; Include only gross levels of geography; Collapse detailed information into a smaller number of general categories; Cap the upper range of values of variables with rare cases; Suppress the values of a variable; or Suppress entire cases.")
39
Public Use Microdata Statistics Canada PUMFs Only available for select social surveys that undergo a review of the Data Release Committee, an internal Statistics Canada committee. No enterprise public use microdata

40
Public Use Microdata Statistics Canada PUMFs Almost all are cross-sectional, that is, represent data collected at one point in time. Longitudinal data are difficult to anonymize and maintain any useful information.

41
Summary: First Model

42
This first model provides a way of thinking about the types of statistical information that exist. Is the information Statistics or Data? If Statistics, is the information in print or online? If online, is it in an e-pub, e-table, or database? If Data, is the information aggregate data or microdata?

43
The Second Model It is one thing to know the variety of statistical information that exists, but access to this information is quite a separate issue. The second model describes the various dissemination channels through which access is provided to statistical information by Statistics Canada.

44
Continuum of Access Statistics Canada provides access to its statistical information through a variety of services and initiatives that function as dissemination channels. Think of this variety as constituting a continuum along which levels of access are provided.

45
Continuum of Access There are three characteristics that make up this continuum: Cost : which runs from free to expensive; Restrictions or conditions : which runs from open or no restrictions to very restricted; and Type of Information : which runs from statistics to data.

46
CANSIM II and Trade Analyzer Services available for selected titles. Remote job submission is the most developed for NPHS. Applications can now be submitted through the SSHRC Web site. ACCESS Open Free Statistics Restricted Expensive Data

47
Using the Two Models Combining these two models should assist you in identifying and selecting appropriate statistical information. The types of statistical information should help you identify an appropriate product, while the continuum of access should help you locate the channel or channels through which the statistical information is disseminated.

48
Warning Remember that while Statistics Canada is an important source of statistical information in our country, it is not the only source. Other important sources include other federal government and provincial departments, data libraries and archives, non- & inter-governmental agencies, and commercial vendors.

Similar presentations


 Karen Dennison UK Data Archive Improving access to government datasets 18 January 2007.>")


