Download presentation
Presentation is loading. Please wait.

1
MDGs Dec. 2015

2
M illennium D evelopment G oals

3
1. Poverty and Hunger

4
Overview Reducing hunger and undernutrition will be critical to the success of the other MDGs, particularly those relating to poverty, education, gender, child mortality, maternal mortality and health. This goal was met worldwide by 2010. Global poverty is projected to fall to 15% by 2015. However, certain regions and countries will not halve extreme poverty and/or meet the sub targets. Hunger and the lack of decent work are unacceptable facets of human poverty, reinforcing each other in a vicious circle: households suffering from hunger are generally deprived of decent jobs, and the lack of decent work brings hunger and deprivation.

5
Facts to Remember 29% of countries are on track or have already halved child malnutrition. 54% of developing countries are on track or have met the goal of cutting extreme poverty in half. From 2011-2013, 173 million less suffered from chronic hunger than 1990-1992. South Asia has half of the world’s undernourished children. One out of four children in developing countries are underweight. One of out four youth in the Middle East and North Africa are unemployed. In both those regions, the unemployment rate has rested at 25% for the last three generations. 21.2% of workers in the world lived on $1.25 per person as a result of the economic crisis.

6
Key Words in Target and Sub Targets Target: Halve the amount of people living in extreme poverty. Extreme Poverty is defined as “an average daily consumption of $1.25 or less and means living on the edge of subsistence.” (The World Bank) Labor productivity reflects the connection between the broader economy and the labor market, and is a well- accepted measure of economic performance. Hunger is defined as a feeling of discomfort or weakness caused by lack of food, coupled with the desire to eat. The FAO defines hunger as the consumption of less than 1600- 2000 calories per day.
 Labor productivity reflects the connection between the broader economy and the labor market, and is a well- accepted measure of economic performance. Hunger is defined as a feeling of discomfort or weakness caused by lack of food, coupled with the desire to eat. The FAO defines hunger as the consumption of less than calories per day..")
7
Results of the Sub Targets 1A. Halve, between 1990 and 2015, the proportion of people whose income is less than $1.25 a day. The global poverty rate at $1.25 a day fell in 2010 to less than half the 1990 rate. 700 million fewer people lived in conditions of extreme poverty in 2010 than in 1990. However, at the global level 1.2 billion people are still living in extreme poverty. 1B. Achieve full and productive employment and decent work for all, including women and young people. Globally, 384 million workers lived below the $1.25 a day poverty line in 2011—a reduction of 294 million since 2001. The gender gap in employment persists, with a 24.8 percentage point difference between men and women in the employment-to-population ratio in 2012.

8
Sub Targets Cont. 1C. Halve, between 1990 and 2015, the proportion of people who suffer from hunger. The hunger reduction target should be almost met by 2015. Globally, about 842 million people are estimated to be undernourished. More than 99 million children under age five are still undernourished and underweight. The total number of individuals suffering from malnutrition has fallen since 1990 but has stalled since 2002. It was estimated that in 2012, 925 million people suffered from chronic hunger, down from 1,023 billion in 2009 – but more than the number of malnourished people in 1990 (around 815 million).
..")
9
Target Indicators: 1A. Proportion of population below $1.25 per day, poverty gap ratio, share of poorest quintile in national consumption 1B. Growth rate of GDP per person employed, employment-to-population ratio, proportion of employed people living below $1.25 (PPP) per day, proportion of own-account and contributing family workers in total employment 1C. Prevalence (widespread) of underweight children under five years of age, proportion of population below minimum level of dietary energy consumption
 per day, proportion of own-account and contributing family workers in total employment 1C. Prevalence (widespread) of underweight children under five years of age, proportion of population below minimum level of dietary energy consumption.")
10
Sub-Saharan Africa and Southern Asia still have not met the goal, and poverty remains widespread. China has achieved the largest decrease of 48% in extreme poverty due to its sustained high growth and social assistance systems. Latin America & Caribbean successfully reached the goal in 2010, reducing their percentage to the lowest of all regions: 6%. South-Eastern Asia surpassed the goal in 2005.

11
Countries, both developed and developing, are unable to create sufficient, meaningful employment to absorb the large working-age populations, leading to a lag in the employment sector. The International Labor Organization is warning of a "scarred generation" due to the lack of job prospects for youth despite high levels of education worldwide that they receive, resulting in social unrest and uprisings all over the world including the Arabic Spring which found it's largest supporters in younger generations. The economic crisis led to an increase of 10.2 million unemployed youth in 2009. Youth unemployment was already rising before the crisis, especially in South-East Asia and pacific as seen on the graph. Numbers are starting to decrease again as the economy slowly recovers from the crisis.

12
Eastern Asia has experienced the largest relative decrease in the prevalence of underweight children among all regions since 1990, followed by Caucasus and Central Asia, Latin America and the Caribbean and Western Asia. While Southern Asia had the highest underweight prevalence in 2012, it has also experienced the largest absolute decrease since 1990 and has contributed significantly to the decreased global burden over the same time period. Sub-Saharan Africa, despite a modest reduction in the prevalence of underweight children since 1990, was the only region where the number of undernourished children increased, from an estimated 27 million to 32 million, between 1990 and 2012. Oceania has demonstrated the least progress of all regions.

13
Where Will We Not Meet the Goal Next Year? 1A. Sub-Saharan Africa is not expected to meet this target. 1B. Sub-Saharan Africa and Southern Asia are not expected to meet this target by 2015. 1C. Sub-Saharan Africa, Western Asia, Southern Asia and Oceania are not expected to meet this target.

14
External Factors That Have Hampered Progress Monitoring the progress of poverty reduction has been a difficult task, due to the lack of good quality data taken at steady intervals. This is especially problematic in Sub-Saharan Africa where the tools needed to collect a full set of data on MDGs are available in less than half of the countries in that area. Most of the working poor live in rural areas where it is hard to promote decent working conditions and salaries, and sustainable livelihoods. Labor legislation is poor and many are subsistence farmers: one of the most vulnerable forms of employment. It is hard to integrate new systems within local systems and to overcome historical and cultural barriers. The poor ability for institutions to efficiently provide services and implement policies (e.g. inform/train people, generate employment etc.). Lack of focus on vulnerable populations: Poorer children, especially those living in rural areas, are the most at risk of malnutrition, with South Asia as having no meaningful improvement among children in the poorest households between 1995 and 2009. Their wealthy counterparts level of malnutrition, on the other hand, decreased by one third, with no prevalence between boys or girls.
. Lack of focus on vulnerable populations: Poorer children, especially those living in rural areas, are the most at risk of malnutrition, with South Asia as having no meaningful improvement among children in the poorest households between 1995 and Their wealthy counterparts level of malnutrition, on the other hand, decreased by one third, with no prevalence between boys or girls..")
15
Factors Cont. Despite reductions in extreme poverty, the economic crisis mixed with rising food prices will result in many regions not meeting the hunger-reduction target. This has slowed and reversed the growth in many low and middle-income countries. Global GDP growth fell from 3.8% in 2007 to -2.2% in 2009. This led to a major decrease in availability of jobs, quality of jobs, increase in women in vulnerable employment, and population undernourished and in poverty.

16
Solutions Nutrition is necessary, and needs to be given a higher priority by nations to reach MDG1. The solutions are affordable and easily implemented, and hold long lasting (sustainable) impacts. Improved maternal nutrition, care to ensure heavier birth weight and breast feeding for the first six months of life, food vouchers (safety nets), and school meals are some examples. Systems must be beneficial and understanding of the local culture. For example, subsidies for small scale farmers, empowerment of women and the creation of business opportunities which work with the needs of the people. Employment-intensive initiatives, and small/medium enterprise promotion have been successful and need further promotion. There are also employment guarantee schemes and cash transfers.
 impacts. Improved maternal nutrition, care to ensure heavier birth weight and breast feeding for the first six months of life, food vouchers (safety nets), and school meals are some examples. Systems must be beneficial and understanding of the local culture. For example, subsidies for small scale farmers, empowerment of women and the creation of business opportunities which work with the needs of the people. Employment-intensive initiatives, and small/medium enterprise promotion have been successful and need further promotion. There are also employment guarantee schemes and cash transfers..")
17
Solution Examples: The United Nations Development Programme is supporting the “National Rural Employment Guarantee Scheme”. The scheme guarantees a minimum of 100 days of paid work per year for landless laborers and marginal farmers in India. So far, 46 million households have been improved by the program, with half of the benefactors being women. The Argentinian government implemented an employment program “Jefes Y Jefas de Hogar” that employed 2 million workers in its first year. This program was a major contributor to Argentina’s rapid poverty reduction from 9.9% in 2002 to 4.5% in 2005.

18
Bibliography "Millennium Development Goals 1-4." Royal Geographical Society. N.p., n.d. Web. 30 Nov. 2014.. "Eradicate Extreme Poverty and Hunger." UNDP. N.p., 2014. Web. 30 Nov. 2014.. "Millennium Development Goals." The World Bank. N.p., 2014. Web. 29 Nov. 2014.. "United Nations Millennium Development Goals." UN News Center. UN, n.d. Web. 28 Nov. 2014.. "Millennium Development Goal #1." WFUNA. N.p., n.d. Web. 30 Nov. 2014.. "Goal 1." The Millennium Development Goals Report 2014 (n.d.): 8-15. United Nations. 2014. Web. 30 Nov. 2014.. Thematic Paper on MDG 1. Wellington: NZ Transport Agency, 2010. United Nations. Web. 30 Nov. 2014.. "Eradicate Extreme Hunger and Poverty." UNDP. N.p., n.d. Web. 28 Nov. 2014..
: United Nations Web. 30 Nov Thematic Paper on MDG 1. Wellington: NZ Transport Agency, United Nations. Web. 30 Nov Eradicate Extreme Hunger and Poverty. UNDP. N.p., n.d. Web. 28 Nov")
19
Ensure that, by 2015, children everywhere, boys and girls alike, will be able to complete a full course of primary schooling

20
Overview To facilitate access to primary education for all children To reduce dropout rates To improve quality of student performance and learning outcomes To strengthen planning and management capacities at all levels of the education system To terminate gender inequality in school enrolment

21
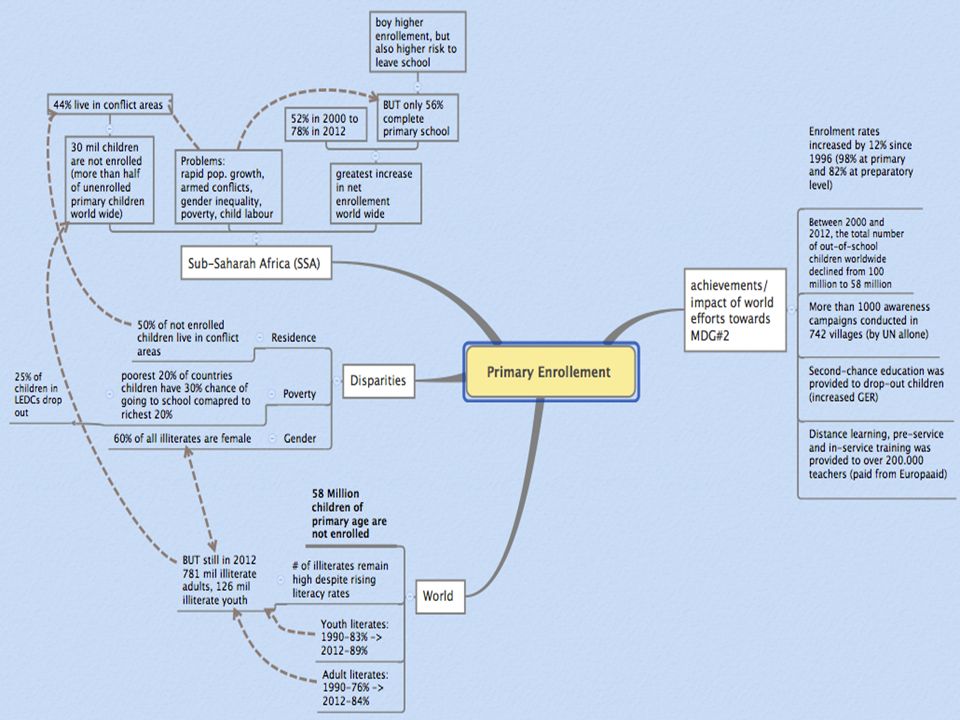
Definition of key words Primary education: to be capable of functioning well on a daily basis in their surrounding environment. – Requires both enrolment and completion – Same as simple literacy Enrolment: students who are signed up for school (problem: this does not include attendants, many “students” sign up but don’t go to school, it also doesn’t include completion of primary education) Completion: to have achieved primary education for their region (usually around 5 years) Preparatory school : in our society, “prep”-schools prepare for college, in LEDCs and NICs Prep schools are where you learn how to live your life in your environment (agricultural, etc.)
 Completion: to have achieved primary education for their region (usually around 5 years) Preparatory school : in our society, prep -schools prepare for college, in LEDCs and NICs Prep schools are where you learn how to live your life in your environment (agricultural, etc.).")
23
This graph confirms the overall trend: Sub-Saharan countries and Oceania don‘t have high youth literacy rates, whereas the rest of the world will reach MDG 2. Countries such as India have had an enormous push in education, thus have increased their literacy. Also, India has had an large economical boost, increasing GNP, increasing funds available for education. Mali and Chad have the worst youth literacy rates in the world. They belong to the Sub-Saharan region, which overall is struggling with MDG 2. These countries have great issues with conflicts, civil wars, HIV/AIDS and drought. Families are very poor and self-sufficient, leaving no money to pay for schooling or for the basics required (school uniform, books, paper). Also, their governments are corrupt and unstable, which leads to problems for the organizations trying to help. Pakistan and Afghanistan have very low literacy rates, which is also a result of major conflicts. The countries within the Oceania region also have bad literacy rates and will not be meeting MDG 2 by 2015. Here there are many natural hazards, many separated tribes and diseases. This leads to children not going to school, or dropping out at early stages.
. Also, their governments are corrupt and unstable, which leads to problems for the organizations trying to help. Pakistan and Afghanistan have very low literacy rates, which is also a result of major conflicts. The countries within the Oceania region also have bad literacy rates and will not be meeting MDG 2 by Here there are many natural hazards, many separated tribes and diseases. This leads to children not going to school, or dropping out at early stages..")
24
External factors that have hampered progress Increasing number of children in poor areas – The Infrastructure/schools that were built in 2000 are insufficient for the increasing number of children Funding – World wide: despite an overall increase in investments, there is still a large funding gap that is still hindering progress Donors have not met the commitment made in Dakar in 2000 that no country would be left behind due to lack of resources. Financial crisis has led to a decrease of 7% of funding overall Money Dispersion: Aid falls quicker and more rapidly in low-income countries than in middle-income countries – Domestic resources : Governments are encouraged to invest 4-6 percent of GNP and 15-20 percent of public expenditure in education Some countries don‘t follow guidelines – Often due to political and religious views Opportunity cost / Disparity often leads to drop outs – Extreme poverty: parents cannot afford school materials, or can’t help their children meet basic standards such as buying shoes and a school uniform. Also, children would most likely have to work, which takes time away from going to school or studying – Residence: rural vs. urban, conflict area vs. conflict free area, long distance of travelling is one of the main dropout reasons – Cultural Preferences : In some countries such as Afghanistan, women are not as appreciated, they only get a space in school if there are spaces left over after boys enroll. Teachers seem to favor boys and often subconsciously give boys more attention and guidance Educated leave the country: not enough teachers Conflict: in conflict areas children are safer at home than in school, parents fear for their safety, or the family flees no time for school Government Disease: particularly HIV/AIDS and malaria – Sick children cannot go to school, also these diseases are often misinterpreted as signs of the devil or parents don’t have the financial means children are not cured properly and not sent to school so they don’t infect others.

25
Will we meet the goal next year?- where? Where not? Yes: (all above 94% in 2014) : Western Asia Latin American and Caribbean South-Eastern Asia Caucasus and Central Asia Eastern Asia Northern Africa NO: Sub-Saharan Africa Extreme poverty (MDG1 not met) Not enough schools Not enough funding Conflict Lack of teachers Gender inequality Very rural hard for organizations to get to Not in any large wealthy community (e.g. UN, EU, etc.) Oceania Natural hazards Island nations hard for organizations to get to ““ as above It will be met in most of the world, which is a great success. However, not in 2 world regions.
 : Western Asia Latin American and Caribbean South-Eastern Asia Caucasus and Central Asia Eastern Asia Northern Africa NO: Sub-Saharan Africa Extreme poverty (MDG1 not met) Not enough schools Not enough funding Conflict Lack of teachers Gender inequality Very rural hard for organizations to get to Not in any large wealthy community (e.g. UN, EU, etc.) Oceania Natural hazards Island nations hard for organizations to get to as above It will be met in most of the world, which is a great success. However, not in 2 world regions..")
26
Sources http://www.unesco.org/new/en/education/th emes/leading-the-international- agenda/education-for-all/funding/ http://www.unesco.org/new/en/education/th emes/leading-the-international- agenda/education-for-all/funding/ http://ec.europa.eu/europeaid/documents/ca se-studies/egypt_eep_en.pdf http://ec.europa.eu/europeaid/documents/ca se-studies/egypt_eep_en.pdf http://data.worldbank.org/indicator/SE.ADT.1 524.LT.ZS/countries/1W?display=map http://data.worldbank.org/indicator/SE.ADT.1 524.LT.ZS/countries/1W?display=map

27
Promote Gender Equality and Empower Women

28
Millennium Development Goal 3 Promote Gender Equality and Empower Women (Global agreement on this goal shows positive development, it proves that states have recognized the importance of gender equality and that the progress of the other goals depends on it.) Target 3A: To eliminate gender disparity in primary and secondary education (preferably by 2005) and in all levels of education by 2015. Indicators: 3.1 Ratios of girls to boys in primary, secondary and tertiary education 3.2 Share of women in wage employment in the non-agricultural sector 3.3 Proportion of seats held by women in national parliament Although significant changes have been made in the past 14 years, globally we are far of reaching MDG 3. Global primary education is on the right track and could be reached in the next few years. However incentives to promote secondary and tertiary education have not been successful enough and have to be strengthened to increase the number of girls and boys engaging in these levels of education.

29
Definitions: Gender Disparity: the unequal treatment or perceptions of individuals based on their gender. (Where males and females don’t have the same rights and opportunities.) It happens because of socially/culturally constructed gender roles and stereotyping. Gender Equality: the state in which access to rights or opportunities is unaffected by gender. Women Empowerment: to give women equal rights and freedom to men. To do this women should have- decision-making power of their own access to education to take calculated decisions access to information and resources for taking proper decision a range of options from which they can make choices (further education, travelling, children?) and not being forced into one of these Literate: the ability to read and write (level at primary education) Wage Employment: When the payment is calculated as a fixed amount for each task completed (a task wage or piece rate), or at an hourly or daily rate. Primary education: to be capable of functioning well on a daily basis in their surrounding environment. Requires both enrolment and completion.
 It happens because of socially/culturally constructed gender roles and stereotyping. Gender Equality: the state in which access to rights or opportunities is unaffected by gender. Women Empowerment: to give women equal rights and freedom to men. To do this women should have- decision-making power of their own access to education to take calculated decisions access to information and resources for taking proper decision a range of options from which they can make choices (further education, travelling, children ) and not being forced into one of these Literate: the ability to read and write (level at primary education) Wage Employment: When the payment is calculated as a fixed amount for each task completed (a task wage or piece rate), or at an hourly or daily rate. Primary education: to be capable of functioning well on a daily basis in their surrounding environment. Requires both enrolment and completion..")
30
Facts to remember In Southern Asia, only 74 girls were enrolled in primary school for every 100 boys in 1990. By 2012, the enrolment ratios were the same for girls as for boys. In sub-Saharan Africa, Oceania and Western Asia, girls still face barriers to entering both primary and secondary school. Women in Northern Africa hold less than one in five paid jobs in the non-agricultural sector. Two thirds of the illiterate population is women. Globally in 2010, women make up 18.6 percent of parliamentarians, (30 percent was envisaged) this represents an increase of seven percent since 1995. Between 1975 and 1995, it rose by less than one per cent. -> Example: Germany is 21 st on the world classification list of women in the national parliament. They have 27.5% of women in their high house or senate, although this number is not extremely high it is still acceptable. However looking at the percentage of women in leading positions of larger companies, Germany is doing terrible. Currently the largest 200 companies only have 4.4% women on their Executive board, To change this in November 2014, Germany took a big step in the direction of reaching more gender equality. They passed a new law. As of 2016 30% of board members in the 100 largest companies listed on the stock exchange, have to be women.
 this represents an increase of seven percent since Between 1975 and 1995, it rose by less than one per cent. -> Example: Germany is 21 st on the world classification list of women in the national parliament. They have 27.5% of women in their high house or senate, although this number is not extremely high it is still acceptable. However looking at the percentage of women in leading positions of larger companies, Germany is doing terrible. Currently the largest 200 companies only have 4.4% women on their Executive board, To change this in November 2014, Germany took a big step in the direction of reaching more gender equality. They passed a new law. As of % of board members in the 100 largest companies listed on the stock exchange, have to be women..")
31
Worldwide Progress for Target 3A Goal 3 Global 1. Sub - Saharan Africa 2. North Africa 3. South Asia 4. Central Asia 5. East Asia 6. West Asia 7. Latin America 8. Caribbean 9. Oceania Target 3A: To eliminate gender disparity in primary and secondary education (preferably by 2005) and in all levels of education by 2015. Gender parity nearly reached in primary level. Only 2 countries worldwide have reached it for all three levels. Not reached at any level, however close in primary education. In primary and secondary level not reached. In tertiary, more girls enrolled than boys. Gender parity reached in primary education. In secondary and tertiary there is a higher % of boys that go. Gender parity reached in primary and secondary. In tertiary more girls are enrolled. Girls have a greater access to primary education. In tertiary there are more girls enrolled. Gender parity not reached at any level. Gender parity in primary. More women enrolled in tertiary. More women than men in tertiary education. The map shows the ratio of girls to boys in primary education. The color darkens towards the middle of the map, showing where ratios are lowest meaning less gender equality. Sub Saharan Africa and west/east African countries as well as the south-west of Asia show the lowest ratios = the most inequality.
 and in all levels of education by Gender parity nearly reached in primary level. Only 2 countries worldwide have reached it for all three levels. Not reached at any level, however close in primary education. In primary and secondary level not reached. In tertiary, more girls enrolled than boys. Gender parity reached in primary education. In secondary and tertiary there is a higher % of boys that go. Gender parity reached in primary and secondary. In tertiary more girls are enrolled. Girls have a greater access to primary education. In tertiary there are more girls enrolled. Gender parity not reached at any level. Gender parity in primary. More women enrolled in tertiary. More women than men in tertiary education. The map shows the ratio of girls to boys in primary education. The color darkens towards the middle of the map, showing where ratios are lowest meaning less gender equality. Sub Saharan Africa and west/east African countries as well as the south-west of Asia show the lowest ratios = the most inequality..")
32
Progress of the individual Indicators: 3.2 Share of women in wage employment in the non-agricultural sector: Women’s share increased globally from 35 per cent in 1990 to 40 per cent in 2012, with increases, although unequal, observed in almost all regions. Northern Africa has not had any change and stayed lowest out of all regions at only 19%. That is less than a ¼ of the workforce who are women. Generally women’s participation in the labor market lags behind men, regardless of education and skills, as even the developed regions have not yet reached gender parity. This could be due to the fact that women stay at home to look after their children. -> In Sweden fathers have to look after their baby for at least 80 days, this gives women better chances of finding jobs and also increases the chances of the dad choosing to be the one looking after the baby permanently. In Latin America and the Caribbean, percentages could rise quickly in the next generation as the adults (often women) who have gone back to school will have finished their education and start work.
 who have gone back to school will have finished their education and start work..")
33
3.3 Proportion of seats held by women in national parliament: As can be seen on the graph there has been extreme change in % of seats held by women in national parliament. Since 2000 percentages have more than doubled in north Africa and central Asia, and increased immensely in all other regions except in Oceania where they decreased. However the numbers are still low and nowhere near equality (50%). Furthermore the graph only shows a generalization – some countries in these regions have much lower percentages which are covered up by surrounding countries with higher values. Namely, Oman who is considered as part of the North Africa region but only has 1% of seats in the parliament taken by women, compared to the 24% average shown above. Setting quotas has been seen to be one of the only effective ways to increase women’s share in politics. -> Rwanda’s parliament has more than 50% of women. They were only able to accomplish this by introducing a quota requiring 30% of political and government candidates to be women. Once there were more women in the parliament, boys and girls attended compulsory primary and secondary school in equal numbers, and new laws that enable women to own and inherit property were introduced. % Proportion of seats held by women in single or lower houses of national parliament, 2000 and 2014
. Furthermore the graph only shows a generalization – some countries in these regions have much lower percentages which are covered up by surrounding countries with higher values. Namely, Oman who is considered as part of the North Africa region but only has 1% of seats in the parliament taken by women, compared to the 24% average shown above. Setting quotas has been seen to be one of the only effective ways to increase women’s share in politics. -> Rwanda’s parliament has more than 50% of women. They were only able to accomplish this by introducing a quota requiring 30% of political and government candidates to be women. Once there were more women in the parliament, boys and girls attended compulsory primary and secondary school in equal numbers, and new laws that enable women to own and inherit property were introduced. % Proportion of seats held by women in single or lower houses of national parliament, 2000 and")
34
External factors that have hampered progress Disease - HIV & AIDS: when parents fall ill with disease it is usually the girls that are taken out of school to help look after the parents. Conflicts: in times of conflict women are often left on their own to deal with caring for the whole family, while the male is away fighting. Furthermore acts of sexual violence are used for intimidation. Women and girls are recruited, coerced or kidnapped to fight or to support armed groups. Violence: In some regions, particularly Africa, parents are scared to send their children to school because getting there is to dangerous. So often parents will decide to keep the girls at home in fright that something could happen to them. -> In Ethiopia, girls are abducted on their way to school, raped and then married to their captors. Global Crisis: has lead to a decrease in industry and trade which followed higher unemployment rates in many countries. Poor households are more readily affected by this and are forced to adopt coping methods e.g. eating less or not making use of medical treatment when needed. This ultimately means that even if education is free the child can not concentrate in lessons and will not learn as much as the other students. Environmental change (global warming): increased drought and soil contamination, force women to walk longer distances in search for water and fuel, this means that there is less time to do other things such as studying. Natural disasters recur more often and women die in larger numbers than men. Moreover women who survive are left with the burden of looking after injured or sick family members. -> As a result of the earthquake and tsunami in Japan (March 2011) 8,363 females died compared to 7,360 males. Especially in the oldest age group 70+ there was a considerable difference where females outnumbered males by nearly 1000 deaths. (2091 females vs. 1290 males) This is due to women less frequently having access to correct sanitation, sufficient food & water, medicine and infrastructure.
: increased drought and soil contamination, force women to walk longer distances in search for water and fuel, this means that there is less time to do other things such as studying. Natural disasters recur more often and women die in larger numbers than men. Moreover women who survive are left with the burden of looking after injured or sick family members. -> As a result of the earthquake and tsunami in Japan (March 2011) 8,363 females died compared to 7,360 males. Especially in the oldest age group 70+ there was a considerable difference where females outnumbered males by nearly 1000 deaths. (2091 females vs males) This is due to women less frequently having access to correct sanitation, sufficient food & water, medicine and infrastructure..")
35
Are we reaching the goal or not? GOAL 3 Promote Gender Equality and empower women AfricaAsia Latin America and the Caribbean Caucasu s and Central Asia Northern Sub - Saharan Eastern South- Eastern SouthernWesternOceania Equal girls enrolment in primary school Women’s share of paid employme nt Women’s equal representa tion on in national parliament

36
MDG 4 - 2014 Julia Rautenberg

37
The Goal: Reduce under-five mortality rate by two-thirds

38
Overview 1. Worldwide child mortality rate has declined 2012: average child mortality rate almost half of its 1990 rate (decreased from 90 to 48 deaths per 1000 live births) 2. Indicators of success: Under five mortality rate Infant mortality rate Proportion of 1 year-old children vaccinated against measles 3. Meeting the target All regions except sub-Saharan Africa and Oceania have more than halved their child mortality rate
 2. Indicators of success: Under five mortality rate Infant mortality rate Proportion of 1 year-old children vaccinated against measles 3. Meeting the target All regions except sub-Saharan Africa and Oceania have more than halved their child mortality rate.")
39
Definitions of key words Reduce:make smaller or less in amount, degree, or size Child mortality: the death of infants and children under the age of five

40
Facts to remember Child mortality has been decreasing for over 50 years The most child deaths occur in the poorest regions and during the first few months of the child’s life Progress in decreasing the child mortality rate has been uneven Out of 5 child deaths, 4/5 occur in sub-Saharan Africa and Southern Asia A great percentage of child deaths occur in children that are undernourished Between 2000 and 2012 vaccinations against measles helped prevent nearly 14 million infant/child (age 0-5) deaths (significant progress has occurred in Africa
 deaths (significant progress has occurred in Africa")
41
Graphic 1 Taken from the UN Millennium Development Goals report 2014 Highest rate present in Sub-Saharan Africa 98 deaths per 1000 live births (2014) Lowest rate present in developed regions (MEDCs): 6 deaths per 1000 live births (2014) Developing regions (NIC): 53 deaths per 1000 live births (2014) Light blue, beige: 1990 Dark blue, orange: 2014
 Lowest rate present in developed regions (MEDCs): 6 deaths per 1000 live births (2014) Developing regions (NIC): 53 deaths per 1000 live births (2014) Light blue, beige: 1990 Dark blue, orange: 2014")
42
Graphic 2 42 Taken from the UN Millennium Development Goals report 2014 Shows that low income countries have a higher rate of child mortality 82 deaths per 1000 live births (2014) High income countries (developed countries) have low rate of child mortality Income level is a factor of child mortality
 High income countries (developed countries) have low rate of child mortality Income level is a factor of child mortality")
43
Sub targets & their successes and failures 1.Target 4.A: Reduce by two thirds, between 1990 and 2015, the under-five mortality rate 2.Countries achieving the sub-target: 1990: 53 countries had child mortality rate of 20 or lower deaths for 1000 births 36 out of 53 countries had halved their child mortality rate by 2012 11 out of 53 countries had reduced their child mortality by two thirds 3.Inequities in child mortality Used to be great difference in child mortality rate between high and low income countries 2013: child mortality rate in low income countries was 76 deaths per 1000 live births (≈ 13x average rate in high-income countries which is 6 deaths per 1000 live births) Disparities in households have decreased (exception: Sub-Saharan Africa) 4.Regions where the sub-target will not be met: Oceania Sub-Saharan Africa Caucasus Central and Southern Asia
 Disparities in households have decreased (exception: Sub-Saharan Africa) 4.Regions where the sub-target will not be met: Oceania Sub-Saharan Africa Caucasus Central and Southern Asia")
44
External factors that have hampered progress 1.Demographic factors First-born (a child’s position in the order of the family can affect the mortality rate) Teen pregnancies Children born to women over the age of 35 2.Nutritional factors Malnourishment (a lot of children are born underweight and aren’t taken care of) Median duration of breastfeeding 3.Child and maternal health factors Parental medical care (specifically maternal health care) Vaccinations (especially measles) Diseases (e.g. diarrhoea etc.) 4.Environmental factors Sanitation (e.g. piped water supply, clean drinking water, sewage system) 5.Socioeconomic factors Residence (urban or rural area) Electricity supply within household Availability of education (children get meals at school)
 4.Environmental factors Sanitation (e.g. piped water supply, clean drinking water, sewage system) 5.Socioeconomic factors Residence (urban or rural area) Electricity supply within household Availability of education (children get meals at school).")
45
Will we meet the goal next year?- where? Where not? 1.Global annual reduction rate: accelerated from 1.2% (1990-1995) to 3.9% (2005-2012) 2.Areas falling short of the 2015 target Oceania Sub-Saharan Africa Highest rate of child mortality (90 deaths per 1000 live births) 11 out of the 12 countries that have a child mortality rate above 100 deaths per 1000 live births are located in the African region Caucasus Central and Southern Asia More than halved child mortality rate 1 out of 3 child deaths occur in these regions India had highest child mortality rate worldwide with 1.4 million child deaths in 2012 3.Predicted: At current rate, MDG 4 will be achieved in 2028
 to 3.9% ( ) 2.Areas falling short of the 2015 target Oceania Sub-Saharan Africa Highest rate of child mortality (90 deaths per 1000 live births) 11 out of the 12 countries that have a child mortality rate above 100 deaths per 1000 live births are located in the African region Caucasus Central and Southern Asia More than halved child mortality rate 1 out of 3 child deaths occur in these regions India had highest child mortality rate worldwide with 1.4 million child deaths in Predicted: At current rate, MDG 4 will be achieved in")
46
References O. Rutstein, Shea. "Factors Associated with Trends in Infant and Child Mortality in Developing Countries during the1990s." World Health Organization. World Health Organization, 1 Jan. 2000. Web. 1 Dec. 2014. "Child Mortality, Target: Reduce Under-five Mortality Rate by Two-thirds." Millennium Development Goals 1-4. Global Learning Programme, 1 Jan. 2014. Web. 1 Dec. 2014. "Goal 4 Reduce Child Mortality." The Millennium Development Goals Report 2014. United Nations, 1 Jan. 2014. Web. 1 Dec. 2014. "Under-five Mortality." Global Health Observatory - Under-five Mortality, World Health Organization. World Health Organization, 1 Jan. 2014. Web. 1 Dec. 2014. 46

47
MDGs- 2014 MDG #5

48
Improve Maternal Health

49
Definition of Key Words Maternal health- Refers to the health of a woman during pregnancy, child birth and post- childbirth period. Takes into account health care dimensions of family planning, preconception, prenatal and postnatal care Maternal mortality ratio- Usually expressed per 100,000 births Defined as the number of women who die during pregnancy or within 42 days after pregnancy It is an estimate (uses information of fertility, HIV prevalence, and birth attendants) Antenatal care- Also called prenatal care Refers to the care of the woman and unborn baby during pregnancy
 Antenatal care- Also called prenatal care Refers to the care of the woman and unborn baby during pregnancy.")
50
Goal Overview The goal has two parts- 5A and 5B Goal 5A looks at decreasing mortality ratio Goal 5B looks at universal access to maternal health Overall aims: Improve maternal health during and after pregnancy as well as during child birth Aims to decrease the risk of dying during pregnancy as well as decrease unwanted pregnancies and unsafe abortions Various indicators used (further explained in next few slides)
")
51
General Facts Only half of women in developing countries receive recommended healthcare during pregnancy. Maternal mortality ratio is still 14 times higher in developing regions (compared to developed regions) Maternal mortality is higher in rural areas Everyday, approximately 800 women die from causes related to pregnancy and childbirth In Sub Saharan Africa, contraception use has doubled in women from 15 to 49 (from 13% to 26%). This is still however a very low number. Maternal mortality ratio has decreased 45% since 1990 (from 380 to 210 deaths per 100 000 births) In Eastern Asia, Northern Africa and Southern Asia, the maternal mortality ratio has decreased by two thirds More women are receiving antenatal care (increased from 63% to 82% in developing regions) Percentage of deliveries attended by skilled personnel increased from 56% to 68% in developing regions. Annual decline of 5.5% per year in maternal mortality ratio is needed to achieve goal but in 2013 there was only a decline of 2.3%
 Maternal mortality is higher in rural areas Everyday, approximately 800 women die from causes related to pregnancy and childbirth In Sub Saharan Africa, contraception use has doubled in women from 15 to 49 (from 13% to 26%). This is still however a very low number. Maternal mortality ratio has decreased 45% since 1990 (from 380 to 210 deaths per births) In Eastern Asia, Northern Africa and Southern Asia, the maternal mortality ratio has decreased by two thirds More women are receiving antenatal care (increased from 63% to 82% in developing regions) Percentage of deliveries attended by skilled personnel increased from 56% to 68% in developing regions. Annual decline of 5.5% per year in maternal mortality ratio is needed to achieve goal but in 2013 there was only a decline of 2.3%.")
52
Facts to remember Determinants of Maternal health include- Poverty/access to healthcare Risk of maternal death in sub Saharan Africa is 175 bigger than in developed countries because of lack of access to healthcare HIV/AIDS those who don’t receive treatment have a 25% chance of passing the virus to their child, those who are treated have a 98% chance that it will not become infected. Maternal Weight Oral health bad oral health = gateway for bacteria Education if they are not educated, they will not seek help when something is wrong because they wont know something is wrong. Women will also not know how to take care of themselves during pregnancy to make sure it goes well if they are not educated. Major complications during/after pregnancy that cause women to die: severe bleeding (mostly bleeding after childbirth) infections (usually after childbirth) high blood pressure during pregnancy complications from delivery unsafe abortion.
 infections (usually after childbirth) high blood pressure during pregnancy complications from delivery unsafe abortion..")
53
There is an overall decrease in maternal mortality between 1990 and 2010 in all regions and the world as an average (WA decreases from 400 to 210) The regions that have decreased the most are Africa (from 810 to 490) and South East Asia (from 590 to 200) Regions above WA= Developing vs. Regions below WA = Developed South- East Asia is the only region that starts above WA and is now below WA Africa and South East Asia= massive decrease because they are least developed have the worst poverty and education and therefore highest Maternal Mortality Ratio see a decrease because with help of MEDCs and NGOs the sanitation and access to health care increases. Western Pacific and Americas= relatively low because good health care and education. See a decrease because of increase in access to health care but not massive because they were low to begin with. Not as low as Europe because areas in these regions do not have as good of a health care and are not MEDCs but NICs Europe = lowest because more developed and more money = contraception, health care facilities, education etc.

54
Sub Targets- Goal 5A Goal 5A states: “ Reduce by three quarters, between 1990 and 2015, the maternal mortality ratio” Indicators: Maternal mortality ratio Proportion of deliveries attended by skilled personnel Improvement, but much more still needs to be done Global mortality ratio still at 210 (45% decrease from 1990) Developing regions are lagging behind (eg- Sierra Leone = mortality ratio of 1,1000 per 100 000 births) Most maternal deaths are preventable access to antenatal health care is needed and skilled doctors need to be present when baby is delivered. Despite improvements, gap between rural and urban areas is massive- Urban- rural gap in the percentage of births attended by skilled health personnel decreased only from 33% to 30% from 2000 to 2012 32 out of 40 million births not attended by skilled staff happened in rural areas

55
Sub Targets: Goal 5B Goal 5B states: “ Achieve, by 2015, universal access to reproductive health” Indicators: Unmet need for family planning Adolescent birth rate Antenatal care Contraceptive prevalence rate There has been improvement but still not close to reaching goal. In developing regions- % of woman who attended doctor at least once during pregnancy has increased from 65% (1990) to 83% (2012) BUT only 52% attend the recommended amount of 4 times This is still an increase from 37% in 1990 Pregnancy in teens has decreased in developing regions Decreased in all regions but remains high in Sub Saharan Africa (117 births per 1000 girls) and Latin America and Caribbean (76 births per 1000 girls) Contraceptive use has increased but there is still un-met need of family planning (25% of women in sub Saharan Africa between ages 15-49 reported they wanted to avoid or delay pregnancy)
 to 83% (2012) BUT only 52% attend the recommended amount of 4 times This is still an increase from 37% in 1990 Pregnancy in teens has decreased in developing regions Decreased in all regions but remains high in Sub Saharan Africa (117 births per 1000 girls) and Latin America and Caribbean (76 births per 1000 girls) Contraceptive use has increased but there is still un-met need of family planning (25% of women in sub Saharan Africa between ages reported they wanted to avoid or delay pregnancy).")
56
External factors that have hampered progress In order to decrease maternal mortality ratio + increase access to reproductive health you need: Doctors Hospitals Money to build facilities and train doctors Money to advertise/subsidise contraception etc. Poverty No education = no doctors, increase in teen birth rate, women don’t know what to do during pregnancy Unstable or corrupt governments Leads to no money Means they cannot subsidise contraception etc. Also no money for hospitals They do not control the country decrease quality of life because increased crime rates etc, decrease in education etc. Lack of funding If governments have no money, you need funding. No funding = no facilities, no money etc.

57
Will we meet the goal 5A next year? I do not think the goal 5A will be met next year. Annual decline of 5.5% per year in maternal mortality ratio is needed to achieve goal but in 2013 there was only a decline of 2.3% Although there has been an increase, it has not been sufficient to achieve the goal. Massive and rapid improvements would have to be done. Regions that will definately not reach goal: Sub- Saharan Africa, Southern Asia, Caribbean and Oceania. Regions that could possibly reach the goal: Eastern Asia, Caucasus and Central Asia. The world as an average will not reach goal 5A

58
Will we meet goal 5B next year? I do not think that goal 5B will be reached There is still 40 million women giving birth without skilled staff: indicates that reproductive health care is not accesible everywhere. Sub Saharan Africa and Southern Asia only have 53% of babies attended by skilled doctors. Only 36% of women in S. Asia and 50% in Sub Saharan Africa attend doctors during pregnancy 4 times or more. There is unmet need for family planning in all regions (4% lowest region= Eastern Asia, 25.1% highest region= Sub Saharan Africa) Although there has been an increase, it is obvious that reproductive healthcare is not accesible everywhere and will not be by next year. Regions that might achieve goal= Eastern Asia
 Although there has been an increase, it is obvious that reproductive healthcare is not accesible everywhere and will not be by next year. Regions that might achieve goal= Eastern Asia.")
59
MDG

60
Overview from your goal Targets: -6.A Have halted & begun to reverse the spread of HIV/AIDS by 2015 -6.B By 2010, achieve universal access to treatment for HIV/AIDS for all those who need it -6.C have halted and begun to reverse the incidence of malaria and other major disease by 2015

61
Facts to remember 2.5 million people are newly infected with HIV every year 320,000 children died from AIDS-related causes in 2005 compared to 210,000 in 2012 Antiretroviral medicines to treat HIV were delivered to 9.5 million people in developed regions, 2012 2000-2012, expansion of malaria interventions 42% decline in malaria mortality rates globally Antiretroviral medicines- are medication for the treatment of retroviruses (AIDS)
")
62
-Most regions-decline in HIV -Some anomalies

63
Explanations of trends Reason-decline-most regions: >AID from UN, advances in sanitary conditions, restrict spread of HIV Reason for anomalies >advances are not equally shared between all countries or within a country >therefore some regions which are less sanitary, greater risk for spread of HIV e.g. needles fro injected drugs being shared

64
External factors that have hampered progress impactful set back: Mass quantity of individuals-risky behaviour (sexual)- insufficient knowledge to know better-spread HIV (Little comprehensive knowledge about HIV has caused many in some regions to hamper progress) e.g. Sub-Sahara Africa, where only 39% young males & 28% young females had the comprehensive knowledge.

65
Will we meet the goal next year?- where? Where not? 6.A - significant amount of new HIV infections, Infections per 100 (adults) declining although we still have 2.3 million people newly effected 6.B - financial AID allowed close to universal access to treatment, saved 6.6 million lives since 1995 If momentum continues – on the right track 6.C – in the past decade, 3 million lived saved, simply on the right track
 declining although we still have 2.3 million people newly effected 6.B - financial AID allowed close to universal access to treatment, saved 6.6 million lives since 1995 If momentum continues – on the right track 6.C – in the past decade, 3 million lived saved, simply on the right track.")
66
Works Cited “United Nations Millennium Development Goals” UN News Center. UN, n.d. Web 30 Nov. 2014 Report, The Millennium Development Goals. (n.d.): n. pag. The Millennium Development Goals Report 2014. UN. Web.
: n. pag. The Millennium Development Goals Report UN. Web..")
67
Ensure environmental sustainability

68
Overview from your goal Around 884 million people have no access to clean drinking water. 2.6 billion people do not have basic sanitation. Certain species will continue to go extinct due to deforestation and pollution throughout the century 828 million people still live in slums

69
Around 86% of the population in LEDC countries Will have Access to clean water by 2015. Over 17,000 species of plants and animals risk extinction. 200 million slum dwellers have improved access to clean water and basic sanitation.

70
Definition of key words in target (e.g. what is extreme poverty, child mortality etc.) Sanitation- Hygienic means of prevention of human contact with waste and treatment and proper disposal of wastewater and sewage. Slum-dwellers- Someone who lives in a slum, overcrowded part of the city with bad living conditions. Slum in Lagos, Nigeria http://s1.ibtimes.com/sites/www.ib times.com/files/styles/v2_article_la rge/public/2013/09/19/img_1947.j pg?itok=2Y-VYzIn
 Sanitation- Hygienic means of prevention of human contact with waste and treatment and proper disposal of wastewater and sewage. Slum-dwellers- Someone who lives in a slum, overcrowded part of the city with bad living conditions. Slum in Lagos, Nigeria times.com/files/styles/v2_article_la rge/public/2013/09/19/img_1947.j pg itok=2Y-VYzIn.")
71
Facts to remember 2.6 billion have no/limited access to basic sanitation An estimated 828 million people live in slums 2.1 billion people have gained access to proper drinking water since 1990, this has surpassed the target goal. Co2 emissions have increased by 46% since 1990

72
Paste a graphic & explain The majority of the regions have seen a decline in forest area in the past decade due to deforestation but also natural hazards such as forest fires and drought in Australia. Asia gained a lot of forest hectares due to afforestation programs.

73
Name the sub targets (if relevant) & their successes and failures Halve proportion of population without improved drinking water- Goal has been reached earlier then predicted. Halve proportion of population without sanitation- Goal has not been achieved. Improve the lives of slum-dwellers

74
External factors that have hampered progress On going deforestation- The amazon rainforest Lack of resources Financial problems Limited technology Conflicts- On going conflicts such as in Afghanistan Diseases

75
Will we meet the goal next year?- where? Where not? Although several regions will reach all goals by 2015, there still remains a large number of regions that will not achieve them. Oceania is not expected to achieve any of the target goals by 2015. Caucasus central Asia regions Will not achieve all goals by next year.

76
Bibliography "UN Economic and Social Council; Resolutions; Decisions." UN News Center. UN, n.d. Web. 30 Nov. 2014.. "Slum Dweller." The Free Dictionary. Farlex, n.d. Web. 30 Nov. 2014.. Nations, United. "We Can End Poverty." Ensure Environmental Sustainability (n.d.): n. pag. United Nations. Web.. "Millennium Development Goal #7." General. N.p., n.d. Web. 30 Nov. 2014..
: n. pag. United Nations. Web.. Millennium Development Goal #7. General. N.p., n.d. Web. 30 Nov")
77
MDG 8: DEVELOP A GLOBAL PARTNERSHIP FOR DEVELOPMENT

78
Overview from your goal “Develop further an open, rule-based, predictable, non- discriminatory trading and financial system” “Address the special needs of least developed countries” “Address the special needs of landlocked developing countries and small island developing States” “Deal comprehensively with the debt problems of developing countries” “In cooperation with pharmaceutical companies, provide access to affordable essential drugs in developing countries”

79
Definition of key words in target (e.g what is extreme poverty, child mortality etc) “Global Partnership”: This is when two or more countries are in agreement, and will often help each other out. (E.G. The EU could be considered a “Global Partnership” because it consist of 28 different countries which help each other financially and politically.)
.")
80
Facts to remember “Official development assistance hit a record high of $134.8 billion in 2013.” (Money donated to help aid MDG 8) “Resources available for providing essential medicines through some disease-specific global health funds increased in 2011, despite the global economic downturn.” “Two-thirds of the world’s Internet users are in developing regions, where the number of Internet users doubled between 2009 and 2014.” “In Africa, almost 20 per cent of the population are online, up from 10 per cent in 2010.”
 Resources available for providing essential medicines through some disease-specific global health funds increased in 2011, despite the global economic downturn. Two-thirds of the world’s Internet users are in developing regions, where the number of Internet users doubled between 2009 and In Africa, almost 20 per cent of the population are online, up from 10 per cent in")
81
Paste a graphic & explain (LEDC) (MEDC) (NIC) Quantify: As the cost of using the internet decreases, the amount of people who use the internet increases. For example, the cost of the internet in 2003 was about 121% GNI per capita with 2% of the pop. using it. In 2005 the cost was about 61% but now with 5% of the pop. now using the internet. Qualify: The cheaper that the internet becomes in LEDCs, the more accessible it becomes because more people can afford it. One of the goals of MDG 8 is to increase the accessibility of internet in LEDCs and NIC, as it will allow people to be more connected and up to date with the rest of the world.

82
Name the sub targets (if relevant) & their successes and failures Target 8.A: “Develop further an open, rule-based, predictable, non-discriminatory trading and financial system” Aid is shifting away from the poorest countries due to lack of money coming from MEDCs Target 8.B: “Address the special needs of least developed countries” “Net bilateral aid to Africa (where 34 of the 48 least developed countries are located) fell by 5.6 per cent in 2013, to $28.9 billion in real terms.” Target 8.C: “Address the special needs of landlocked developing countries and small island developing States” Aid to landlocked countries has fell, however aid to small island states has increased Target 8.D: “Deal comprehensively with the debt problems of developing countries” The Debt burden has dropped by almost 75% in NICs Target 8.E: “In cooperation with pharmaceutical companies, provide access to affordable essential drugs in developing countries” Funds for providing essential medicine has increased Target 8.F: “In cooperation with the private sector, make available benefits of new technologies, especially information and communications” Internet use has increased in both LEDCs and NICs
 & their successes and failures Target 8.A: Develop further an open, rule-based, predictable, non-discriminatory trading and financial system Aid is shifting away from the poorest countries due to lack of money coming from MEDCs Target 8.B: Address the special needs of least developed countries Net bilateral aid to Africa (where 34 of the 48 least developed countries are located) fell by 5.6 per cent in 2013, to $28.9 billion in real terms. Target 8.C: Address the special needs of landlocked developing countries and small island developing States Aid to landlocked countries has fell, however aid to small island states has increased Target 8.D: Deal comprehensively with the debt problems of developing countries The Debt burden has dropped by almost 75% in NICs Target 8.E: In cooperation with pharmaceutical companies, provide access to affordable essential drugs in developing countries Funds for providing essential medicine has increased Target 8.F: In cooperation with the private sector, make available benefits of new technologies, especially information and communications Internet use has increased in both LEDCs and NICs")
83
External factors that have hampered progress During the economic recession of 2008 funding from MEDCs decreased or stopped completely Today there is still a “Funding Lag” as countries are trying to make-up for the money they did not donate during the economic recession

84
Will we meet the goal next year?- where? Where not? Although there has been substantial progress in most sub-targets not enough progress has been made. Figure 1 shows only Africa and the countries that are on track or not on track for MDG 8. It is obvious that most of the Sub-Saharan countries are either not on track at all, or the progress is too insignificant. I believe this is mostly due to the economic recession that hindered the progress of MDG 8, as it meant that many MEDCs had to reduce their amount of aid and funding to the LEDCs. Figure 1

85
Sources "United Nations Millennium Development Goals." UN News Center. UN, n.d. Web. 30 Nov. 2014.

Similar presentations


 5 TH OCTOBER 2012 BY MAGGIE B.B. PHIRI.>")


>")
. CARICOM BACKGROUNDBACKGROUND ► GOALS AND TARGETS WHICH ARE: TIME- BOUND AND MEASUREABLE BOUND AND MEASUREABLE.>")


