Download presentation
Presentation is loading. Please wait.

1
Speed Key Question: Investigation 4A
Can you predict the speed of the car as it moves down the track?

2
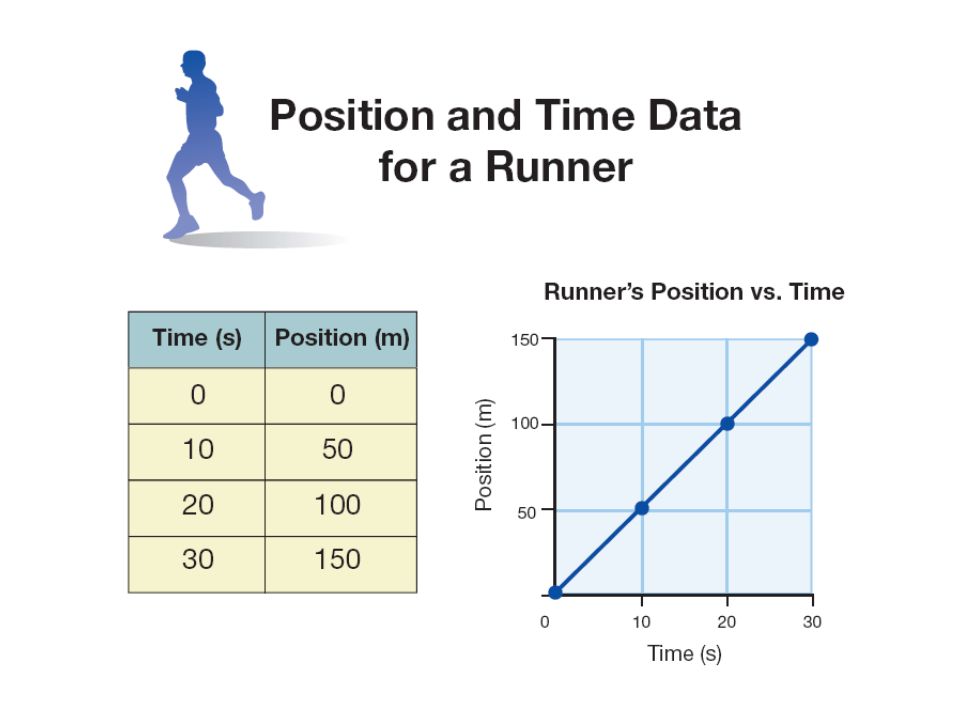
4.2 Graphs of Motion Constant speed means the speed stays the same.
An object moving at a constant speed always creates a position vs. time graph that is a straight line.

3
4.2 Graphs of Motion The data shows the runner took 10 seconds to run each 50-meter segment. Because the time was the same for each segment, you know the speed was the same for each segment.

5
4.2 Graphs of Motion You can use position vs. time graphs to compare the motion of different objects. The steeper line on a position vs. time graph means a faster speed.

6
4.2 Slope The slope of a line is the ratio of the “rise” to the “run”.
The steepness of a line is measured by finding its slope.

8
4.2 Calculating distance Suppose we draw a rectangle on the speed vs. time graph between the x-axis and the line showing the speed. On the graph, the length is equal to the time and the height is equal to the speed. The area of the rectangle is equal to its length times its height.

Similar presentations


- Whenever you describe something that is moving you.>")
 c.Distance: vertical axis, y-axis.>")


