Download presentation
Presentation is loading. Please wait.

2
The main climatic zones of Russian Federation (Fig.1)
")
3
Main factors1. Central2. North-West3. Southern4. Volga river5. Ural6. Siberia7. Far East Climate features: Precipitations, mm/year Effective air temperatures above +10 о (Σ t o > 10 o ) Days without frost Period of fields works: Start Finish 400-600 (max.900) 1775-2725 110-165 10.04-02.05 30.09-25.10 500-700 (max.1200) 1600-2100 65-140 25.04-11.05 25.09-11.10 200-250 (max. 600) 3100-3550 180-200 21.03-11.04 01.11-11.11 South 150- -North 700 3500 - 1625 180 -105 05.04-21.05 25.10-30.09 South 300 -North 700 2675-1450 165-80 05.04-21.05 11.11-11.09 South 200-- North700 2350-200 130-60 28.04-25.05 10.09-05.10 400-700 1600-2500 74-110 10.-20.04 25.09-10.10 Soils Types Stones in arable layer, % Soddy- podzolic Chernozem, Loam, Loamy sand 40-50 Podzolic, Soddy- podzolic, Loamy sand 60-70 Chernozem, (somewhere solonetz) 0-5 Chestnut, Solonetz, Soddy- podzolic, Loamy sand 0-5 Chernozem, Soddy- podzolic, Loam, Loamy sand 10-25 Chernozem, Soddy- podzolic, Loam, Loamy sand 8-10 Soddy- podzolic, Loam, 0-3 Fields conditions for working machinery Relief of fields surface Length of field passes, m Sizes of fields, ha - (%) Distance of transportation of agricultural products, km Various 300-1000 less 15 - (33%) 2,0 Various (20% of arable land (gradient 5 о ) 150-400 less 10 - (80%) 3,0 Mostly flat surface 600-1200 up to 30 - (20%) 5,0 Various 600-1200 up to 30- (10%) 5-10 Various but partly flat surface 300-1000 up to 30 -(3%) 6-8 Various 300-1200 up to 30 - (3%) до 15 Various 300 - 600 up to 60- (15%) 3 - 5 Typical conditions for plants production in all federal regions of Russia (average data for the last 10 years) Table 1 *At present time Southern region subdivided for two regions one of them North- Caucasus.
 Days without frost Period of fields works: Start Finish (max.900) (max.1200) (max. 600) South North South 300 -North South North Soils Types Stones in arable layer, % Soddy- podzolic Chernozem, Loam, Loamy sand Podzolic, Soddy- podzolic, Loamy sand Chernozem, (somewhere solonetz) 0-5 Chestnut, Solonetz, Soddy- podzolic, Loamy sand 0-5 Chernozem, Soddy- podzolic, Loam, Loamy sand Chernozem, Soddy- podzolic, Loam, Loamy sand 8-10 Soddy- podzolic, Loam, 0-3 Fields conditions for working machinery Relief of fields surface Length of field passes, m Sizes of fields, ha - (%) Distance of transportation of agricultural products, km Various less 15 - (33%) 2,0 Various (20% of arable land (gradient 5 о ) less 10 - (80%) 3,0 Mostly flat surface up to 30 - (20%) 5,0 Various up to 30- (10%) 5-10 Various but partly flat surface up to 30 -(3%) 6-8 Various up to 30 - (3%) до 15 Various up to 60- (15%) Typical conditions for plants production in all federal regions of Russia (average data for the last 10 years) Table 1 *At present time Southern region subdivided for two regions one of them North- Caucasus..")
4
Types of transport network Cargo weight, mln.ton Cargo turnover, billion ton- km Transportation of passengers, mln. people Total:8339491621894 Railways13822128993 Auto roads5663223- Bus, Trolleybus, Tram, Taxi --13305, 2152, 2004,8 Underground (Metro)--3351 Tubes (gas, oil, etc.)11312422- Rivers transport1286114 Sea transport34771,3 Airways1,24,966 Main indicators of transportation network of Russia in 2011 Table 2
 Tubes (gas, oil, etc.) Rivers transport Sea transport34771,3 Airways1,24,966 Main indicators of transportation network of Russia in 2011 Table 2.")
5
Farm-resources, Technique, Economy Indices Number of Priority Regions* Total amount used in priority regions,% Mineral Fertilizer 952 Machines for Mineral Fertilizer Application 2040 Chemicals for Plants Protection, including: -diseases control chemicals -pest control chemicals 5555 70 63 Machines for Chemicals Application1040 Diesel Fuels, Lubricants1250 Tractors, Grain Harvesters, Forage Harvesters1544-53 Sugar-beet Harvesters1081 Average Gross output of farm-products, $/ha18130…200 and above Profitable Farm-producers, numbers 1570% (32% - low profitable) Level of profitability on all activity without the State subsidies and compensation 1534% farms with profitability 10-40%; 32% farms-less 10% Supplying the priority regions with main agro-resources (average data for 2006-2009) Table 3 *) Total number of regions in Russia – 89, about 45 regions with developed Agrarian Sector.
 Level of profitability on all activity without the State subsidies and compensation 1534% farms with profitability 10-40%; 32% farms-less 10% Supplying the priority regions with main agro-resources (average data for ) Table 3 *) Total number of regions in Russia – 89, about 45 regions with developed Agrarian Sector.")
6
Indices *199219952000200520102011 Total arable land, Mha130,0127,6119,7115,4115,3 Sown area, Mha, including area under: - Grain and grain-leguminous; - Forage crops, total, including: - annual and perenial grasses; -corn for silage, green forages,haylage; - Sugar-beet; - Potato; 114,6 61,94 42,5 30,02 9,54 1,44 3,4 102,54 54,4 37,06 28,868 6,15 1,09 3,41 84,67 45,6 28,9 23,99 3,67 0,81 2,84 75,84 43,59 21,6 19,49 1,57 0,8 2,28 75,2 43,2 18,1 16,14 1,5 1,16 2,2 76,66 43,572 18,137 16,047 1,628 1,29 2,225 Fallow ground, Mha 13,0317,3818,0414,914,6613,99 Mineral fertilizer used, mln.t, including per I ha, t/ha Total fertilized area, % 10,1 89 66 1,5 17 25 1,4 19 27 1,4 25 32 1,9 38 42 2,0 39 46 Manure used, mln. t, including per I ha, t/ha Total fertilized area, % 347 3,5 7,4 127,4 1,4 3,2 66,0 0,9 2,2 49,9 0,9 3,4 53,1 1,0 7,5 52,6 1,0 7,3 Pesticides used, thousand t, Total treated area, % 101,5 74,6 65,0 56,0** 25,2 32,66 25,9 45,3 29,5 46,0** 29,5** 45,6** *) Data from Russia in Figures, 2012, **) Estimation. Total Agro - Recources Used in Russian Agriculture (1992, 1995, 2000, 2005, 2010, 2011) Table 4.
 Data from Russia in Figures, 2012, **) Estimation. Total Agro - Recources Used in Russian Agriculture (1992, 1995, 2000, 2005, 2010, 2011) Table 4..")
7
Indices199219952000200520102011 Average yield of grain, t/ha 1,81,311,311,561,851,851,832,24 Gross grain output, mln.t106,963,465,477,861,094,2 Average yield of sugar-beet, t/ha 19,218,8 28,224,139,2 Gross sugar-beet output, mln.t25,519,114,121,322,347,6 Average yield of potato, t/ha 11,411,810,512,410,014.8 Gross potato output, mln.t38,339,929,528,1 21,132,7 Average yield of vegetables, t/ha 14,514,814,317,018,020,8 Gross vegetables output, mln.t10,011,310,811,312,114,7 Average yield of sunflow, t/ha 1,161,060,991,190,961,34 Gross sunflower output, mln.t3,14,23,96,55,39,7 Average yield of soya-bean, t/ha 0,850,751,01,051,181,48 Gross soya-bean output, mln.t0,50,290,340,691,221,76 *) Data from Russia in Figures, 2012 Main Indices of Agricultural production in Russia (1992, 1995, 2000, 2005, 2010, 2011) Table 5.
 Data from Russia in Figures, 2012 Main Indices of Agricultural production in Russia (1992, 1995, 2000, 2005, 2010, 2011) Table 5.")
9
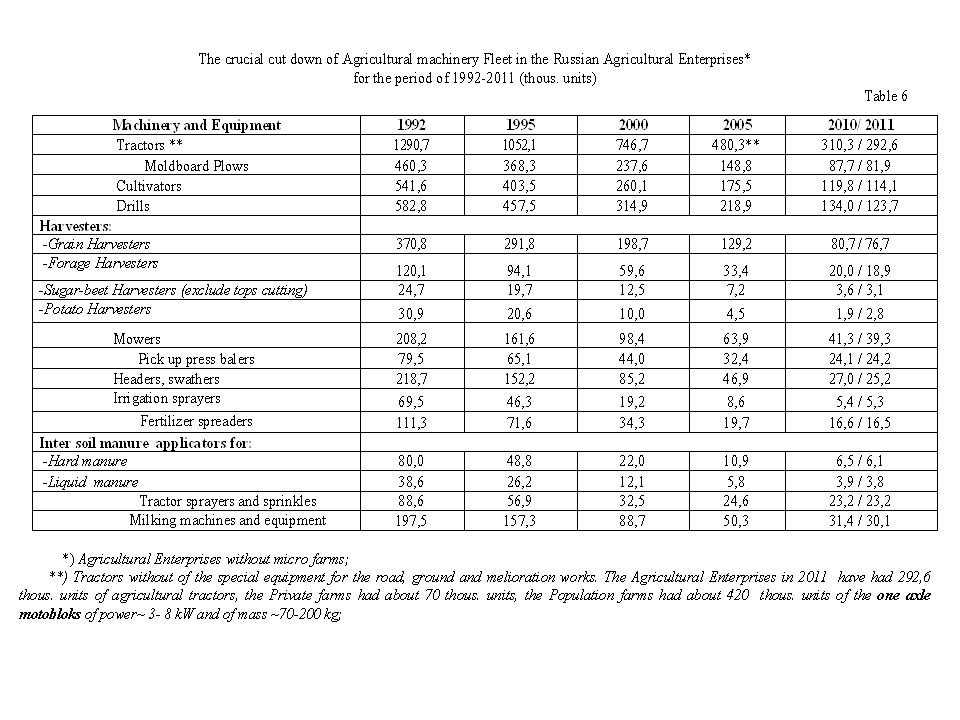
Machinery and Equipment19921995200020052010/2011 Tractors *19764 / 4 Field crops load, ha92108135181236 / 247 Harvesters: -Grain Harvesters66543 / 3 Field crops load, ha160173198270327 / 354 -Forage Harvesters 65432 / 2 Field crops load, ha 170210240330450/ 460 -Sugar-beet Harvesters (exclude tops cutting)171816114 / 3 Field crops load, ha60556293278 / 344 -Potato Harvesters 3356463216 /16 Field crops load, ha 3018223162 / 61 Dynamic of cut down of technical provision for the Russian Agriculture with key machinery (units / 1000 ha) and specific annual field crops load for one machine (hectares / units) Table 7. *) Tractors without of the special equipment for the road, ground and melioration works.
 Tractors without of the special equipment for the road, ground and melioration works..")
15
List of expenses Cost of operations and agro-resources, RF / ЕU, $/ha Share in total technology, % Average prices on technique agro- resources, labor cost share of expenses, US $/Kg Russia (RF)ЕUЕU 1.Direct expenses:53,8/11135,6 -labor;3,8/13,32,5 0,15 $/h (1,5 man-h/t) 12-15 $/h (0,15 man-h/t) -technique amortization, maintenance and repair; 39,8/87,226,34-6$/Kg14-16$/Kg -fuel and lubricants 10,2/10,56,8 0,17 $/Kg (60Kg/ha) 0,35 $/Kg (30Kg/ha) 2.Grain seeds35/8023,1 0,175 $/Kg (200Kg/ha) 0,5 $/Kg (160 Kg/ha) 3. Fertilizer24,6/41,6/59,216,3 N60P60K30N90P90K60 -ammoniac nitrate8,5/13,6/19,25,6 0,05 $/Kg (170Kg/ha) 0,08 $/Kg (170/240 Kg/ha) -superphosphate14/21/309,3 0,1 $/Kg (140Kg/ha) 0,15$/Kg (140/200 Kg/ha) -potassium nitrate2,1/7/101,4 0,03 $/Kg (70 Kg/ha) 0,1 $/Kg (70/100 Kg/ha) 4.Pesticides:19,6/2013 -tilt17,4/17,411,5 34,8 $/Kg (0,5 l/ha) 34,8 $/Kg (0,5 l/ha) -2,4-D + gtanstar; 2,1/2,4 0,17/0,17 1,4 0,1 1,4 $/Kg (1,5 Kg /ha) 11$/ Kg (15 g/ha) ~1,6$/ Kg (1,5 Kg /ha) 11$/ Kg (15 g/ha) 5.Additional direct expenditures3/5,8/6,12 Structure of expenses and specific cost of cereals production in main grain growing regions (calculation on average indicators for prices 2003-2006) Table 8
 0,08 $/Kg (170/240 Kg/ha) -superphosphate14/21/309,3 0,1 $/Kg (140Kg/ha) 0,15$/Kg (140/200 Kg/ha) -potassium nitrate2,1/7/101,4 0,03 $/Kg (70 Kg/ha) 0,1 $/Kg (70/100 Kg/ha) 4.Pesticides:19,6/2013 -tilt17,4/17,411,5 34,8 $/Kg (0,5 l/ha) 34,8 $/Kg (0,5 l/ha) -2,4-D + gtanstar; 2,1/2,4 0,17/0,17 1,4 0,1 1,4 $/Kg (1,5 Kg /ha) 11$/ Kg (15 g/ha) ~1,6$/ Kg (1,5 Kg /ha) 11$/ Kg (15 g/ha) 5.Additional direct expenditures3/5,8/6,12 Structure of expenses and specific cost of cereals production in main grain growing regions (calculation on average indicators for prices ) Table 8.")
16
6. Over expenses15/28,9/30,710 7. Specific cost of production, $/ha151/289/307100 8. Specific cost of wheat ($/t), at different yield: -2,5 t/ha; -3,5 t/ha, -5 t/ha, -7 t/ha; 60/116/123 43/79/83 00/00/61 00/00/44 Price of bread wheat 0,12 $/Kg Price of bread wheat 0,12 $/кг 9. Profit, $/ha at different yield: -2,5 t/ha; -3,5 t/ha; -5 t/ha; -7 t/ha; 149/11/-7 269/131/113 00/00/293 00/00/533 Structure of expenses and specific cost of cereals production in main grain growing regions (calculation on average indicators for prices 2003-2006) Table 8 ( continue )
, at different yield: -2,5 t/ha; -3,5 t/ha, -5 t/ha, -7 t/ha; 60/116/123 43/79/83 00/00/61 00/00/44 Price of bread wheat 0,12 $/Kg Price of bread wheat 0,12 $/кг 9. Profit, $/ha at different yield: -2,5 t/ha; -3,5 t/ha; -5 t/ha; -7 t/ha; 149/11/-7 269/131/113 00/00/293 00/00/533 Structure of expenses and specific cost of cereals production in main grain growing regions (calculation on average indicators for prices ) Table 8 ( continue ).")
17
Types of Farms Total arable land, Mha Including Grain crops Technical crops Potato, vegetables, melon-field crops Forage crops All Agricultural Farms 75,2/76,743,2/43,610.9/11,83,0/3,118,1/18,1 Agricultural Enterprises 56,1/56,732,1/32,17,9/8,50,3/0,415,8/15,7 Private Farms15,6/16,510,6/11,03,0/3,30,3/0,31,7/1,9 Populations plots3,5/3,50,5/0,50,0/0,02,4/2,40,6/0,5 Agricultural crops in all Types of Agricultural Farms, 2011/2012, (Mha) Table 9 *) Including Individual owners;
 Table 9 *) Including Individual owners;")
18
Agricultural products Agricultural enterprisesPopulations plotsPrivate farms 200520102011200520102011200520102011 Grain after cleaning80,677,176,81,11,01,118,321,922,1 Sugar-beet88,488,786,41,10,40,510,510,913,1 Sunflower seeds72,173,071,90,50,60,427,426,427,7 Potatoes8,410,513,088,884,079,62,85,57,4 Vegetables18,717,119,774,471,566,66,911,413,7 Cattle and poultry meat (dead weight) 46,260,663,251,436,533,82,42,93,0 Milk45,144,945,451,850,449,73,14,74,9 Eggs73,677,177,525,722,121,70,70,8 Wool (physical weight)25,719,7…54,754,4…19,625,9… The structure of main agricultural crop production in all types of farms (In % of total production of all types of Farms) Table 10 Dynamic of the agricultural production (1992-2011) of all types of farms shows that the input of populations plots and large agricultural enterprises close to each other during of the last 20 years in spite of the fact that population have 22 times less of arable land (Table 8; 9 and 10).
 46,260,663,251,436,533,82,42,93,0 Milk45,144,945,451,850,449,73,14,74,9 Eggs73,677,177,525,722,121,70,70,8 Wool (physical weight)25,719,7…54,754,4…19,625,9… The structure of main agricultural crop production in all types of farms (In % of total production of all types of Farms) Table 10 Dynamic of the agricultural production ( ) of all types of farms shows that the input of populations plots and large agricultural enterprises close to each other during of the last 20 years in spite of the fact that population have 22 times less of arable land (Table 8; 9 and 10).")
19
TYPES OF FARMS19921995200020052008200920102011 Farms of all types100 Agricultural enterprises67,150,245,244,648,145,444,547,7 Populations plots31,847,951,649,343,447,148,443,4 Private farms1,11,93,26,18,57,57,18,9 DYNAMIC OF THE AGRICULTURAL PRODUCTION STRUCTURE (1992-2011) DEPENDS ON TYPES OF FARMS (In % of production cost for every type of Farms) Table 10 *) Including the individuals;
 DEPENDS ON TYPES OF FARMS (In % of production cost for every type of Farms) Table 10 *) Including the individuals;")
20
Priority problems for Machine Testing Stations (MTS) of Russia to test a new machinery of domestic production and imported machines including secondhand machinery under control of Ministry of Agriculture of Russia Federation The main tasks of the Machine Testing Stations of Russia consist of: -testing the new and modernized machinery concerning the requirements of standards (GOST R ); -periodical testing of industrial produced machinery for confirmation of their manufacturing quality, exploitation- techno-logical indicators; -testing of the new agro technologies for main crops production in different soil-climatic zones of Russia; -informative support of the efficiency of complexes of machines and progressive technologies in agriculture; -monitoring of manufacturing quality of agricultural machinery in different soil-climatic conditions; -taking part in working out and introducing the new national and international standards and methodics; -consulting the agricultural workers and specialists of Agro-Industrial Complex in using the new rules for proper application of modern technology and machinery; -working out the specialized stands, equipments and precision instrumentations for the testing of agricultural machines; The 10 Machine Testing Stations located in different zones of Russian Federation are testing of about 1200 annually and more than 200 testing of machines for confirmation the certificates. The MUS has financial budget support and subsidies for modernization. The useful expenditure of increased subsidies of Federal and Regional governments for the agricultural producers to buy the new techniques required more control for the effective use of budget money also not only for the testing the agricultural tractors, harvesters and other agricultural techniques in different soil-climatic zones to fit the requirements of the standards (for designation, safety and durability) but also for special tasks – to check the efficiency of adaptation of the new machinery (domestic production, imported and second-hand machinery) to the new agro technologies suitable for the main regions of Russia and which were worked out by the Russian scientists. Now the new leadership of Ministry of Agriculture plans to evaluate the new machinery for adaptation them to 550 new agro technologies in most regions of Russian Agriculture in order to make necessary innovations and modernization agricultural machinery fleet. This helps to spread the agricultural machinery market in Russia. The Machine Testing Stations of Russia are under Ministry of Agriculture and they not depend on influence of industrial structures. We hope the new initiatives of Ministry of Agriculture will be successful.
 but also for special tasks – to check the efficiency of adaptation of the new machinery (domestic production, imported and second-hand machinery) to the new agro technologies suitable for the main regions of Russia and which were worked out by the Russian scientists. Now the new leadership of Ministry of Agriculture plans to evaluate the new machinery for adaptation them to 550 new agro technologies in most regions of Russian Agriculture in order to make necessary innovations and modernization agricultural machinery fleet. This helps to spread the agricultural machinery market in Russia. The Machine Testing Stations of Russia are under Ministry of Agriculture and they not depend on influence of industrial structures. We hope the new initiatives of Ministry of Agriculture will be successful..")
Similar presentations


 Grants Chapter 6.>")