Download presentation
Presentation is loading. Please wait.

1
IFS Understanding recent trends in income inequality Alissa Goodman Institute for Fiscal Studies

2
Overview Recent changes in income inequality very different to the 1980s Remarkable stability across much of the distribution Inequality still high, if not rising much

3
Measuring income inequality Follows Governments low income statistics: –Current income from all sources –Summed across all household members –Net of direct taxes, including benefits –Equivalised for family size and composition

4
The Income Distribution: 2002/03

5
How unequal are we? 2002/03 Share of top 1% 8.0% Share of top 10% 27.7% Share of bottom 10% 2.8% 90/10 ratio 4.0 Gini coefficient 0.34

6
The Gini Coefficient, 1961-2001

7
Drivers of rising inequality in 1980s: Labour market outcomes Participation: falling amongst low-skill men Wages: increasing returns to education Institutional change: e.g.union decline Demographic change increasing numbers of single adult households Fiscal policy changes Overall impact regressive through 1980s

8
How were the 1990s different? Growth in income inequality slower

9
Inequality growth was slower Gini coefficient

10
Inequality growth was slower Gini coefficient

11
How were the 1990s different? Growth in income inequality slower Growth in income inequality localised –Remarkable stability across most of the population

12
Inequality growth was localised 90/10 ratio

13
Inequality growth was localised 90/10 ratio

14
Inequality growth was localised Income growth: 1980s

15
Inequality growth was localised Income growth: 1980s

16
Inequality growth was localised Income growth: 1990s

17
How were the 1990s different? Growth in income inequality slower Concentrated in small parts of the distribution –Remarkable stability across most of the population Increased inequality driven by top and bottom

18
Inequality growth was localised 1996- 2002

19
Inequality growth was localised 1996/7- 2001/02

20
Inequality growth was localised 1996/7- 2001/02

21
Inequality growth was localised 1996/7- 2001/02

22
Inequality growth was localised 1979- 1990

23
How were the 1990s different? Growth in income inequality slower Concentrated in small parts of the distribution –Remarkable stability across most of the population Increased inequality driven by top and bottom Low income groups kept pace

24
Low incomes kept pace

25
How were the 1990s different? Growth in income inequality slower Concentrated in small parts of the distribution –Remarkable stability across most of the population Increased inequality driven by top and bottom Low income groups kept pace Consumption inequality did not grow

26
What changed? Labour market outcomes Increases in participation: some recovery among low-skilled Wages: stable returns to education as supply of educated workers has grown (Institutional change: minimum wage)
.")
27
Earnings inequality

28
What changed? Labour market outcomes Participation: some recovery among low-skilled Wages: stable returns to education as supply of educated workers has grown (Institutional change: minimum wage) Fiscal policy changes Overall impact progressive since 1999
 Fiscal policy changes Overall impact progressive since")
29
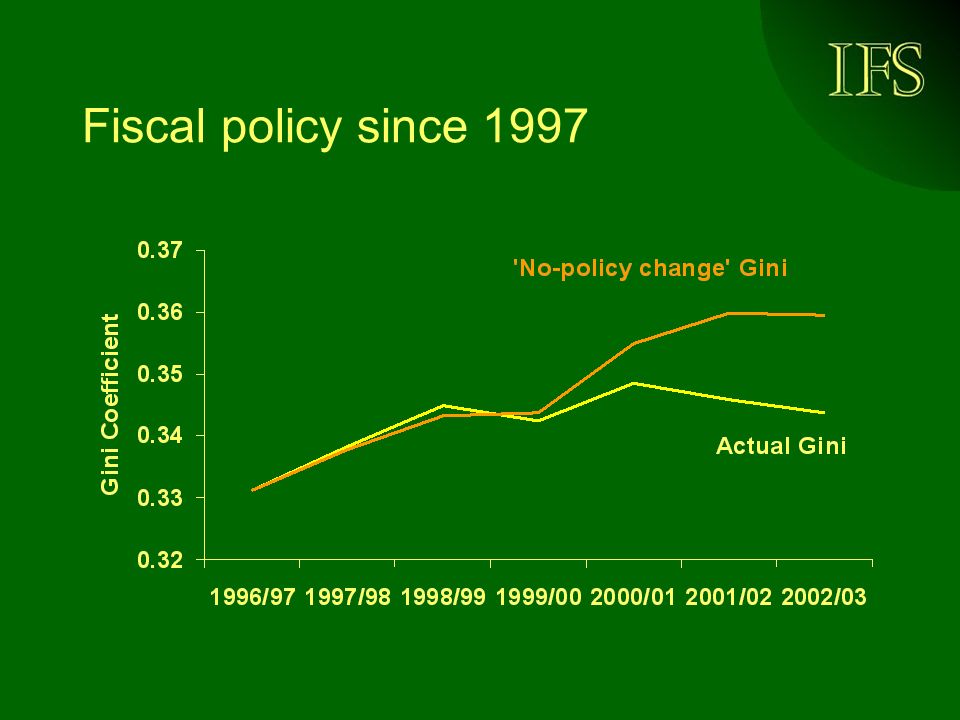
Fiscal policy since 1997

31
Gross income inequality

32
Conclusions Top and bottom incomes drove inequality growth over 1990s Most of the distribution if anything, equalised Longer-term context: inequality at 1950s levels Future: child poverty targets imply more redistribution

Similar presentations


 * This presentation is based on the book Minimum Wages and Social Policy: Lessons from Developing.>")


 Inequality in Earnings.>")


 Inequality in Europe and the USA March 28 2014.>")


