Download presentation
Presentation is loading. Please wait.

1
Evaluating the Impact of Improvements in Transport: The Case of Transport Corridors in Southern Africa Sandra Sequeira Harvard University August 31, 2006

2
Outline of the Discussion Motivation: Nexus between Transport, Trade and Growth Motivation: Nexus between Transport, Trade and Growth Policy Intervention: Rehabilitating Transport Corridors Policy Intervention: Rehabilitating Transport Corridors Evaluation Project: Evaluation Project: –Goal: measure micro-level impact of changes in transport costs –Primary and auxiliary evaluation questions –The importance of a micro approach –Detailed research design: Empirical Strategy, Robustness of results Empirical Strategy, Robustness of results –Implementation Details

3
Trade, Transport and Growth Freight Costs Firms Freight Costs FirmsTradeInvestment Congested Ports Non-performing Rail Poor maintenance of Roads GROWTH

4
Transport, Trade and Growth (Cont) Hummels (1998), Venables (1999), Yeats (1996) Hummels (1998), Venables (1999), Yeats (1996) –increasing importance of transport costs, especially for Sub Saharan Africa (SSA) –SSA: commodity based economies, high volume, low value goods long distances, several border posts long distances, several border posts accumulated neglect of primary transport networks accumulated neglect of primary transport networks Goal: Reduce costs of exporting raw materials and importing inputs and final goods importing inputs and final goods TRADE-LED GROWTH TRADE-LED GROWTH
 Hummels (1998), Venables (1999), Yeats (1996) Hummels (1998), Venables (1999), Yeats (1996) –increasing importance of transport costs, especially for Sub Saharan Africa (SSA) –SSA: commodity based economies, high volume, low value goods long distances, several border posts long distances, several border posts accumulated neglect of primary transport networks accumulated neglect of primary transport networks Goal: Reduce costs of exporting raw materials and importing inputs and final goods importing inputs and final goods TRADE-LED GROWTH TRADE-LED GROWTH")
5
Policy Goals: Guiding the Transport Infrastructure Shock Important to understand: Important to understand: –Extent, Determinants and Impact of transport Policies –Impact of transport costs on firms Motivating questions: Do investments in transport infrastructure reduce transport costs for firms?Do investments in transport infrastructure reduce transport costs for firms? To what extent and how do transport costs affect firm productivity, profits, employment generation and export propensity?

6
Policy Intervention: What, Where, Why? Project: Evaluation of Transport Improvements in South Africa and Mozambique Project: Evaluation of Transport Improvements in South Africa and Mozambique Why? High impact area due to: Why? High impact area due to: High overland transport costs High overland transport costs Long distances to ports Long distances to ports Commodity based economies Commodity based economies

7
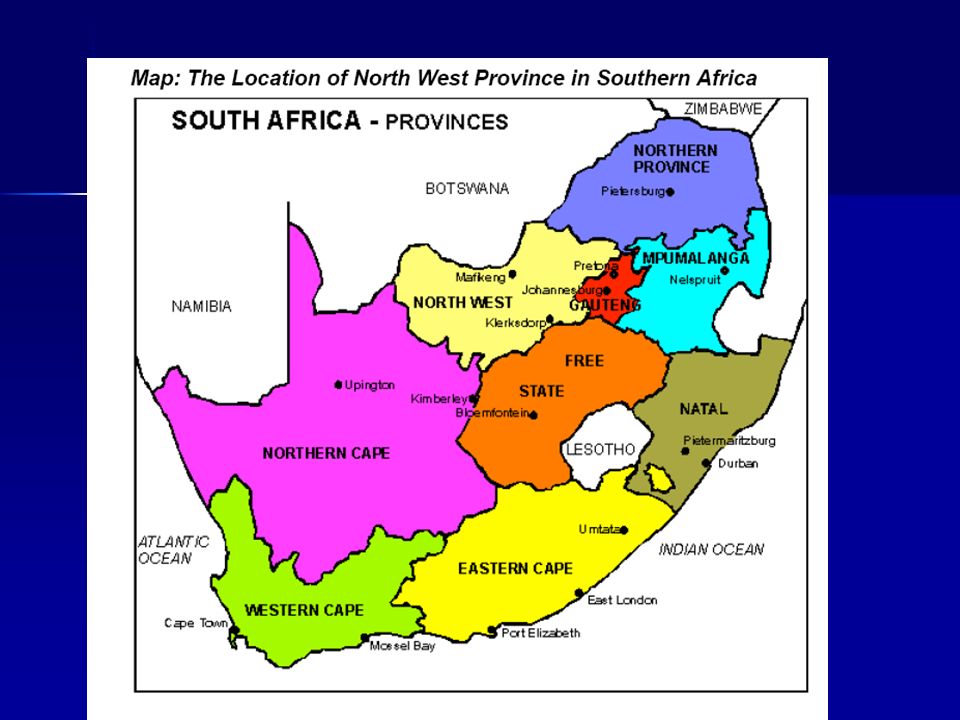
Geographic Focus South Africa South Africa –Important industrial, mining and agricultural region far from the coast (600 - 1,200 km) –Current accelerating growth strategy constrained by transport (Eg: Import Parity Pricing, Limited Response to Asian Commodity Boom) –Acute sense of importance of transport, 15-20% of GDP equivalence
 –Current accelerating growth strategy constrained by transport (Eg: Import Parity Pricing, Limited Response to Asian Commodity Boom) –Acute sense of importance of transport, 15-20% of GDP equivalence")
8
Geographic Focus (cont) Mozambique Mozambique –Third lowest road and railway densities in Southern and Eastern Africa –Acute sense of importance of transport (product based studies: 60, 80% of product value) –Historically a transport economy serving a strong hinterland (South Africa, Zimbabwe, Malawi, Zambia, Botswana, Swaziland)
 Mozambique Mozambique –Third lowest road and railway densities in Southern and Eastern Africa –Acute sense of importance of transport (product based studies: 60, 80% of product value) –Historically a transport economy serving a strong hinterland (South Africa, Zimbabwe, Malawi, Zambia, Botswana, Swaziland)")
9
Policy Intervention to be Evaluated Promotion of Spatial Development Initiatives (SDIs) Promotion of Spatial Development Initiatives (SDIs) –Goal : stimulate growth, trade and investment along key international transport corridors –Strategy : bilateral agreements that identified cluster cross-sectoral investment opportunities for PPPs. Transport: the promotion of PPPs based on matching users to infrastructure providers –Target Regions: key transnational transport corridors –Expected Outcomes: virtuous cycle of expanding regional markets, increased regional integration, a regional approach to FDI, job creation, Small and Medium Size Enterprise (SMMEs) development, strengthened planning and managing capacity of local governments and rapid economic growth.
 development, strengthened planning and managing capacity of local governments and rapid economic growth..")
10
SDIs in Southern and Eastern Africa SDIs in Southern and Eastern Africa

12
Focus of the Evaluation Project Maputo Development Corridor (MDC) consists of: Maputo Development Corridor (MDC) consists of: –Gauteng-Maputo toll road (2001) –Private Port of Maputo (2004) –Wittbank-Ressano Garcia Rail line (operational by the end of 2006) Why focus on the Rehabilitation of the Gauteng-Ressano Garcia Rail Link: Why focus on the Rehabilitation of the Gauteng-Ressano Garcia Rail Link: i. Rail volumes guarantee ship calls at the port and justify regular dredging ii. Technological developments and containerization broadened the range of rail-friendly cargo, also rail relative cost-effectiveness. Allows for measurement of cross-industry and cross-firm effects iii. Development Debate Redux: role of rail in development and growth (Rostow, Fogel, Fishlow, etc): measuring the magnitude of the reduction in transportation costs associated with rail, who benefits, what are the effects on trade, structure of regional output, rise in per capita income, etc.
: measuring the magnitude of the reduction in transportation costs associated with rail, who benefits, what are the effects on trade, structure of regional output, rise in per capita income, etc..")
14
Goal of Evaluation Project Empirical investigation aims to: i. Measure the impact of changes in transport on firm behavior, investment and growth. ii. Measure the interaction between transport modes and transport corridors modes and transport corridors iii. Contribute to the broader cost-benefit analysis on the cost-effectiveness of investments in on the cost-effectiveness of investments in transport transport

15
Evaluation Questions Primary evaluation questions: i. Does introducing competition between transport corridors increase efficiency in the transport system and reduce transport costs for firms? ii. Do reductions in transport costs promote regional growth through improved trade and investment opportunities?

16
Evaluation Questions (cont.) Auxiliary questions: a. Transport Analysis: i. Are investments in rail and road complements or substitutes? i. Are investments in rail and road complements or substitutes? ii. What is the nature and magnitude of spillover or network effects ii. What is the nature and magnitude of spillover or network effects across transport modes and transport corridors? across transport modes and transport corridors? b. Firm-level Analysis: i. Do investments in infrastructure translate into uniform reductions i. Do investments in infrastructure translate into uniform reductions in unit transport costs for all commodities and firms? in unit transport costs for all commodities and firms? ii. Do changes in transport costs affect firm dynamics regarding investment patterns, export behavior, factor productivity and investment patterns, export behavior, factor productivity and patterns of entry and exit from the market? patterns of entry and exit from the market? iii. Is there variation on firms' responses to changes in transport costs? iii. Is there variation on firms' responses to changes in transport costs?

17
Evaluation Questions (cont.) c. Growth Analysis: i. Through which mechanisms do investments in i. Through which mechanisms do investments in transport infrastructure affect firms' productivity, transport infrastructure affect firms' productivity, investment and growth? investment and growth? ii. Are investments in transport infrastructure a cost- ii. Are investments in transport infrastructure a cost- effective and sustainable strategy to promote effective and sustainable strategy to promote growth? growth? iii. Do SDIs cause convergence or divergence with iii. Do SDIs cause convergence or divergence with other non-targeted regions? other non-targeted regions? iv. Are the benefits commensurate with the costs? What are iv. Are the benefits commensurate with the costs? What are the social and economic rates of return to investments in the social and economic rates of return to investments in transport? transport?

18
Innovative Research Design Policy Relevance: a. Learning potential for future SDIs: Policy Cascade through NEPAD NEPAD b. The importance of micro-data: 1. Understanding distributional effects of transport investments leads to a more targeted demand-driven transport policy 2. Matching effects to different elements of transport corridor (rail, road, ports) 3. Survey methodology allows us to get at micro effects that escape macro evaluations concerning types of investment in transport: eg. trade off between transport time and cost for different firms and industries
 3. Survey methodology allows us to get at micro effects that escape macro evaluations concerning types of investment in transport: eg. trade off between transport time and cost for different firms and industries.")
19
Innovative Research Design (cont.) c. New approach to impact evaluation of transport infrastructure: Existing studies on transport infrastructure are based on: 1) ex ante cost benefit analyses 2) aggregate inferences based on crude country level measurements of port efficiency, road density and measurements of port efficiency, road density and length of railways and their impact on trade, length of railways and their impact on trade, investment and growth. investment and growth. Before and After analysis of distributional effects allows us to get at: Who benefited? By how much? Can we accurately measure the impact on trade, on employment, investment and growth?
 ex ante cost benefit analyses 2) aggregate inferences based on crude country level measurements of port efficiency, road density and measurements of port efficiency, road density and length of railways and their impact on trade, length of railways and their impact on trade, investment and growth. investment and growth. Before and After analysis of distributional effects allows us to get at: Who benefited. By how much. Can we accurately measure the impact on trade, on employment, investment and growth .")
20
Detailed Research Design Indicators I. Estimating the Effect of Competition in the Transport System Secondary Data Collection along targeted and alternative corridors Traffic Road, Rail, Port (Cabotage and International) Sources: ANE, CFM, MPDC, CdM, CDN, Portnet, Stats SA, NPA, SANRAL Transit Time Road, Rail, Port Sources: Main Survey, CFM, ANE, MPDC, CdM, CDN, Maputo Corridor Logistics Initiative (MCLI), SANRAL Cost Road Hauliers, Rail, Port Sources: Road Hauliers (see Annex I), CFM, MPDC, CdM, CDN, Development Bank of South Africa (DBSA), Road Freight Association of SA Safety Road accidents, Rail Derailments Sources: INE, CFM, ANE, Ministry of Transport in both countries
 Sources: ANE, CFM, MPDC, CdM, CDN, Portnet, Stats SA, NPA, SANRAL Transit Time Road, Rail, Port Sources: Main Survey, CFM, ANE, MPDC, CdM, CDN, Maputo Corridor Logistics Initiative (MCLI), SANRAL Cost Road Hauliers, Rail, Port Sources: Road Hauliers (see Annex I), CFM, MPDC, CdM, CDN, Development Bank of South Africa (DBSA), Road Freight Association of SA Safety Road accidents, Rail Derailments Sources: INE, CFM, ANE, Ministry of Transport in both countries.")
21
II. Estimating the effect of transport corridors on growth and development: (Secondary Data Collection on treated and control regions) Indicators Growth GDP per capita Annual average growth rates Annual sectoral growth rates (mining, agriculture, tourism, manufacturing) and competitiveness Levels of Industry concentration (inverted Herfindhal) Source: STATS, SA, INE, Banco de Moçambique Investment New sectoral investments Total investments Foreign and Domestic Investment, aggregate and sectoral Source: STATS SA, TIPS and Ministerial data from Trade and Industry, Tourism, Transport and Agriculture, CPI and Ministerial data from Trade and Industry, Tourism, Transport and Agriculture SMMEdevelopment Number of new SMEs Turnover of SMEs Competitiveness, job creation, diversification, export propensity Source: TIPS, INE
 Indicators Growth GDP per capita Annual average growth rates Annual sectoral growth rates (mining, agriculture, tourism, manufacturing) and competitiveness Levels of Industry concentration (inverted Herfindhal) Source: STATS, SA, INE, Banco de Moçambique Investment New sectoral investments Total investments Foreign and Domestic Investment, aggregate and sectoral Source: STATS SA, TIPS and Ministerial data from Trade and Industry, Tourism, Transport and Agriculture, CPI and Ministerial data from Trade and Industry, Tourism, Transport and Agriculture SMMEdevelopment Number of new SMEs Turnover of SMEs Competitiveness, job creation, diversification, export propensity Source: TIPS, INE.")
22
II. Estimating the effect of transport corridors on growth and development (cont.) (Secondary Data Collection on treated and control regions) Indicators Employment Employment and labor force participation Migration Annual sectoral employment growth Source: STATS SA Infrastructure Number of households with access to water and sanitation, energy and telecommunications Source: World Bank Health and Education HIV and Malaria prevalence Primary School attendance Access to Primary Schools Source: Demographic and Health Surveys (1997, 2003), Ministry of Health and Ministry of Education
 (Secondary Data Collection on treated and control regions) Indicators Employment Employment and labor force participation Migration Annual sectoral employment growth Source: STATS SA Infrastructure Number of households with access to water and sanitation, energy and telecommunications Source: World Bank Health and Education HIV and Malaria prevalence Primary School attendance Access to Primary Schools Source: Demographic and Health Surveys (1997, 2003), Ministry of Health and Ministry of Education.")
23
III. Estimating the Effect of Transport Costs on Industries and Firms: (Primary Data Collection) Empirical Strategy: Empirical Strategy: i. Population of Interest i. Population of Interest ii. Sampling Criteria ii. Sampling Criteria iii. Survey Output and Indicators iii. Survey Output and Indicators iv. Robustness Tests iv. Robustness Tests v. Implementation v. Implementation
 Empirical Strategy: Empirical Strategy: i. Population of Interest i. Population of Interest ii. Sampling Criteria ii. Sampling Criteria iii. Survey Output and Indicators iii. Survey Output and Indicators iv. Robustness Tests iv. Robustness Tests v. Implementation v. Implementation.")
24
Empirical Strategy i. Cross Sectoral Firm Level Survey Geographic Location: Geographic Location: i. Treatment regions of Mpumalanga, Limpopo and Northeastern Gauteng in South Africa; and Northeastern Gauteng in South Africa; Maputo, Southern Gaza and Southern Inhambane in Maputo, Southern Gaza and Southern Inhambane in Mozambique; Mozambique; ii. Control regions of Southern Gauteng, Kwazulu Natal, Western and Eastern Cape in South Africa and Natal, Western and Eastern Cape in South Africa and the Mozambican provinces of Northern Inhambane, the Mozambican provinces of Northern Inhambane, Sofala, Manica, Nampula, Niassa and Zambézia Sofala, Manica, Nampula, Niassa and Zambézia

27
Empirical Strategy (cont.) ii. Sampling Criteria: –800 firms in South Africa and Mozambique –Cross section of industries: Mining, Manufacturing, Retail, Tourism and Agribusiness. –Stratified Random Sampling determined by industry, location and firm size

28
Empirical Strategy (cont.) Treatment and control groups will be matched by propensity scores based on a vector of firm and industry level characteristics. Treatment and control groups will be matched by propensity scores based on a vector of firm and industry level characteristics. iii. Survey output: Firm-level organizational, financial, transport and performance indicators Chief indicators: Profits, Factor Productivity, Investment and Risk, Export propensity, Inputs, Sales, Output mix.

29
iv. Robustness Tests I. Durban and Maputo: de facto alternatives or complements? Is Maputo a real choice? Comparability of port technologies, cost and productivity Comparability of port technologies, cost and productivity –Depth –Productivity –Storage Capacity –Distances and Cost –Safety

30
Durban Quay Lengths and Depths MaputoPort Berth Lengths and Depths Terminal Quay length (m) Alongsid e depth (m) Maputo Containers 300 10.3 Citrus 380 11.0 Bulksugar 170 10.5 Molasses 179 10.5 Bagged sugar 200 10.5 Coastal 300 8.0 Matola Grain 210 9.5 Aluminium 210 11.5 Petroleum 230 10.5 Coal 205 10.5
 Alongsid e depth (m) Maputo Containers Citrus Bulksugar Molasses Bagged sugar Coastal Matola Grain Aluminium Petroleum Coal")
31
Durban vs Maputo (cont) Productivity and Growth Potential: Productivity and Growth Potential: Berth Occupancy: 30% Maputo 100% Durban 100% Durban Crane Moves per hour: 15 TEU in both Safety : Maputo was first African certified ISPS port Safety : Maputo was first African certified ISPS port Storage Capacity: Storage Capacity: more in Durban but limited expansion, 3 days free storage more in Durban but limited expansion, 3 days free storage less in Maputo but more potential for expansion, offering 21 days free storage less in Maputo but more potential for expansion, offering 21 days free storage
 Productivity and Growth Potential: Productivity and Growth Potential: Berth Occupancy: 30% Maputo 100% Durban 100% Durban Crane Moves per hour: 15 TEU in both Safety : Maputo was first African certified ISPS port Safety : Maputo was first African certified ISPS port Storage Capacity: Storage Capacity: more in Durban but limited expansion, 3 days free storage more in Durban but limited expansion, 3 days free storage less in Maputo but more potential for expansion, offering 21 days free storage less in Maputo but more potential for expansion, offering 21 days free storage")
32
Road and Rail Distances (km) Johannes burg Middle burg Polok wane Phala borwa Lyden burg BelfastWitt bank MaputoRoad586417605425330326459 Rail584407550374443 437 DurbanRoad578640897910700690655 Rail7208201,051,083856 801
 Johannes burg Middle burg Polok wane Phala borwa Lyden burg BelfastWitt bank MaputoRoad Rail DurbanRoad Rail ,051,")
33
Road and Rail Costs Road costs: Durban cheaper, more backhauling Road costs: Durban cheaper, more backhauling Rail costs: Maputo cheaper Rail costs: Maputo cheaper Port Charges: Maputo cheaper Port Charges: Maputo cheaper Unit: Rands per 20 ft container EXPORTOverlandPortCharges Total Road Total Rail RoadRailDaysCostDaysCost Maputo vs Durban 4500-597-6593929-2-1168 IMPORT 500-597-598-11-2-1108

34
Historical Legacies- Historical Legacies- –Path-Dependence of Route Choice? No –In the past, ships would flip from Durban to Maputo depending on how many days delay. 45% of SA cargo in 1975 was going through Maputo. –Most firms willing to undergo short-term relocation costs even if small cost savings per ton km –Common Practice of Hedging between Ports The Curse of the Hub and Spoke Model? The Curse of the Hub and Spoke Model? –No clear consensus on the direction of the shipping industry –Economies of flow from consolidation in hubs versus higher timing and inventory costs –A system of more loops with smaller vessels bears less risk and could eventually turn out to be a cheaper option than running very large vessels on few loops. Most likely that both business models will prevail.

35
Nature and Expected Impact of the Intervention? Prior to the Intervention….expect change Prior to the Intervention….expect change 0,0 500,0 1.000,0 1.500,0 2.000,0 2.500,0 3.000,0 1975198019851900199520002004 Rail Transport along the MDC NationalInternationalTotal 10^3 TON. LIQ

36
Expected Impact of the Intervention

37
Potential Growth of Port Throughput with Rail ProductsDirection Existing Capacity (tonnage thousand) Full Capacity (ton. thous) Containers Import and Export 3100 CitrusExport0100 Coal&OresExport1,3002,500 MagnetiteExport5,000 GrainImport0203 SaltImport0250 FertilizerImport060
 Containers Import and Export 3100 CitrusExport0100 Coal&OresExport1,3002,500 MagnetiteExport5,000 GrainImport0203 SaltImport0250 FertilizerImport060.")
38
Comparability of Treated and Control Areas? I- Variation on Geographic Location of Production Sugar growing areas in South Africa are located on the coastal strip and hinterland around Durban as well as on the area east of Nelspruit, along the Maputo corridor. In Mozambique sugar grows in central provinces. Each of these areas is naturally placed in the catchment area of different corridors. Sugar growing areas in South Africa are located on the coastal strip and hinterland around Durban as well as on the area east of Nelspruit, along the Maputo corridor. In Mozambique sugar grows in central provinces. Each of these areas is naturally placed in the catchment area of different corridors. Fruit: Western and Eastern Cape, Nelspruit, Mpumalanga, Limpopo, Nampula Fruit: Western and Eastern Cape, Nelspruit, Mpumalanga, Limpopo, Nampula Retail: Gauteng, Western Cape, Durban, Maputo, Nampula Retail: Gauteng, Western Cape, Durban, Maputo, Nampula Cashews: Central, Southern and Northern Mozambique Cashews: Central, Southern and Northern Mozambique Car Manufactures: Eastern Cape, Pretoria, Durban Car Manufactures: Eastern Cape, Pretoria, Durban

39
Mining

40
Mining

41
II- Variation on Firm Size

42
Robustness Tests (cont.) Spurious Effect: Asymmetric Information? What drives the choice to ship through Maputo: Cost or information? Encouragement Design through MCLI (Maputo Corridor Logistics Initiative) Time Horizon : short enough to avoid confounding effects, long enough to see a difference. Preliminary qualitative research: 8 months research: 8 months Search for natural discontinuities based on: Search for natural discontinuities based on: a. Geographic location b. Product characteristics
 Time Horizon : short enough to avoid confounding effects, long enough to see a difference. Preliminary qualitative research: 8 months research: 8 months Search for natural discontinuities based on: Search for natural discontinuities based on: a. Geographic location b. Product characteristics.")
43
v. Implementation Research Partners: Research Partners: –Witts University, SA- Centre for Applied African Micro- Economic Research (CAAMER), Economics Department School of Development Studies, University of Kwazulu Natal, University of Cape Town School of Development Studies, University of Kwazulu Natal, University of Cape Town –Universidade Eduardo Mondlane Universidade Católica da Beira Universidade Católica da Beira –Stats SA, CSIR, INE
, Economics Department School of Development Studies, University of Kwazulu Natal, University of Cape Town School of Development Studies, University of Kwazulu Natal, University of Cape Town –Universidade Eduardo Mondlane Universidade Católica da Beira Universidade Católica da Beira –Stats SA, CSIR, INE.")
44
v. Implementation (cont.) Advantages of University partner : Advantages of University partner : - more cost effective - better use of local knowledge - better acceptance of the surveying exercise due to higher credibility (problem of Survey Fatigue and Mistrust) due to higher credibility (problem of Survey Fatigue and Mistrust) - higher returns to knowledge generation - promoting applied policy research at Universities (capacity building) - incentives for sustainable ongoing data collection
 Advantages of University partner : Advantages of University partner : - more cost effective - better use of local knowledge - better acceptance of the surveying exercise due to higher credibility (problem of Survey Fatigue and Mistrust) due to higher credibility (problem of Survey Fatigue and Mistrust) - higher returns to knowledge generation - promoting applied policy research at Universities (capacity building) - incentives for sustainable ongoing data collection.")
45
Tentative Implementation Schedule Late September 2006 Selection of survey teams, Piloting of survey instruments October 2006 Baseline data collection Late November 2006 Intermediate reports based on the baseline data September 2007 Follow-up survey November 2007 Draft reports December 2007 Dissemination of Results

46
Annex I- Trucking Industry Proposed Project: Expansion of the Trucking Survey currently underway in 6 African countries to South Africa and Mozambique Proposed Project: Expansion of the Trucking Survey currently underway in 6 African countries to South Africa and Mozambique –Goal: Measure the Impact of Investments in Rail Infrastructure on the Trucking Industry –Methodology: before and after survey to a sample of 20 formal firms (PPS) and 30 owner truckers in each country –Primary Evaluation Question: Do investments in rail infrastructure affect: Do investments in rail infrastructure affect: –i. The structure of the trucking industry? –ii. The cost of trucking services? –iii. Employment in the trucking industry?

47
Survey Data Ownership characteristics Ownership characteristics Indicators of firm productivity Indicators of firm productivity Percentage of backhaul trips Percentage of backhaul trips Load factor (ratio of actual load to capacity on Load factor (ratio of actual load to capacity on loaded trips) loaded trips) Level of competition in the trucking industry Level of competition in the trucking industry Exposure to corruption Exposure to corruption Exposure to overloading fines and choice of transport routes Exposure to overloading fines and choice of transport routes Average number of hours driven Average number of hours driven Major constraints for growth and formalization Major constraints for growth and formalization Nature of interactions with the formal sector Nature of interactions with the formal sector
 loaded trips) Level of competition in the trucking industry Level of competition in the trucking industry Exposure to corruption Exposure to corruption Exposure to overloading fines and choice of transport routes Exposure to overloading fines and choice of transport routes Average number of hours driven Average number of hours driven Major constraints for growth and formalization Major constraints for growth and formalization Nature of interactions with the formal sector Nature of interactions with the formal sector")
48
ANNEX-II Beira Corridor: Beira Corridor: –Key Transport Infrastructure: Rail: a) Sena line connecting to Tete, including spur lines to the Moatize Rail: a) Sena line connecting to Tete, including spur lines to the Moatize coal mines and to the Malawian border (600 km) coal mines and to the Malawian border (600 km) b) Machipanda line connecting to the Zimbabwean border (300 km). b) Machipanda line connecting to the Zimbabwean border (300 km). Repairs and maintenance concessioned to the Beira Railroad Company (CCFB), a consortium dominated by the Indian Rites and Ircon International who also own the 25 year lease over the Machipanda line since 2004. Port of Beira concessioned in 1998 to Cornelder Mozambique. Undergoing significant change Port of Beira concessioned in 1998 to Cornelder Mozambique. Undergoing significant change –Main Problems: Dredging of port, delays with rail, Zimbabwes economic collapse –Potential growth: vast Moatize hard coking coal deposits in Tete Province as well as mineral agri/fisheries, tourism, cotton and sugar industries along the Zambezi valley.
 Machipanda line connecting to the Zimbabwean border (300 km). Repairs and maintenance concessioned to the Beira Railroad Company (CCFB), a consortium dominated by the Indian Rites and Ircon International who also own the 25 year lease over the Machipanda line since Port of Beira concessioned in 1998 to Cornelder Mozambique. Undergoing significant change Port of Beira concessioned in 1998 to Cornelder Mozambique. Undergoing significant change –Main Problems: Dredging of port, delays with rail, Zimbabwes economic collapse –Potential growth: vast Moatize hard coking coal deposits in Tete Province as well as mineral agri/fisheries, tourism, cotton and sugar industries along the Zambezi valley..")
49
Beira Corridor

50
Nacala Corridor Key Transport Infrastructure: Key Transport Infrastructure: –Port of Nacala concessioned in 2005 to Corredor Desenvolvimento de Nacala (CDN)- consortium between Central East African Railways CEAR, Edlow Resources and Railroad Development Corporation –Rail : Nacala-Lichinga, Nacala-Malawi Major Problems: unstable concession of port and rail, significant delays in the Major Problems: unstable concession of port and rail, significant delays in the rehabilitation of the port and the major rail lines rehabilitation of the port and the major rail lines Potential for Growth: Capture significant cargo from Malawi and Potential for Growth: Capture significant cargo from Malawi and Zambia, CDN hold enormous potential in Zambia, CDN hold enormous potential in agriculture, forestry and fisheries, mining and tourism development. agriculture, forestry and fisheries, mining and tourism development.

51
Nacala Corridor

52
Nacala Line Forecast ( thousand tons) Commodity Loading (l)/ unloading (u) point 20052010 LowerUpper Containers Blantyre (u) 3050 Containers Lilongwe (u) Cereals Blantyre (u) 102030 Cereals Lilongwe (u) Fertiliser 407080 Fuel 204060 Sugar Limbe (l) 5080100 Others Cuamba (u) 304060 Others Cuamba (l) 203050 Others Lilongwe (u) 7090100 Others Lilongwe (l) 405070 Total 280450600
 Commodity Loading (l)/ unloading (u) point LowerUpper Containers Blantyre (u) 3050 Containers Lilongwe (u) Cereals Blantyre (u) Cereals Lilongwe (u) Fertiliser Fuel Sugar Limbe (l) Others Cuamba (u) Others Cuamba (l) Others Lilongwe (u) Others Lilongwe (l) Total")
53
Machipanda Line Forecast (Thousand Tons) SectionCommodity2010 DomesticAll218 ExportGranite176 ExportFerrochrome156 ExportSteel128 ExportContainer179 ExportMiscellaneous138 ImportFertiliser153 ImportContainer36 ImportMiscellaneous130 TOTAL1,314
 SectionCommodity2010 DomesticAll218 ExportGranite176 ExportFerrochrome156 ExportSteel128 ExportContainer179 ExportMiscellaneous138 ImportFertiliser153 ImportContainer36 ImportMiscellaneous130 TOTAL1,314")
54
Sena Line Forecast (Thousand Tons) SectionCommodity2010 Moatize - Beira Coal704 Sena - Beira Timber17 Cotton16 Other down 32 Beira - Sena Fertiliser14 Cement42 POL62 Stone15 Containers98 Other up 22 Marromeu - Beira Sugar85 Molasses39 Muanza - Dondo Limestone169 Malawi - Beira All down 199 Beira - Malawi All up 63 TOTAL 1,577
 SectionCommodity2010 Moatize - Beira Coal704 Sena - Beira Timber17 Cotton16 Other down 32 Beira - Sena Fertiliser14 Cement42 POL62 Stone15 Containers98 Other up 22 Marromeu - Beira Sugar85 Molasses39 Muanza - Dondo Limestone169 Malawi - Beira All down 199 Beira - Malawi All up 63 TOTAL 1,577")
55
Mozambican Exports ($US Millions) Commodity1997199819992000200120022003 Aluminium0.00.00.060.2473.1361.4567.6 Mineral fuels N/AN/AN/AN/AN/A136.0124.0 Fish34.466.474.8100.7102.2122.473.5 Prawns74.957.464.691.282.2N/AN/A Agriculture (excluding fish) 103.088.887.083.466.381.545.6 Cotton22.210.920.225.823.516.032.4 Textiles and clothing 10.010.05.86.714.125.733.2 Wood10.15.29.214.612.617.920.4 Cashews26.536.733.120.012.20.08N/A Oilseeds5.69.410.010.59.15.54.2 Miscellaneous7.615.18.210.810.715.515.8 Total 294300313424806782917
 Commodity Aluminium Mineral fuels N/AN/AN/AN/AN/A Fish Prawns N/AN/A Agriculture (excluding fish) Cotton Textiles and clothing Wood Cashews N/A Oilseeds Miscellaneous Total")
56
Mozambican Imports ($US Millions) Commodity1997199819992000200120022003 Minerals and fuels 176.7144.3152.5349.0353.3180.1377.8 Agriculture (excluding fish) 165.6191.0131.2156.8143.6177.5142.1 Machinery74.485.960.5188.9131.7174.8135.5 Transport equipment 113.473.8174.7174.880.5194.967.6 Other chemical products 38.541.625.359.978.386.653.8 Cereals (a) 40.052.040.632.445.9113.186.8 Textiles and clothing 42.342.629.941.526.229.220.9 Wood and paper products 16.225.710.530.140.128.129.0 Non ferrous metals 9.17.94.410.6234.716.08.8 Total 676665630104411341000922
 Commodity Minerals and fuels Agriculture (excluding fish) Machinery Transport equipment Other chemical products Cereals (a) Textiles and clothing Wood and paper products Non ferrous metals Total")
Similar presentations


 Kennedy Mbekeani NEPAD, Regional Integration and Trade Department 3 rd Meeting of Trade.>")
 Needs Assessment.>")
 Thomas Harms - Department of Mechanical.>")


