Download presentation
Presentation is loading. Please wait.

1
Strategy and Sustainability

2
1. Compare how operations and supply chain strategy relates to marketing and finance. 2. Understand the competitive dimensions of operations and supply chain strategy. 3. Identify order winners and order qualifiers. 4. Understand the concept of strategic fit. 5. Describe how productivity is measured and how it relates to operations and supply chain processes. 6. Explain how the financial markets evaluate a firm’s operations and supply chain performance.

3
How a company can create and sustain value for: Shareholders: Those individuals or companies that legally own one or more shares of stock in the company Stakeholders: Those individuals or organizations who are influenced, either directly or indirectly, by the actions of the firm LO 1

4
For many firms the scope of their strategy relates to: Social: pertains to fair and beneficial business practices toward labor, the community, and the region in which a firm conducts is business Economic: the firm’s obligation to compensate shareholders who provide capital via competitive returns on investment Environmental: the firm’s impact on the environment LO 1

5
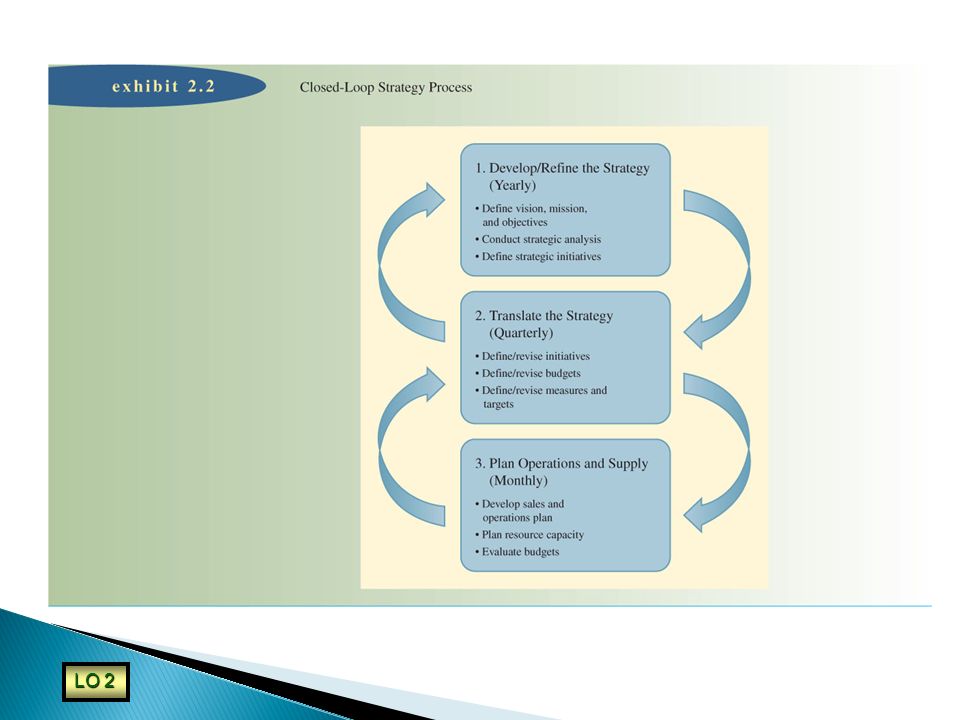
Operations and supply strategy: setting broad policies and plans for using the recourses of a firm to best support its long-term competitive strategy ◦ Part of a planning process that coordinates operational goals with those of the larger organization Operations effectiveness relates to the core business processes needed to run the business LO 2

7
Activity 1 is performed at least yearly and is where the overall strategy is developed Activity 2 is where the overall strategy is refined and updated as often as four times a year Activity 3 is where operational plans that relate to functional areas such as marketing, manufacturing, and so on, are coordinated LO 2

8
Price: make the product or deliver the service cheap Quality: make a great product or deliver a great service Delivery speed: make the product or deliver the service quickly Delivery reliability: deliver it when promised Coping with changes in demand: change its volume Flexibility and new product introduction speed: change it LO 2

9
1. Technical liaison and support 2. Meeting a launch date 3. Supplier after-sale support 4. Environmental impact 5. Other dimensions LO 2

10
For example, if we reduce costs by reducing product quality inspections, we might reduce product quality For example, if we improve customer service problem solving by cross-training personnel to deal with a wider-range of problems, they may become less efficient at dealing with commonly occurring problems LO 2

11
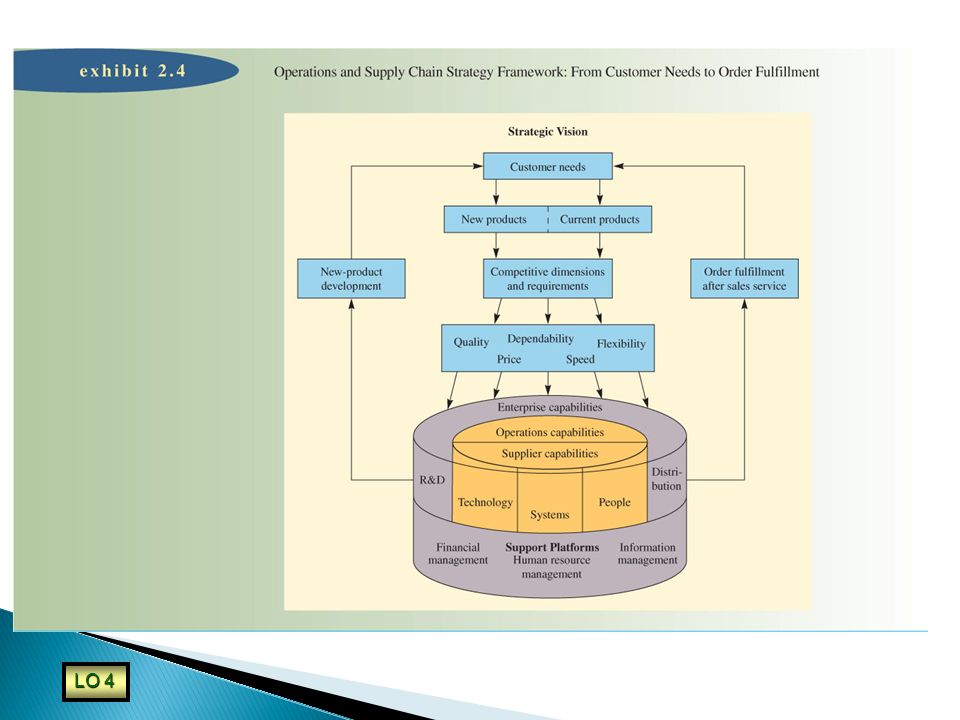
All the activities that make up a firm’s operation relate to one another To be efficient, must minimize total cost without compromising on customer needs Activity-system maps show how a company’s strategy is delivered through a set of tailored activities LO 4

13
Order qualifiers are the basic criteria that permit the firm’s products to be considered as candidates for purchase by customers Order winners are the criteria that differentiate the products and services of one firm from another LO 3

14
For autos product quality is now an “order qualifier” “order winners” for autos vary greatly by the bundle of features desired In general criteria such as cost or specific features or capabilities could be order winners or qualifiers LO 3

15
Productivity is a common measure of how well an organization is using its resources ◦ Fundamental to understanding operations-related performance In its broadest sense productivity is outputs divided by inputs ◦ To increase productivity, we want to make this ratio as large as practical LO 5

16
Productivity is a relative measure ◦ Can be compared with similar operations within its industry ◦ Can be compared over time Productivity may be expressed as: 1.Partial measures: output to one input 2.Multifactor measures: output to a group of inputs 3.Total measures: output to all inputs LO 5

17
Productivity is a common measure on how well resources are being used. In the broadest sense, it can be defined as the following ratio: Outputs Inputs LO 5

18
Total Measure Productivity = Outputs Inputs or = Goods and services produced All resources used LO 5

19
Partial measures of productivity = Output or Output or Output or Output Labor Capital Materials Energy LO 5

20
Multifactor measures of productivity = Output. Labor + Capital + Energy or Output. Labor + Capital + Materials LO 5

21
You have just determined that your service employees have used a total of 2400 hours of labor this week to process 560 insurance forms. Last week the same crew used only 2000 hours of labor to process 480 forms. Which productivity measure should be used? Answer: Could be classified as a Total Measure or Partial Measure. Is productivity increasing or decreasing? Answer: Last week’s productivity = 480/2000 = 0.24, and this week’s productivity is = 560/2400 = 0.23. So, productivity is decreasing slightly. LO 5

22
Comparing firms from an operations view is important to investors ◦ Earnings growth is a function of profitability ◦ Profits can increase through higher sales or lower costs ◦ Highly efficient firms shine during recession periods When evaluating large productivity, it is important to look for unusual explanations ◦ Want to avoid one-time events LO 6

Similar presentations