Download presentation
Presentation is loading. Please wait.

1
2.2 Internal influences on tropical cyclone formation IWTC-VI Kevin Tory Michael Montgomery 23 November 2006

2
Introduction Genesis requirements Vorticity tendency fundamentals MCS role in genesis Genesis theories of the last decade Modeling studies Observations Recommendations

3
Genesis Requirements Necessary environment for genesis: 1. Low- to mid-tropospheric cyclonic absolute vorticity 2. Weak vertical wind shear 3. Warm ocean 4. Moist unstable air mass Genesis is the transformation from this environment to a TC scale warm-cored self-sustaining vortex Convection drives the transformation Proposed 2-step genesis definition. 1. Pre-conditioning: the establishment of the necessary environment. 2. Vortex construction: the development of a self-sustaining warm- cored vortex.

4
Vorticity Tendency Fundamentals Haynes and McIntyre (1987) showed that: (i) There can be no net transport of PV ( a ) across any isentropic (isobaric) surface; (ii) PV ( a ) can neither be created nor destroyed, within a layer bounded by two isentropic (isobaric) surfaces. Thus, TC genesis involves a near-horizontal redistribution of PV ( a ).
..")
5
Vorticity Tendency Fundamentals What dynamical processes can lead to the development of cyclonic vortex core that spans the troposphere? Vortex cores of tropospheric depth can develop in deep convective regions. Modeling results show convergence into deep convective regions (6-8 km deep) can lead to vortex enhancement.
 can lead to vortex enhancement..")
6
Vorticity Tendency Fundamentals Low- to mid-level vorticity convergence, balanced by divergence at larger radii.

7
Vorticity Tendency Fundamentals How does the vortex intensify above ~7 km where the flow is divergent? A vertical advection-like effect is responsible for the upward growth in intense updrafts. HM87 is not violated because local increases are balanced by nearby weakening from tilting-like effects.

8
Vorticity Tendency Fundamentals Low- to mid-level vorticity convergence, Vertical advection-like effect balanced by divergence at larger radii. balanced by tilting-like effect at updraft edge.

9
How do we get from this, …to this? Somewhere on the web. MCS role in genesis Convergence Divergence Convergence Div Con Fig. 14 from Houze (2004) Rev. of Geo.
 Rev. of Geo..")
10
MCS role in genesis Convergence Divergence Convergence Div Con ? Fig. 14 from Houze (2004) Rev. of Geo. Somewhere on the web.
 Rev. of Geo. Somewhere on the web..")
11
MCS role in genesis Convergence Divergence Convergence Div Con ? Fig. 14 from Houze (2004) Rev. of Geo. Somewhere on the web. Div Con Div Con
 Rev. of Geo. Somewhere on the web. Div Con Div Con.")
12
MCS role in genesis Div Con Div Con Stratiform Divergence Profile (SDP) Convective Divergence Profile (CDP) It is useful to consider genesis (step 2) to involve an atmospheric transition from a mean SDP to a mean CDP (e.g., Mapes and Houze 1995; Raymond et al. 1998).
..")
13
Genesis Theories Ritchie, Holland, Simpson: Top-down merger theory. + = ?

14
Outstanding Issues: 1. What does the corresponding divergence profile look like? …to this? Genesis Theories 2. How do we get from this,

15
Bister and Emanuel (1997): Top-down showerhead theory. a.Mid-level vortex advected down towards the surface, while evaporation of rain moistens the air progressively downward. b.Moistened cyclonic layer reaches the surface. Surface fluxes increase low-level theta_e. c.Near downdraft-free convection develops in the moist environment and converges cyclonic vorticity. Fig. 13 from Bister and Emanuel (1997) Mon. Wea. Rev. Genesis Theories Div Con Div Con
 Mon. Wea. Rev. Genesis Theories Div Con Div Con.")
16
Bister, and Emanuel (1997): Top-down showerhead theory. Outstanding Issues: 1.Downward advection of cyclonic vorticity leads to nearby changes in the opposite sense through tilting. 2.Divergence weakens vorticity magnitude near the surface. 3.Dry air inflow would inhibit the moistening process. 4.A moist neutral atmosphere is required for downdraft-free convection. (Zipser, per. com.) 5.But is downdraft-free convection or near downdraft-free convection necessary? Fig. 13 from Bister and Emanuel (1997) Mon. Wea. Rev. Genesis Theories
 5.But is downdraft-free convection or near downdraft-free convection necessary. Fig. 13 from Bister and Emanuel (1997) Mon. Wea. Rev. Genesis Theories.")
17
Montgomery,Enagonio: Bottom-up theory. Consider the interaction of the stratiform and convective vortices. Genesis Theories

18
Montgomery,Enagonio: Bottom-up theory. Fig. 12 from Montgomery and Enagonio (1998) JAS. Fig. 13 from Montgomery and Enagonio (1998) JAS. Genesis Theories
 JAS. Genesis Theories.")
19
Montgomery,Enagonio: Bottom-up theory. Assumptions: 1.Convective regions must develop in low-level cyclonic environment. 2. Sufficient number and/or size of convective regions are necessary for such an interaction to take place. Genesis Theories

20
Modeling Studies Chen and Frank (1993), modeling study:
, modeling study:")
21
Modeling Studies Chen and Frank (1993), modeling study: Convective region takes over.
, modeling study: Convective region takes over.")
22
Fig. 9b from Chen and Frank (1993) JAS Modeling Studies Chen and Frank (1993), modeling study: Convective region takes over. Grid resolution 25 km, hence minimum resolved updraft Scale is about 100 km. T = 4 hT = 8 h Stratiform remnant Con Div Con Div Fig. 8b from Chen and Frank (1993) JAS
 JAS Modeling Studies Chen and Frank (1993), modeling study: Convective region takes over. Grid resolution 25 km, hence minimum resolved updraft Scale is about 100 km. T = 4 hT = 8 h Stratiform remnant Con Div Con Div Fig. 8b from Chen and Frank (1993) JAS.")
23
Modeling Studies Chen and Frank (1993), modeling study: Issues: 1.The convective region quickly dwarfs the stratiform region. What happened? 2.Could this adequately represent the transformation from an SDP dominant MCS to a CDP dominant MCS in the real world? 3.Or is it just a product of an overly active convective paramaterization scheme, which forces updrafts on the minimum resolvable scale (~100 km)?
 .")
24
Modeling Studies Montgomery et al. (2006) modeling study: Illustrates a possible path from this, …to this?
 modeling study: Illustrates a possible path from this, …to this .")
25
Modeling Studies Montgomery et al. (2006) idealised modeling study: RAMS, near cloud resolving, non-hydrostatic, 2 and 3 km grid spacing. Intense cyclonic vortices develop on the convective scale (vortical hot towers, VHTs). VHTs interact to form larger more intense vortices (upscale vortex cascade). Net heating in the VHTs generates inflow above the boundary layer and system-scale convergence of angular momentum (System Scale Intensification, SSI).
 idealised modeling study: RAMS, near cloud resolving, non-hydrostatic, 2 and 3 km grid spacing. Intense cyclonic vortices develop on the convective scale (vortical hot towers, VHTs). VHTs interact to form larger more intense vortices (upscale vortex cascade). Net heating in the VHTs generates inflow above the boundary layer and system-scale convergence of angular momentum (System Scale Intensification, SSI)..")
26
Modeling Studies Montgomery et al. (2006) idealised modeling study: Vortex Upscale Cascade
 idealised modeling study: Vortex Upscale Cascade")
27
Modeling Studies Montgomery et al. (2006) modeling study: Vortex Upscale Cascade
 modeling study: Vortex Upscale Cascade")
28
Modeling Studies Montgomery et al. (2006) modeling study: Vortex Upscale Cascade
 modeling study: Vortex Upscale Cascade")
29
Modeling Studies Montgomery et al. (2006) modeling study: Vortex Upscale Cascade
 modeling study: Vortex Upscale Cascade")
30
Modeling Studies Montgomery et al. (2006) modeling study: Vortex Upscale Cascade
 modeling study: Vortex Upscale Cascade")
31
Modeling Studies Montgomery et al. (2006) modeling study: Vortex Upscale Cascade
 modeling study: Vortex Upscale Cascade")
32
Modeling Studies Montgomery et al. (2006) modeling study: Vortex Upscale Cascade
 modeling study: Vortex Upscale Cascade")
33
Modeling Studies Montgomery et al. (2006) modeling study: Vortex Upscale Cascade
 modeling study: Vortex Upscale Cascade")
34
Modeling Studies Montgomery et al. (2006) modeling study: System-Scale Intensification
 modeling study: System-Scale Intensification")
35
Modeling Studies Hendricks et al. (2004) modeling study: Vortex upscale cascade example Low- and mid-level vorticity distribution Low-level merger Mid-level anticyclonic absolute vorticity anomalies consistent with HM87 Ejection of anticyclonic absolute vorticity anomalies
 modeling study: Vortex upscale cascade example Low- and mid-level vorticity distribution Low-level merger Mid-level anticyclonic absolute vorticity anomalies consistent with HM87 Ejection of anticyclonic absolute vorticity anomalies.")
36
Modeling Studies Hendricks et al. (2004) modeling study:
 modeling study:")
37
Modeling Studies Davis and Bosart (2006) coming soon to QJRMS: 15 hours Squall line Bore front Deep convection, reduced downdrafts 10 m winds, Cloud top temperatures.
 coming soon to QJRMS: 15 hours Squall line Bore front Deep convection, reduced downdrafts 10 m winds, Cloud top temperatures.")
38
Modeling Studies 36 hours Relatively large cyclonic vortex results. 10 m winds, Cloud top temperatures. Davis and Bosart (2006) coming soon to QJRMS:
 coming soon to QJRMS:.")
39
Modeling Studies 48 hours Deep convection preferred to the east of the circulation centre. The small-scale vorticity anomalies were the result of relatively intense convection and heating on the scale of individual cumulonimbi or convective systems less than ~50 km in length. 10 m winds, Cloud top temperatures. Davis and Bosart (2006) coming soon to QJRMS:
 coming soon to QJRMS:.")
40
Modeling Studies 60 hours 10 m winds, Cloud top temperatures. Davis and Bosart (2006) coming soon to QJRMS: Deep convection preferred to the east of the circulation centre. The small-scale vorticity anomalies were the result of relatively intense convection and heating on the scale of individual cumulonimbi or convective systems less than ~50 km in length.
 coming soon to QJRMS: Deep convection preferred to the east of the circulation centre. The small-scale vorticity anomalies were the result of relatively intense convection and heating on the scale of individual cumulonimbi or convective systems less than ~50 km in length..")
41
Modeling Studies 72 hours 10 m winds, Cloud top temperatures. Davis and Bosart (2006) coming soon to QJRMS: Deep convection preferred to the east of the circulation centre. The small-scale vorticity anomalies were the result of relatively intense convection and heating on the scale of individual cumulonimbi or convective systems less than ~50 km in length.
 coming soon to QJRMS: Deep convection preferred to the east of the circulation centre. The small-scale vorticity anomalies were the result of relatively intense convection and heating on the scale of individual cumulonimbi or convective systems less than ~50 km in length..")
42
Modeling Studies 84 hours 10 m winds, Cloud top temperatures. Davis and Bosart (2006) coming soon to QJRMS: Deep convection preferred to the east of the circulation centre. The small-scale vorticity anomalies were the result of relatively intense convection and heating on the scale of individual cumulonimbi or convective systems less than ~50 km in length.
 coming soon to QJRMS: Deep convection preferred to the east of the circulation centre. The small-scale vorticity anomalies were the result of relatively intense convection and heating on the scale of individual cumulonimbi or convective systems less than ~50 km in length..")
43
TC develops on the poleward side (cyclonic shear) of the monsoon westerly surge. A number of low and mid-level PV anomalies merge/ are axisymmetrized into a central PV monolith. Shear tilts developing PV cores, whereas convection on the down-tilt side serves to realign them. 850 PV anomaly at the initial circulation centre is axisymmetrized into the PV monolith by 14 hours. Significant tilt on the developing PV monolith at 8,10 hours with strongest convection on the downtilt side. Continued convection on the downtilt side aligns the developing PV monolith. Tory et al. (2006): Elcho Island storm Modeling Studies
: Elcho Island storm Modeling Studies.")
44
00 Elcho Island Storm 850 hPa PV, wind 500 hPa PV, wind 250 hPa up motion 13 Pa/s 35 Pa/s

45
02 Elcho Island Storm 850 hPa PV, wind 500 hPa PV, wind 250 hPa up motion 13 Pa/s 35 Pa/s

46
04 Elcho Island Storm 850 hPa PV, wind 500 hPa PV, wind 250 hPa up motion 13 Pa/s 35 Pa/s

47
06 Elcho Island Storm 850 hPa PV, wind 500 hPa PV, wind 250 hPa up motion 13 Pa/s 35 Pa/s

48
08 Elcho Island Storm 850 hPa PV, wind 500 hPa PV, wind 250 hPa up motion 13 Pa/s 35 Pa/s

49
10 Elcho Island Storm 850 hPa PV, wind 500 hPa PV, wind 250 hPa up motion 13 Pa/s 35 Pa/s

50
12 Elcho Island Storm 850 hPa PV, wind 500 hPa PV, wind 250 hPa up motion 13 Pa/s 35 Pa/s

51
14 Elcho Island Storm 850 hPa PV, wind 500 hPa PV, wind 250 hPa up motion 13 Pa/s 35 Pa/s

52
16 Elcho Island Storm 850 hPa PV, wind 500 hPa PV, wind 250 hPa up motion 13 Pa/s 35 Pa/s

53
18 Elcho Island Storm 850 hPa PV, wind 500 hPa PV, wind 250 hPa up motion 13 Pa/s 35 Pa/s

54
20 Elcho Island Storm 850 hPa PV, wind 500 hPa PV, wind 250 hPa up motion 13 Pa/s 35 Pa/s

55
22 Elcho Island Storm 850 hPa PV, wind 500 hPa PV, wind 250 hPa up motion 13 Pa/s 35 Pa/s

56
24 Elcho Island Storm 850 hPa PV, wind 500 hPa PV, wind 250 hPa up motion 13 Pa/s 35 Pa/s

57
Modeling Studies Davis and Bosart (2006): Similar development to Montgomery, Hendricks. VHTs play an important role. Tory et al. (2006): Again similar development, except coarser resolution (~15 km grid spacing) leads to larger- scale features. Note: while genesis was underway downdrafts were present in all three higher resolution studies.
: Again similar development, except coarser resolution (~15 km grid spacing) leads to larger- scale features. Note: while genesis was underway downdrafts were present in all three higher resolution studies..")
58
Modeling Studies Modeling studies show a transition from mean SDP to mean CDP without the need for downdraft free convection. Downdraft free convection (or near downdraft free convection) may result in time. Good results using 0.15 grid spacing in TC-LAPS suggests genesis may be driven largely by scales resolvable by this model.
 may result in time. Good results using 0.15 grid spacing in TC-LAPS suggests genesis may be driven largely by scales resolvable by this model..")
59
Modeling Studies Hypothesis: 1.The development of multiple convective hot towers within an MCS drives the transition from mean SDP to mean CDP. 2. With sufficient cyclonic vorticity, continued convective activity, and mean CDP, a positive feedback will result, which will lead to even stronger CDP and weaker downdrafts (to satisfy continuity).
..")
60
Observations Until recently observations have been too sparse to assess the behavior predicted in the higher resolution modeling studies. Instead only profiles of MCS divergence, vorticity and vertical velocity have been determined from most field experiments.

61
Observations Kingsmill and Houze (1999) Updraft-downdraft interface
 Updraft-downdraft interface")
62
Observations Kingsmill and Houze (1999) Deep layer inflow
 Deep layer inflow")
63
Observations Kingsmill and Houze (1999) Saturated theta_e decreasing with height in updraft inflow.
 Saturated theta_e decreasing with height in updraft inflow.")
64
Observations Kingsmill and Houze (1999) High boundary layer theta_e The higher the BL theta_e is the longer lived and larger the MCSs tend to be.
 High boundary layer theta_e The higher the BL theta_e is the longer lived and larger the MCSs tend to be.")
65
Observations Kingsmill and Houze (1999) Very low theta_e mid-level inflow. Uncertain connection to the convective scale downdrafts.

66
Observations Kingsmill and Houze (1999) Uncertain connection to the convective scale downdrafts. Shallow patches of low theta_e air in the precipitating regions of the BL. ? VHTs ?

67
Observations VHTs? Montgomery et al. (2006) show low-level theta_e distribution consistent with Kingsmill and Houze. Shallow patches of low theta_e air in the precipitating regions of the BL.
 show low-level theta_e distribution consistent with Kingsmill and Houze. Shallow patches of low theta_e air in the precipitating regions of the BL..")
68
Observations Reasor et al. (2005) and Sippel et al. (2006) used ground based and airborne Doppler radar respectively to investigate some of the vorticity structures present during the formation of Hurricane Dolly and TS Allison. The development process was consistent with the modeling study of Hendricks et al. (2004). At some point in the development all three showed an area of enhanced low-level cyclonic vorticity, with a feeder band of discrete vortices spiralling toward the enhanced area.
 used ground based and airborne Doppler radar respectively to investigate some of the vorticity structures present during the formation of Hurricane Dolly and TS Allison. The development process was consistent with the modeling study of Hendricks et al. (2004). At some point in the development all three showed an area of enhanced low-level cyclonic vorticity, with a feeder band of discrete vortices spiralling toward the enhanced area..")
69
Observations Hendricks et al. (2004).Reasor et al. (2005) Feeder band Enhanced vorticity
.Reasor et al. (2005) Feeder band Enhanced vorticity")
70
Observations Hendricks et al. (2004).Sippel et al. (2006) Feeder band Enhanced vorticity
.Sippel et al. (2006) Feeder band Enhanced vorticity")
71
Where to from here? Genesis theories were influenced by a number of assumptions. Modeling studies prompt us to reconsider these assumptions. High-resolution observations (so far) seem to support the modeling studies. The assumptions: 1. Existance of the surface anticyclone below an MCS. - Is it an obstacle to be overcome? 2. The need for (near) downdraft-free convection. - Is it necessary for the transition from mean SDP to CDP? 3. The importance of the MCV. - Does the MCV need to extend to the surface before mean CDP? - Are MCVs always required to reduce L R and facilitate efficient transfer of heat to rotational momentum, or can the environment (e.g., monsoon low) be sufficiently cyclonic to do this?
 seem to support the modeling studies. The assumptions: 1. Existance of the surface anticyclone below an MCS. - Is it an obstacle to be overcome. 2. The need for (near) downdraft-free convection. - Is it necessary for the transition from mean SDP to CDP. 3. The importance of the MCV. - Does the MCV need to extend to the surface before mean CDP. - Are MCVs always required to reduce L R and facilitate efficient transfer of heat to rotational momentum, or can the environment (e.g., monsoon low) be sufficiently cyclonic to do this .")
72
Recommendations Establish a widely accepted genesis definition. Stage 1: the establishment of synoptic, sub-synoptic environment favorable for genesis. Stage 2: the mesoscale organisation of this environment into a warm-cored TC-like vortex. Continue investigating the thermodynamic evolution of MCSs in the tropical oceanic environment. Continue investigating the nature of vorticity enhancement in MCSs and their immediate environment. Determine why most tropical disturbances fail to become warm-cored, surface-concentrated vortices.

73
Vorticity Tendency Fundamentals (cont) This horizontal redistribution of PV ( a ) to build an upright vortex core, is achieved largely through horizontal convergence and a vertical advection-like effect. In isentropic coordinates, Note, the vertical (isentropic-normal) components of the two vectors J a and J n are zero. This is the basis of Haynes and McIntyres two statements on the previous slide. =density, Q = PV, Q =PV substance (PVS), J a and J n are the advective and non-advective fluxes respectively. ( Isentropic coordinates )
 components of the two vectors J a and J n are zero. This is the basis of Haynes and McIntyres two statements on the previous slide. =density, Q = PV, Q =PV substance (PVS), J a and J n are the advective and non-advective fluxes respectively. ( Isentropic coordinates ).")
74
Vorticity Tendency Fundamentals (cont) The tracer concentration will change when fluid leaves or enters the layer vertically. Convergent flow concentrates PVS = local PV enhancement. Isentropic surface Convergence concentrates the tracer

75
Vorticity tendency Fundamentals (cont) Blue arrows = updraft. Thin lines = vortex lines. Dashed lines = isentropic surfaces at t=0. Red arrows = vorticity vectors. Vorticity magnitude is inversely proportional to vortex line spacing. PV magnitude= the component of absolute vorticity normal to the isentropes.

76
Vorticity tendency Fundamentals (cont) Isentropic dipping leads to an increase in vorticity magnitude (red arrows) due to the movement of the isentropes into an area of higher vorticity magnitude. Vertical advection-like effect. Tilting of isentropes weakens the isentropic normal component of vorticity (i.e., PV) by increasing the angle between isentropic normal and the vortex lines. Tilting-like effect
 by increasing the angle between isentropic normal and the vortex lines. Tilting-like effect.")
77
Vorticity tendency Fundamentals (cont) In a deep convective updraft the isentropes will dip substantially relative to the fluid flow. In our TC genesis simulations this can lead to anticyclonic PV generation on the updraft edges, which suggests the isentropic surface has been tilted beyond parallel to the vortex line (relative to the fluid flow). Cyclonic PV Anticyclonic PV
. Cyclonic PV Anticyclonic PV.")
78
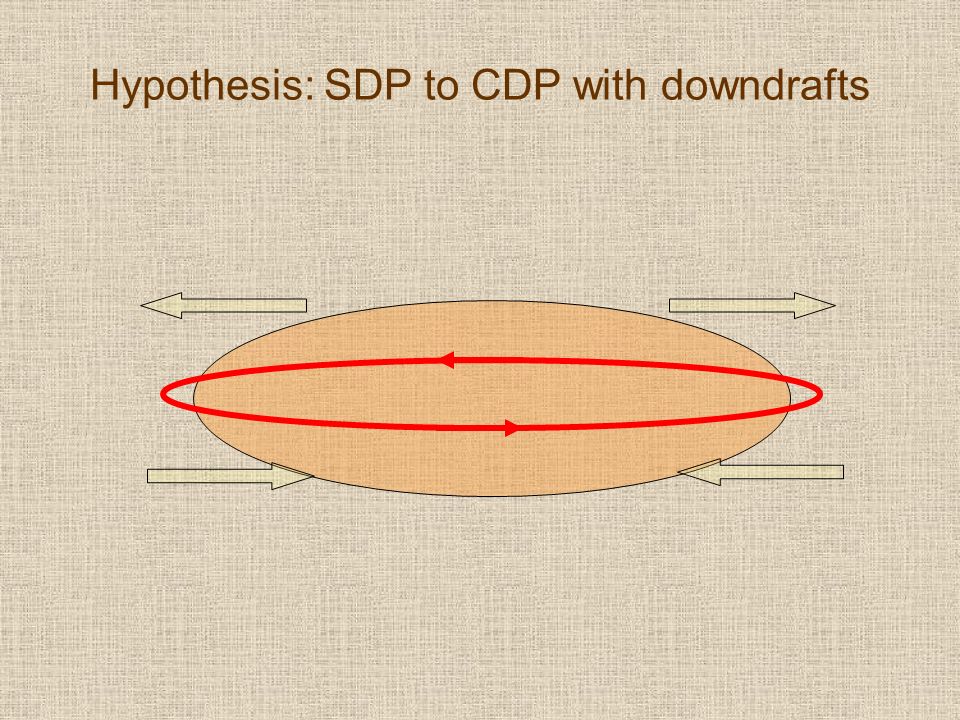
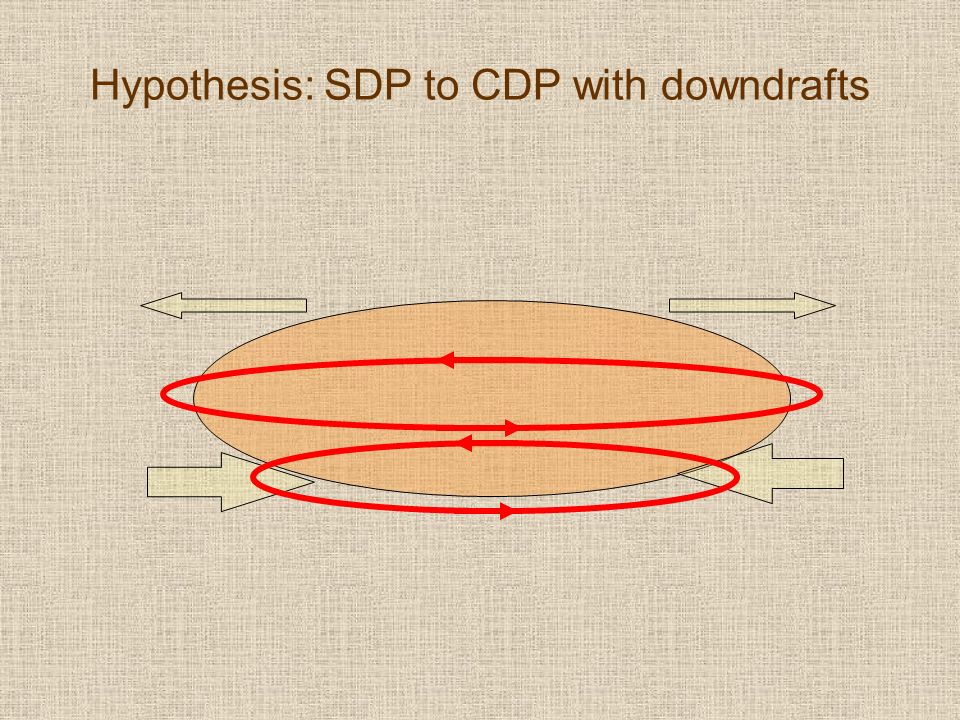
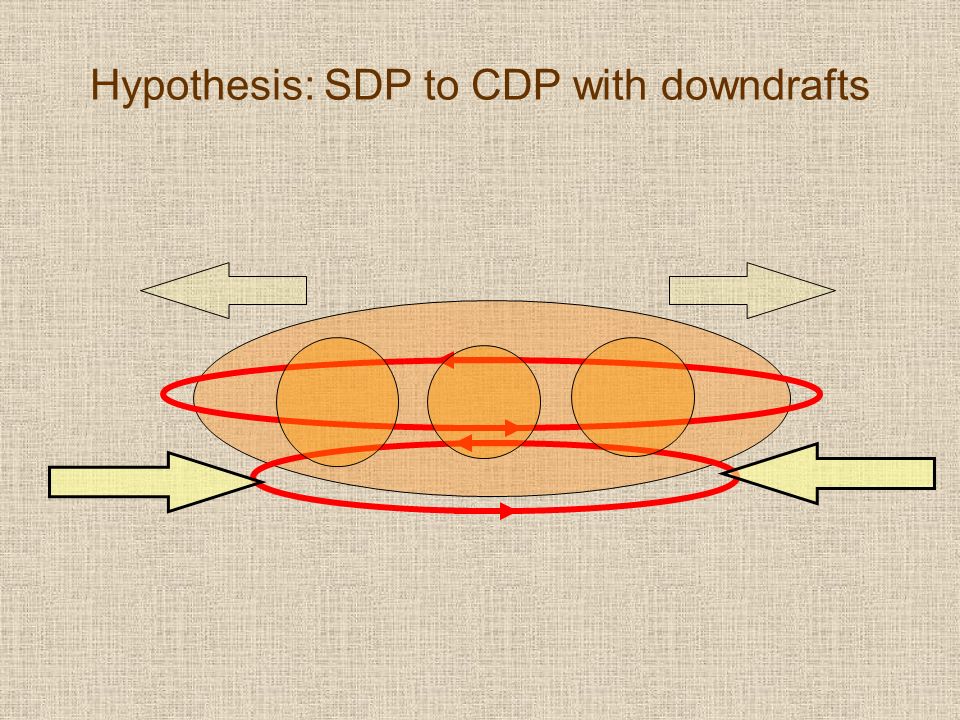
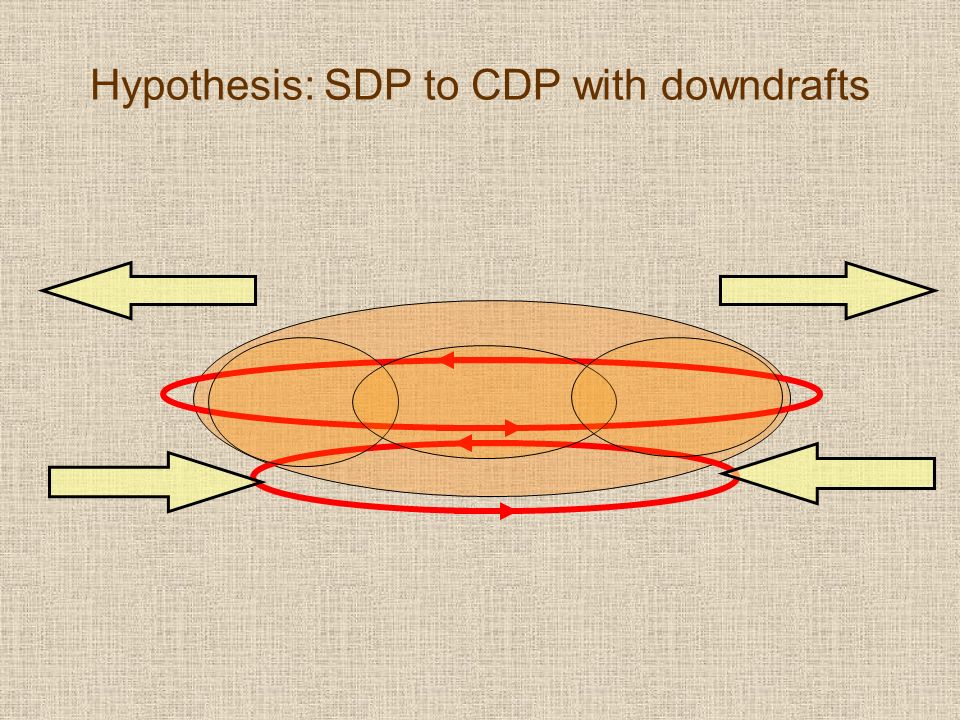
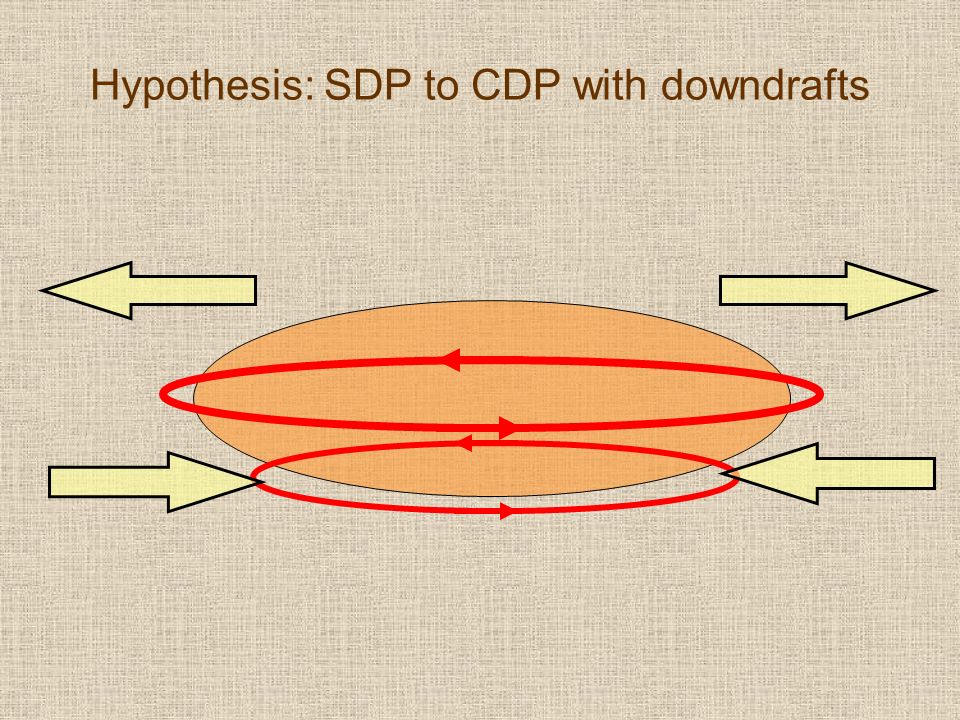
Hypothesis: SDP to CDP with downdrafts Rainfall ensures less evaporative cooling can take place in downdrafts than condensational heating in updrafts. Result: net heating. Heat energy is projected onto gravity waves and rotational modes. With an increased cyclonic environment (reduced Rossby deformation radius): (i)more energy will be projected onto the rotational mode, (ii)lower tropospheric convergence will be enhanced, and (iii)cyclonic vorticity will increase.
: (i)more energy will be projected onto the rotational mode, (ii)lower tropospheric convergence will be enhanced, and (iii)cyclonic vorticity will increase..")
79
Hypothesis: SDP to CDP with downdrafts

Similar presentations


>")


 We will now develop the Trenberth (1978)* modification to the QG Omega equation.>")
 that may contain a stratiform rain region.>")

 Chris Davis (NCAR ESSL/MMM and RAL) Stan Trier (NCAR ESSL/MMM) Boulder, Colorado 60-h Radar Composite Animation (00.>")


 and the Tropic of Capricorn (23.5S) The weather is very different.>")

 Weisman, M. L., 1992: The role of convectively generated rear- inflow jets in the evolution of long-lived mesoconvective systems. J. Atmos.>")


