Download presentation
Presentation is loading. Please wait.

1
Obesity Care Practices in the VHA: Documentation of Heights, Weights, & Obesity Diagnoses Polly Hitchcock Noël Veterans Evidence-based Research, Dissemination, & Implementation Center (VERDICT) VA HSR&D IIR 05-121-2
 VA HSR&D IIR")
2
Collaborators VERDICT/UT Health Science Center San Antonio: Copeland L, Hazuda H, Pugh MJ, Wang CP, McCarthy A, Bollinger M VA National Ctr for Health Promotion & Disease Prevention: Kahwati L, Jones KR Site PIs: Nelson K, Hoffman V, Dundon P, Tsevat J, Arterburn D, Foulis P, Mossop PA

3
BMI = wt (kg)/[ht (m)] 2
![BMI = wt (kg)/[ht (m)] 2](http://images.slideplayer.com/2/723408/slides/slide_3.jpg "BMI = wt (kg)/[ht (m)] 2")
4
Relevance MOVE! uses population-based approach to screening VHA indicator for screening introduced FY08 – national clinical reminder under discussion % of PC & MH patients screened with BMI & offered treatment if at-risk HEDIS/NCQA is developing & piloting obesity screening measure

5
Presentation Objectives A. What proportion of primary care patients had their hts & wts recorded in the EMR FY02- FY06? (screening) B. Among a cohort of primary care patients meeting BMI criteria for obesity in FY02: 1. What proportion had their hts/wts recorded in FY03-FY06? (monitoring) 2. What proportion received a diagnosis of obesity in FY02-FY06? (recognition)
 B. Among a cohort of primary care patients meeting BMI criteria for obesity in FY02: 1. What proportion had their hts/wts recorded in FY03-FY06. (monitoring) 2. What proportion received a diagnosis of obesity in FY02-FY06. (recognition).")
6
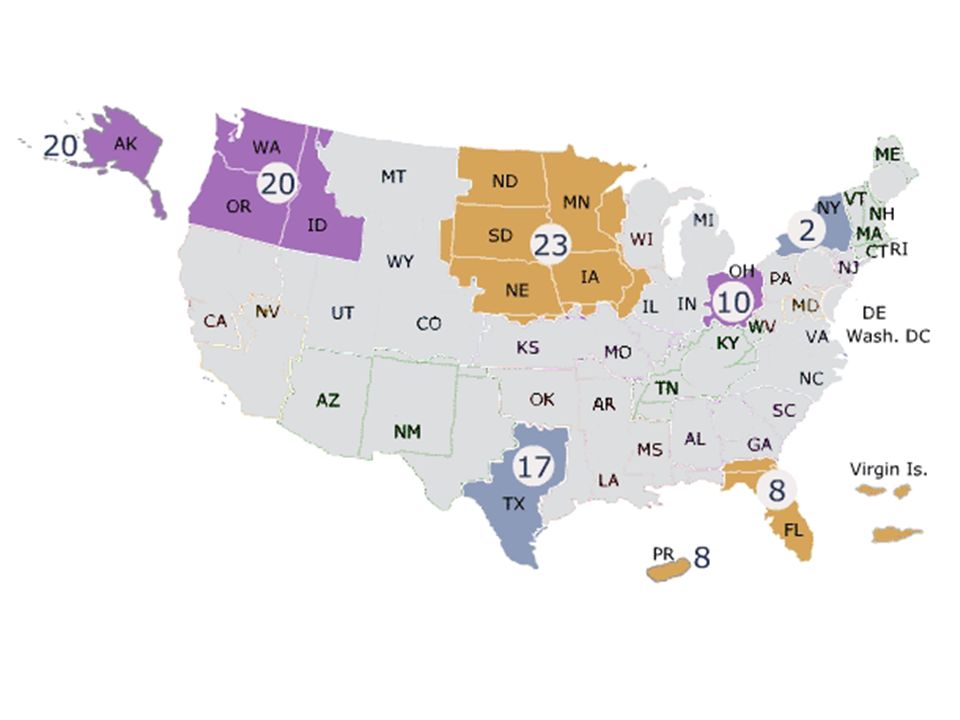
Design inception cohort of primary care patients with BMI > 30 heights & weights recorded in EMR in FY02 followed FY03-FY06 6 regions (VISNs) (early & late adopters of MOVE!)
 (early & late adopters of MOVE!)")
8
Data Sources Administrative Data: Sociodemographic, diagnostic, and utilization data from NPCD Pharmacy data from PBM Mortality data from MINI-VITALS Heights & weights obtained from VHAs new Corporate Data Warehouse (CDW)
")
9
Weight (& Height) Data Inherently variable over time changes in energy balance disease, surgery, injury, or aging Variety of sources/opportunities for error Measurement & reporting errors Data entry errors
 Data Inherently variable over time changes in energy balance disease, surgery, injury, or aging Variety of sources/opportunities for error Measurement & reporting errors Data entry errors")
10
Data Error Examples Among 847,976 primary care pts with multiple hts recorded in same year, 21,051 (2.5%) had hts differ by > 2 -10 inches Among 105,425 occurrences of pts > 2 wts recorded on same day, 10,054 (9.5%) had wts differ by >10-1,000 lbs
 had hts differ by > inches Among 105,425 occurrences of pts > 2 wts recorded on same day, 10,054 (9.5%) had wts differ by >10-1,000 lbs")
11
Obesity Screening > 1 PC visits each year for each VISN (where majority of care received) hts & wts recorded in EMR in their VISN for each FY02-FY06
 hts & wts recorded in EMR in their VISN for each FY02-FY06")
12
*Primary care population from 1,053,228 in FY02 to 1,342,688 in FY06

13
Cohort Identification > 1 PC visits in the 6 VISNs in FY02 (N=1,053,228) wts & hts filtered to remove biologically implausible values wt & ht FY02: 844,066 (80.1%) wt FY02 & ht FY02-06: 89,018 ( 8.5%) Total: 933,088 (88.6%)
 wts & hts filtered to remove biologically implausible values wt & ht FY02: 844,066 (80.1%) wt FY02 & ht FY02-06: 89,018 ( 8.5%) Total: 933,088 (88.6%)")
14
Cohort Identification: BMI Method 1 Maximum wt FY02 & Minimum ht FY02-FY06

15
Cohort Identification: BMI Method 1 Minimum ht/ Maximum wt N (%) BMI>30 371,842 39.9% BMI M (SD) 34.8 (4.8) BMI Range 30.0 – 161.8 # BMI > 70 252 # ht<60 in 7,078 # wt<170 lb 4,006 Among 933,088 PC patients with ht FY02 & wt FY02-FY06
 BMI>30 371, % BMI M (SD) 34.8 (4.8) BMI Range 30.0 – # BMI > # ht<60 in 7,078 # wt<170 lb 4,006 Among 933,088 PC patients with ht FY02 & wt FY02-FY06")
16
Cohort Identification: BMI Method 2 median wt for each quarter of FY02, then median of median wts mode of all ht values FY02-FY06; in case of > 2 modes: if diff < 3 inches, averaged if diff > 3 inches, eliminated

17
Cohort Identification & Refinement Minimum ht/ Maximum wt Modal ht/Md of Median wts N (%) obese 371,842 39.9%330,802 35.5% BMI M (SD) 34.8 (4.8)34.5 (4.4) BMI Range 30.0 – 161.830.0 – 95.4 # BMI > 70 25270 # ht<60 in 7,0782,968 # wt<170 lb 4,0062,553 Among 933,088 PC patients with ht FY02 & wt FY02-FY06
 obese 371, %330, % BMI M (SD) 34.8 (4.8)34.5 (4.4) BMI Range 30.0 – – 95.4 # BMI > # ht<60 in 7,0782,968 # wt<170 lb 4,0062,553 Among 933,088 PC patients with ht FY02 & wt FY02-FY06")
18
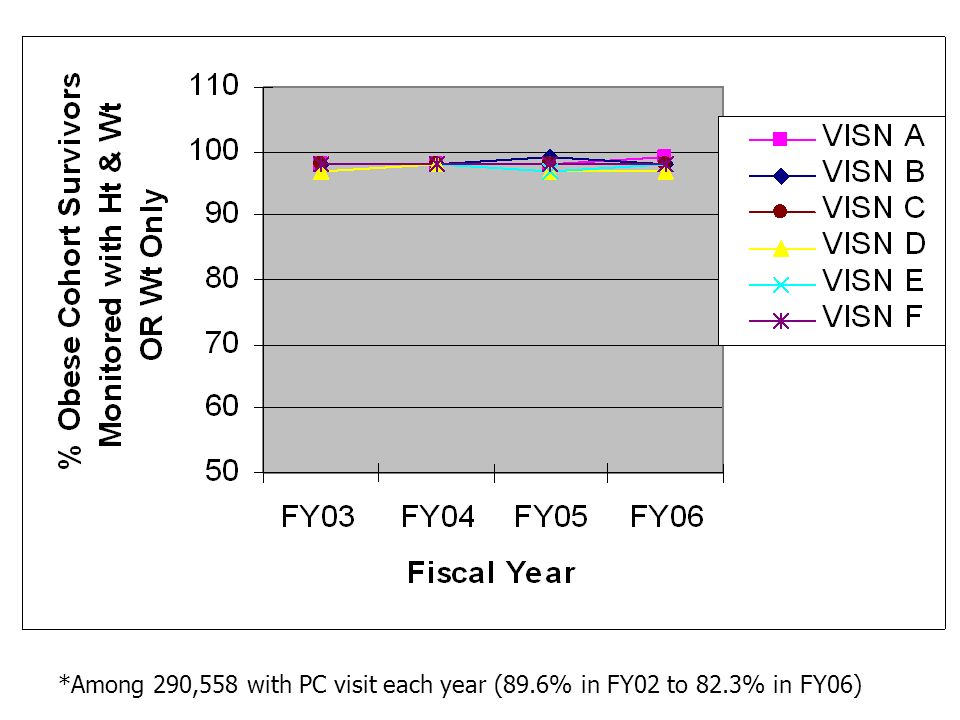
Obesity Monitoring Cohort survivors For those with PC visit, determined proportion with wt & ht (or wt only) recorded each year FY03-FY06
 recorded each year FY03-FY06")
19
Cohort Characteristics Survivors N=290,558 NonSurvivors N=40,244 BMI > 35 33% > 60 yrs 53%81% Male 94%97% Minority 16%15% Total Obese Cohort N=330,802

20
*Among 290,558 with PC visit each year (89.6% in FY02 to 82.3% in FY06)
")
22
Obesity Recognition Cohort survivors Proportion with ICD-9-CM codes 278, 278.00, 278.01, 259.9, V77.8 FY02 only and FY02-FY06

23
Cohort Survivors Diagnosed with Obesity Diagnosis in FY02? Diagnosis in FY02-06? Yes27%51% No73%49% Total Survivors 290,558

24
Obesity Dx in Cohort Survivors with Class I vs Class II+ Obesity Obesity Dx FY02-FY06?BMI < 35BMI > 35 Yes41% 72% No59%28% Total193,46297,096 p <.0001, Cohort Survivors N=290,558

25
Limitations administrative data hts, wts, & dxs may be entered in text fields & not captured by administrative data recording & data entry errors cohort may be misspecified obesity based on BMI not representative of entire VHA

26
Discussion Significant variation in screening & monitoring early MOVE! adopters performed better Characteristics of those not screened unknown Significant # do not have dxs or hts recorded – perceptions of importance? majority of cohort > 60 yrs BMI used to dose medications & calculate ventilation unit parameters implications for health services research

27
Next Steps Describe variations in other obesity care practices & factors that predict Examine the impact of obesity care practices on BMI and other important clinical outcomes Identify longitudinal patterns (latent classes) of BMI trends over time
 of BMI trends over time")
28
Q U E S T I O N S ?

Similar presentations


 Results Implications Discussion Acknowledgment BIOPSYCHOSOCIAL PREDICTORS OF OBESITY IN BIOPSYCHOSOCIAL.>")


 Why Worry About Men? Addressing mens sexual and reproductive health will help.>")


 Department of Veterans Affairs Washington, DC.>")


