Download presentation
Presentation is loading. Please wait.

1
Use of regularly migrating non-biological platforms as vehicles for spatio-temporal sampling of Southern Ocean systems Simon Wright, Brian Griffiths, Bronte Tilbrook, Steve Rintoul, Alain Poisson

2
25 Jan 200310 Feb 2003 26 Feb 2003

3
How to model microbial populations? Recognize different types of communities Key species and associations When and where do they occur? Time of season Oceanographic conditions MLD, nutrients, ice, etc Parameterize the community properties Primary production, respiration Aggregation Sedimentation Size distribution

4
What would a Southern Ocean Observing System look like?

5
Regularly Migrating Non-Biological Platforms Seagoing Hydro-Investigative Platforms (SHIPs) (RMNBPs)
 (RMNBPs)")
6
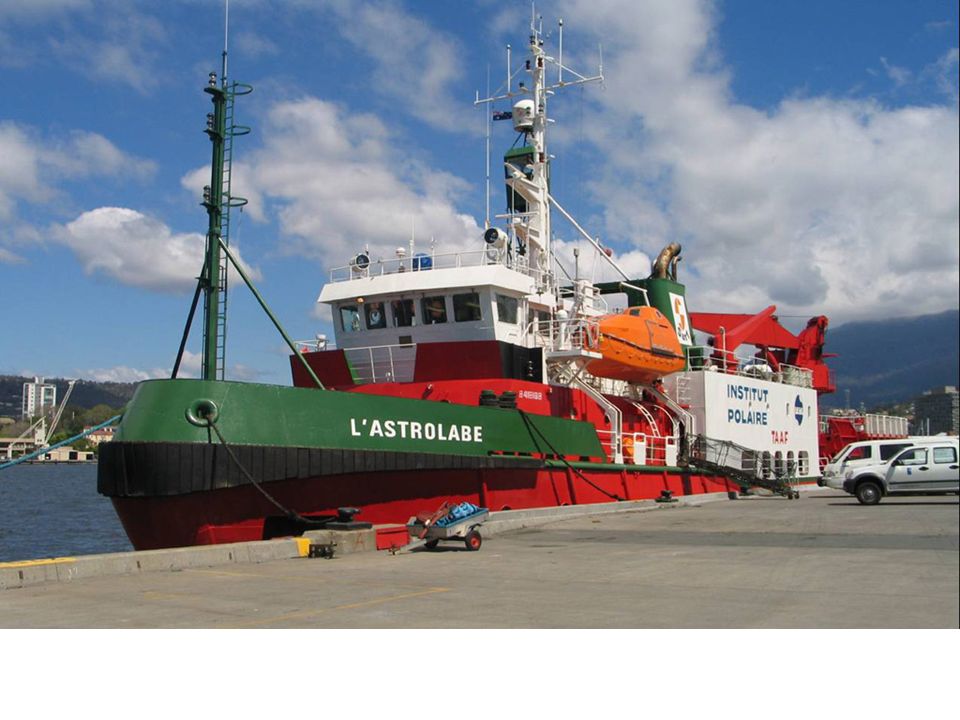
Aurora Australis LAstrolabe

7
Programmable Ecological Observing Package (Live Elements) (PEOPLE)
 (PEOPLE)")
8
Three pronged approach Monitoring on repeat transects lAstrolabe Intensive oceanographic surveys Aurora Australis Process studies in minicosms Coupled with laboratory experiments

9
Aurora Australis

11
ASF Tmin Pycnocline

12
ASF Tmin Pycnocline

13
Disadvantage of Aurora Australis erratic migratory route

14
Three pronged approach Monitoring on repeat transects lAstrolabe Intensive oceanographic surveys Aurora Australis Process studies in minicosms Coupled with laboratory experiments

16
Sokolov & Rintoul 2002 Regular monitoring of Hobart - Dumont dUrville 3 – 4 repeat transects per season

17
Astrolabe lab in hold

18
Astrolabe lab interior

19
lAstrolabe repeat transects –Oceanography: XBT sections, nutrients: Steve Rintoul, CSIRO alkalinity –Alain Poisson IPEV, Paris –Phytoplankton: Chlorophyll fluorometry, FRRF –Brian Griffiths, CSIRO HPLC pigments, Species ID and counts (whole and net), coccolithophorid counts –Australian Antarctic Division –Carbon dioxide: pCO 2 Bronte Tilbrook, CSIRO
, coccolithophorid counts –Australian Antarctic Division –Carbon dioxide: pCO 2 Bronte Tilbrook, CSIRO")
20
CO2 drawdown Chlorophyll a Astrolabe 2002/03

21
CO2 drawdown Chlorophyll a Astrolabe 2002/03

22
Oct | Nov | Dec | Jan | Feb | Mar

23
Date of bloom at mid latitude (53- 60ºS) SeasonBloom peak 1997-983 Dec 1998-9919 Dec 1999-0001 Jan 2000-0109 Jan 2001-0225 Jan 2002-0310 Feb 2003-0410 Jan 2004-0515 Dec
 SeasonBloom peak Dec Dec Jan Jan Jan Feb Jan Dec")
24
Oct | Nov | Dec | Jan | Feb | Mar

26
Bloom dynamics at mid latitude (53- 60ºS) 2002 - 2003 Bloom in Feb about 1 ug Chl a/ L Dominant species – F. kerguelensis, Phaeocystis, Trichotoxon, Thalassiothrix, Pseudonitzschia 2003 – 2004, 2004 – 2005 (Typical) Bloom in Dec - Jan about 0.8 - 1 ug Chl a/ L Dominant species F. kerguelensis, Pseudonitzschia, Trichotoxon, Chaetoceros dichaeta
 Bloom in Dec - Jan about ug Chl a/ L Dominant species F. kerguelensis, Pseudonitzschia, Trichotoxon, Chaetoceros dichaeta.")
27
Oct | Nov | Dec | Jan | Feb | Mar

32
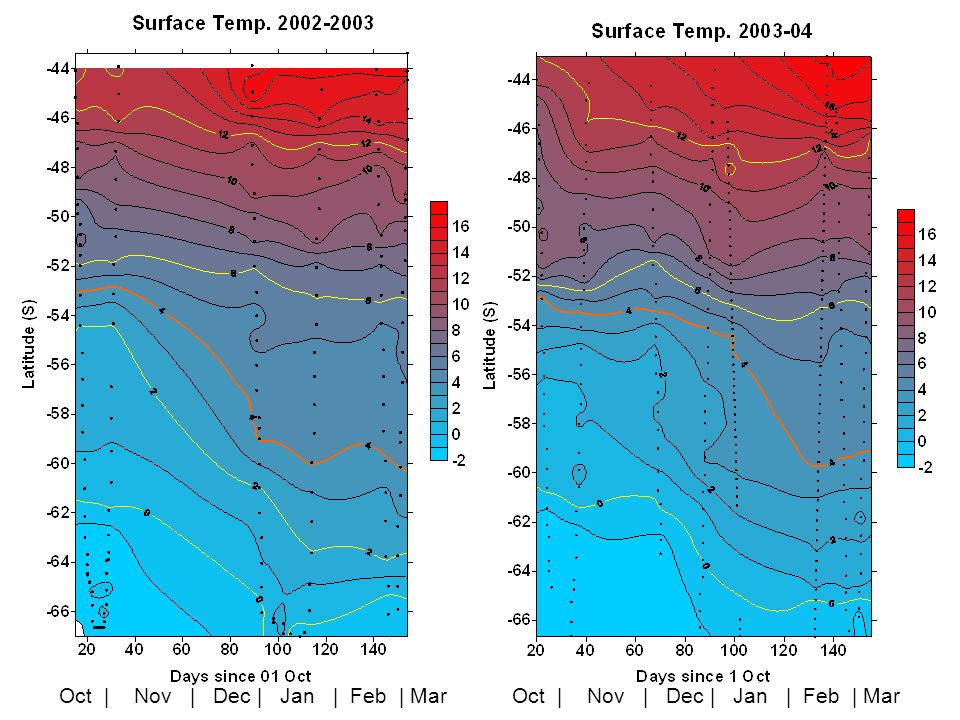
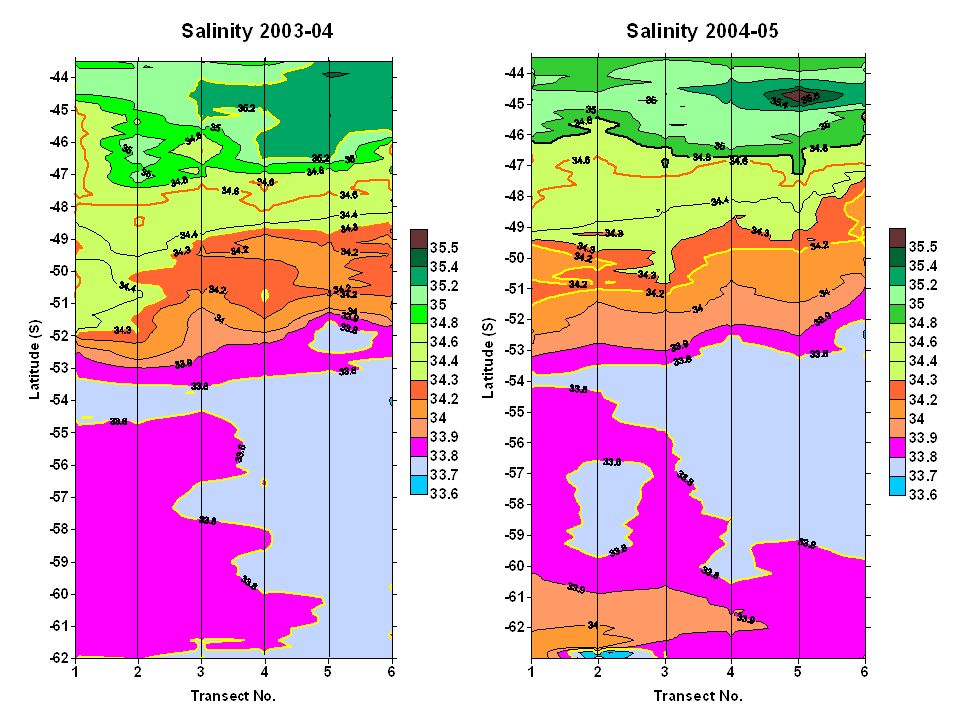
Bloom dynamics at mid latitude (53- 60ºS) The late bloom in 2002-2003 was associated with relatively warm, very low salinity water This water had low nutrient concentrations. A bloom developed only after nutrient concentrations increased

33
Conclusions Regular sampling of Southern Ocean from lAstrolabe identified seasonal patterns in microbial populations –relationship to carbon dioxide uptake –Relationship to nutrient drawdown Substantial interannual differences in bloom dynamics appeared to be driven by seawater chemistry An anomalous late bloom developed only after nutrient concentrations increased in a large area of warm low salinity water. A small subset of total data: made possible by repeated sampling of many parameters in a collaborative program

34
lAstrolabe repeat transects –Organization: –Alain Poisson IPEV, Paris –Bronte Tilbrook, CSIRO –Acknowledgements –Captain and crew S.V. lAstrolabe –Many volunteer samplers

35
What should a SOOS look like? –Regular transects along the same transect

36
What should a SOOS look like? –Oceanography: Thermosalinograph XBT sections, nutrients Alkalinity Carbon dioxide: pCO 2 –Atmospheric Carbon dioxide, oxygen, DMS Dust –Environment Temperature, radiation, wind speed, wave height, ice –Plankton: Chlorophyll fluorometry, FRRF HPLC pigments, Species ID and counts (whole and net) Continuous plankton recorder
 Continuous plankton recorder.")
Similar presentations


 and Fluorometric Analyses of Phytoplankton Pigments at a Scottish Coastal Ecosystem Monitoring Site Kerry.>")
 and Emiliania huxleyi (Coccolithophores) under different light regimes Emily Rogalsky, Oscar Schofield,>")


 Problem Description: Networked Aquatic Microbial Observing System (NAMOS) Proposed.>")

 CMORE Cruise, July 30 - August 14, 2008 Objective: To explore the potential and limitations of perturbation experiments.>")
