Download presentation
Presentation is loading. Please wait.

1
Climate and Meteorology 4
Send kids a copy of the help file to use in the session

2
Introduction: Collect hourly weather data for one day Make weather station models of the data. Graph weather data. Write analysis and reflection of the lab.

3
Objective The objective of this lab assignment is to determine how we can use weather data to predict the weather.

4
Problem How can we use the relationships among weather data to produce a forecast?

5
Prediction What will the weather be like at the location of your choice> Why?

6
Materials and Procedures
Use the National Weather Service site to choose a location for your hourly observations. All 24 hours are already recorded – you don’t have to do this yourself!!

7
Weather.noaa.gov

8
Now we choose a location – any location!

9
This is what you should see now…

11
Insert Table 8 columns, 24 rows
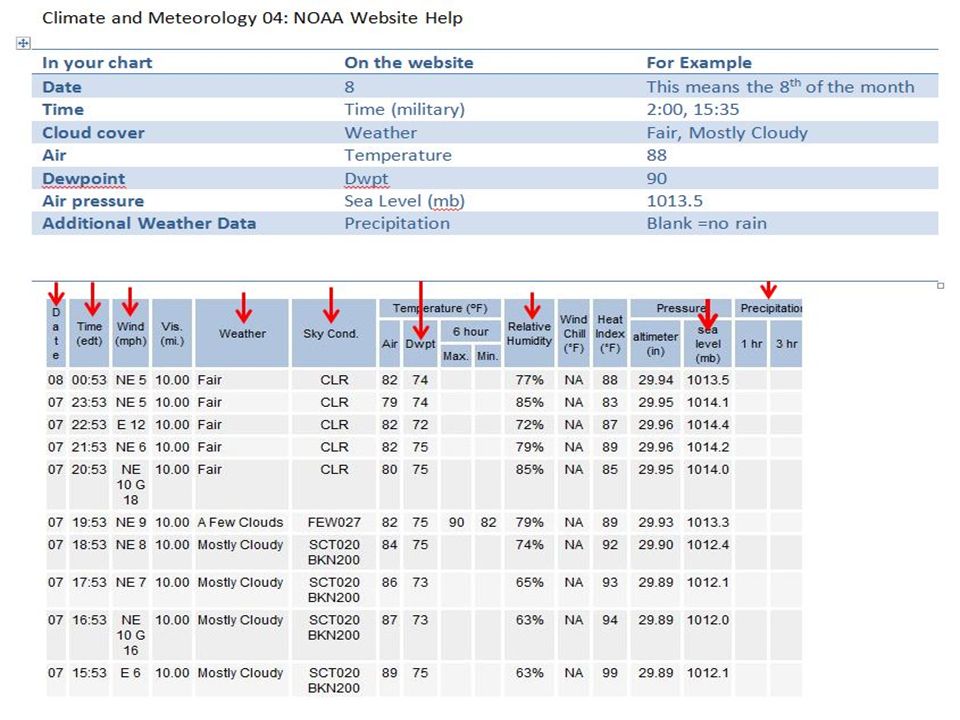
Weather Data-Location: Titusville, Fl Date: September 7th and 8th Time Temp(F) Air Pressure Humidity Cloud Cover Wind Speed and Direction Dew Point (F) Add’l Weather Data 00:53 82 1013.5 77% None NE 5 mph 74 none IF NEEDED: How to read it and how to make the table – include location and date!
 Air Pressure. Humidity. Cloud Cover. Wind Speed and Direction. Dew Point (F) Add’l. Weather Data. 00: % None. NE 5 mph. 74. none. IF NEEDED: How to read it and how to make the table – include location and date!")
12
What does the Sky Conditions column mean?
CLR = clear FEW = partly cloudy SCTD= scattered clouds BKN= very cloudy OVC= overcast NA = no information available Lost in translation?

13
Why is it important to be able to predict the weather?

14
Weather Station Models: You might not have 4 am and 4 pm exactly, use the time closest to them Be sure to do both!! Don’t try to add the info to the weather station model! Use the Labels!

15
This says“ It’s 76 out, the dewpoint is 55, it’s raining, the wind is out of the northeast at knots and it’s overcast, the pressure is mB, and it’s decreased by about 0.03 mB in the last 3 hours”

16
Why would a weather station model be used instead of saying all the weather conditions?

17
82 F 74 F 1013.5 5 mph

18
This is the part with the graphs!
Part III: Creating Graphs (30 Points) Time on the X axis Temperature for the Y axis Include units and add titles to the graphs. Use Copy and paste the sharedURL in the space below. Example: We want time on the x axis both times because it is the independent variable – the one that stays the same for both graphs.
 Time on the X axis. Temperature for the Y axis. Include units and add titles to the graphs. Use Copy and paste the sharedURL in the space below. Example: id=9611ba43aa. We want time on the x axis both times because it is the independent variable – the one that stays the same for both graphs.")
19
Dew point Temperature and Air Temperature
I know what air temperature is …dew point???

20
Dew point Temperature and Air Temperature
Dew point is the temperature that the air is saturated with water vapor– think of humidity. High dew point temperatures – 70 and above – tend to be more humid, and can feel uncomfortable. If the dew point is high, there is a better chance there is fog, severe humidity, or even rain. When the air temperature is high, you sweat to cool down – if the dew point temperature is high, your sweat doesn’t evaporate, making you feel sticky and hot!

21
Let’s make a graph!

22
This is what they will see when they get to the web site – The next slide has the arrows

23
Change the chart type to line, Chart title is Temperature and Dew Point – X axis is time and Y axis has Dew point and Temp

24
Fill in Time information and dewpoint or temperature first, then click Group + to add the second set of data, this is shown on the next slide

25
Once they fill in all the data, it should look something like this
Once they fill in all the data, it should look something like this. No, I am not waiting 20 minutes for you to complete this right now – I will show you how to modify the chart ok?Click Create chart

26
This is a completed chart – you can change the format at the bottom, and you can click Modify to add the data you need.

27
Under the chart is the link to paste into your lab report!

28
Air Pressure Graph What do you think air pressure is?

29
Air pressure in our lives
We check air pressure in our tires – if it’s low, the tires go flat! When you go up in an airplane or climb a very tall mountain, air pressure decreases. WHY?

30
When you go up in an airplane or climb a very tall mountain, air pressure decreases. WHY?
There is less air. Zero air pressure creates a vacuum – think of outer space No air pressure is not pretty for people! Changes in air pressure causes the wind to blow- Warm, low density air (low air pressure) rises, cool, higher density air sinks in to replace it. Wind speed and direction is predicted using air pressure Why does this matter?
 rises, cool, higher density air sinks in to replace it. Wind speed and direction is predicted using air pressure. Why does this matter")
31
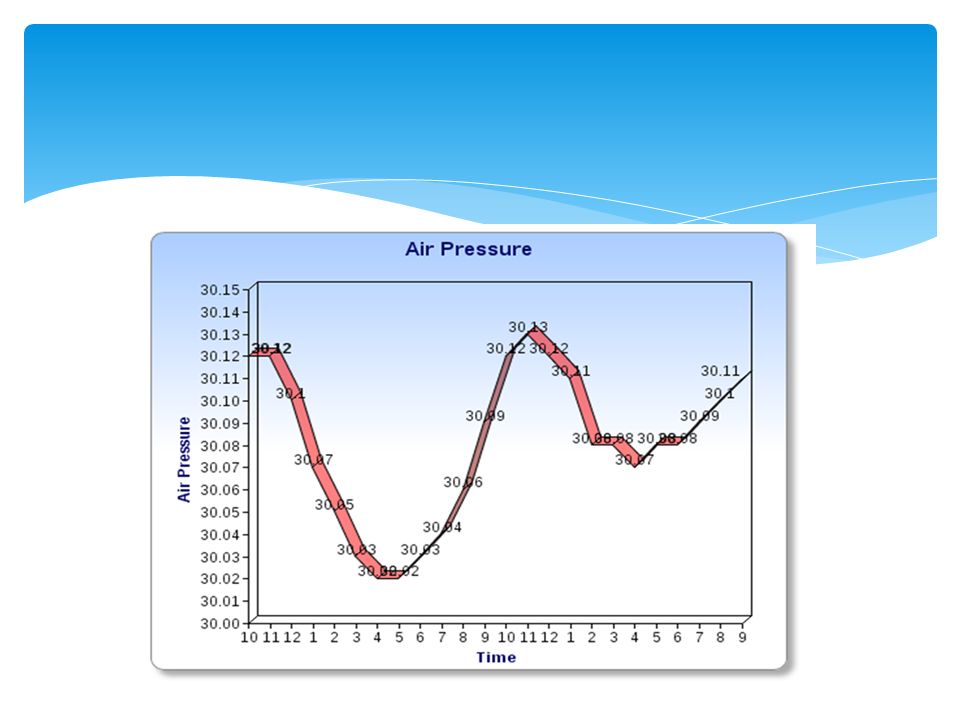
Now create the Air Pressure Graph
Chart title: Air Pressure X title: Time Y title: Air Pressure

33
Analysis and Conclusions
In your own words, write an analysis of the weather that occurred on the day you selected, based on the surface weather station models you created. What was the weather like that day??

34
Reflection Questions:(12 points)
1. What did you learn about weather forecasting by completing the activity?

35
2. In your own words, how are weather data used to make forecasts?

36
3. In your own words, what is the relationship between temperature, dew point, and air pressure? Think about the graphs and what we discussed! High pressure = low temperature low pressure = high temperature Higher dewpoint temps make you feel sticky and uncomfortable, and when the dewpoint temp is close to the air temp there is more moisture in the air. Extremely low dewpoints make the air dry and can make your skin feel very dry

37
4. Did your findings support your weather predictions
4. Did your findings support your weather predictions? What are the possible sources of error? (I read it wrong is not always a reason!)
")
Similar presentations


>")


 = 1 atmosphere 1 atmosphere.>")


