Download presentation
Presentation is loading. Please wait.

2
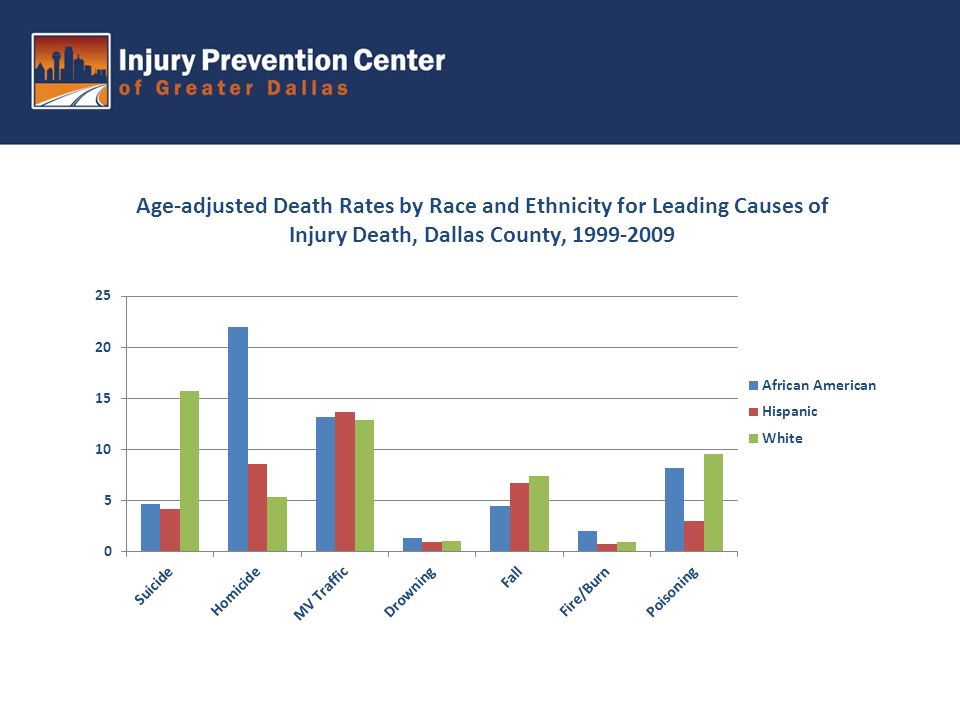
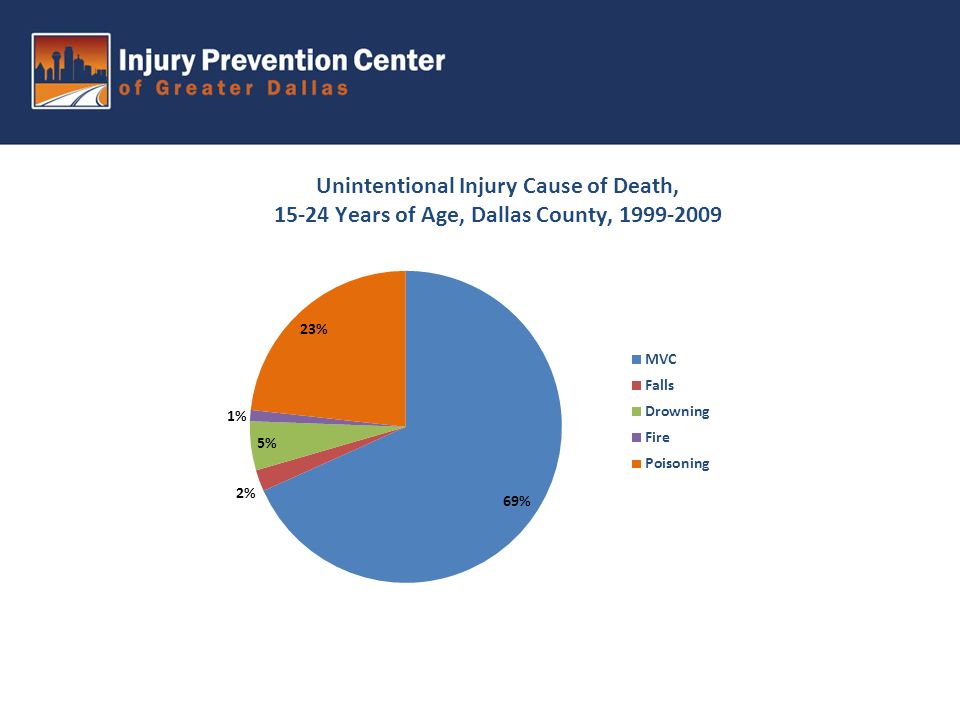
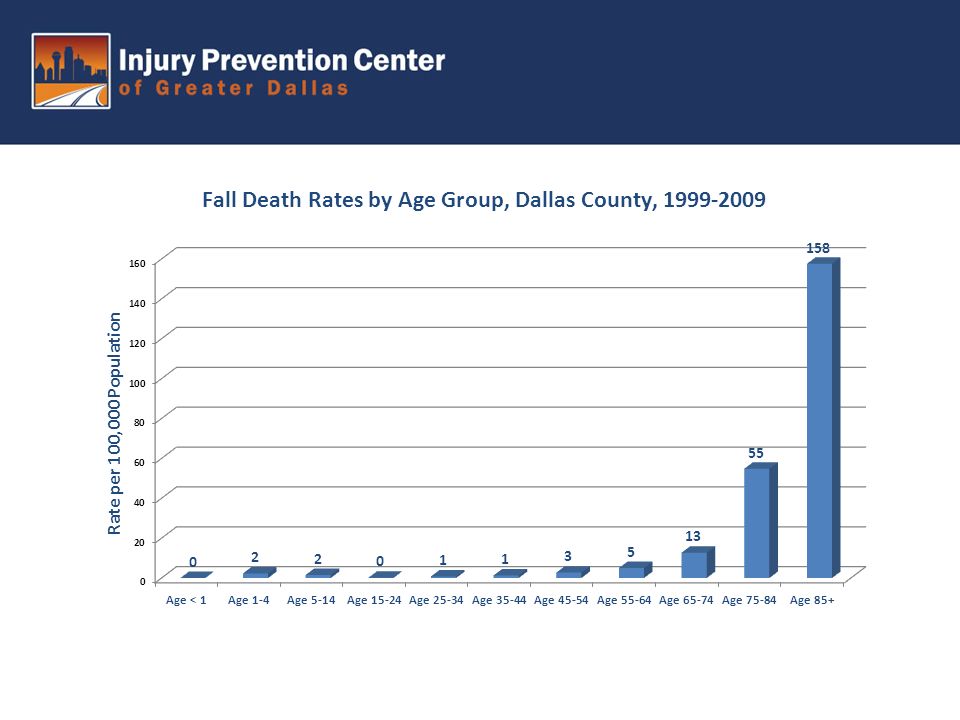
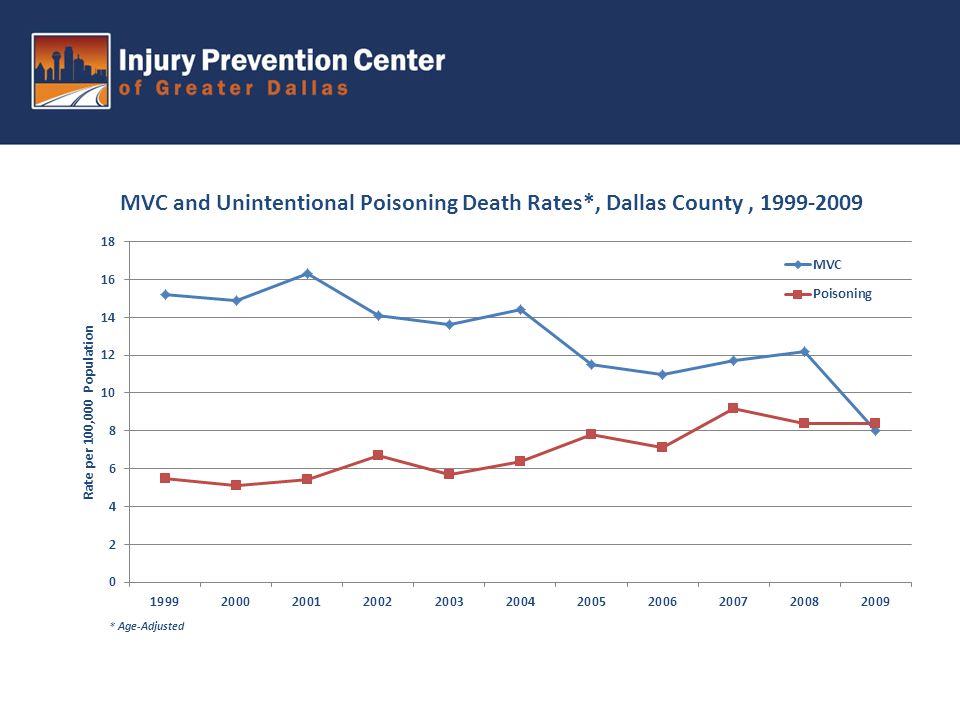
Cause19992000200120022003200420052006200720082009Total% MVC298321361318310323267254270278188318825% Drowning21352428251827251824302752% Poison114113122147130146176168218201203173813% Falls959982769711310011513012716011949% Fires/Burns2917232621191715 19212222% Suicide205178224230217203216198232213245236118% Homicide200256297258256275243227254227214270721% Other125104 1141201121271289496121124510% Total1087112312371197117612091173113012311185118212930100% Number of Injury Deaths by Causes and Year of Death, Dallas County, 1999-2009 Source: Texas Department of State Health Services

Similar presentations


>")


 WALES (2002-2012) © National Confidential.>")


