Download presentation
Presentation is loading. Please wait.

1
Farm Data Dashboards: USDA and Microsoft Innovation Challenge Dr. Brand Niemann Director and Senior Data Scientist/Data Journalist Semantic Community Data Science USDA Data Science MOOC Big Data Science for Precision Farming Business Web Player July 27, 2015

2
Dr. Brand L. Niemann Brand Niemann is a data scientist / data journalist who grew up working on a farm in Nebraska. He was asked by the USDA to create awareness and access to USDA data in partnership with their Open Data Communications Plan. He created the USDA Data Science MOOC (Massive Open Online Course). Brand is a former Senior Enterprise Architect and Data Scientist with the US EPA, who organizes the Federal Big Data Working Group Meetup - a meetup that regularly attracts hundreds of the top data scientists in and around Washington D.C. He has worked as a data scientist for a number of organizations, produced data science products for a large number of data sets, and published data stories for Federal Computer Week, Semantic Community and AOL Government.
. Brand is a former Senior Enterprise Architect and Data Scientist with the US EPA, who organizes the Federal Big Data Working Group Meetup - a meetup that regularly attracts hundreds of the top data scientists in and around Washington D.C. He has worked as a data scientist for a number of organizations, produced data science products for a large number of data sets, and published data stories for Federal Computer Week, Semantic Community and AOL Government..")
4
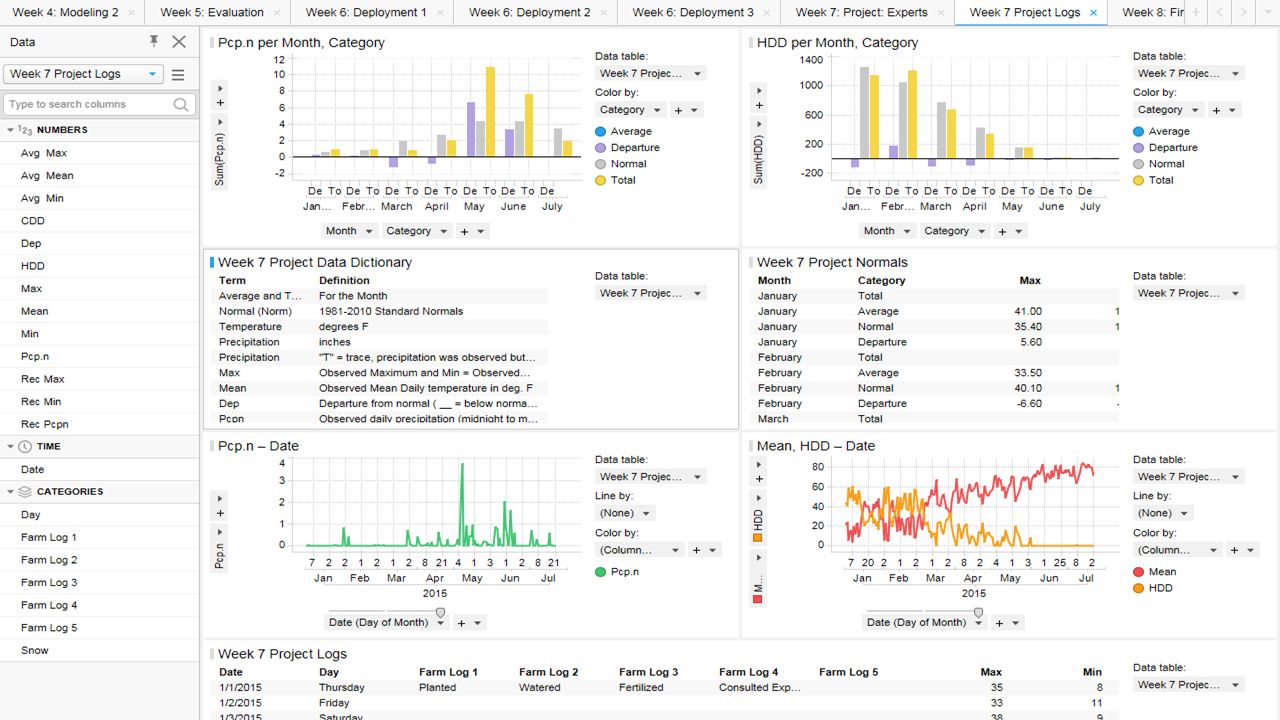
Teaching Farmers to Work with Big Data HeatSpring, an online course provider, found my USDA Data Science MOOC, and asked me to do an 8-week Data-Driven Farming Course (October 26-December 18, 2015). This online course uses the Tools and Data Sets in US Climate Resilience Toolkit (Taking Action Case Studies of Resilience in Action) to help farmers and data scientists plan for how current and future climate changes might influence food systems. The online course uses the Cross Industry Standard Process for Data Mining (CRISP-DM) and shows farmers how to develop a Farm Data Viewer and Farm Data Decision Dashboard.
 to help farmers and data scientists plan for how current and future climate changes might influence food systems. The online course uses the Cross Industry Standard Process for Data Mining (CRISP-DM) and shows farmers how to develop a Farm Data Viewer and Farm Data Decision Dashboard..")
6
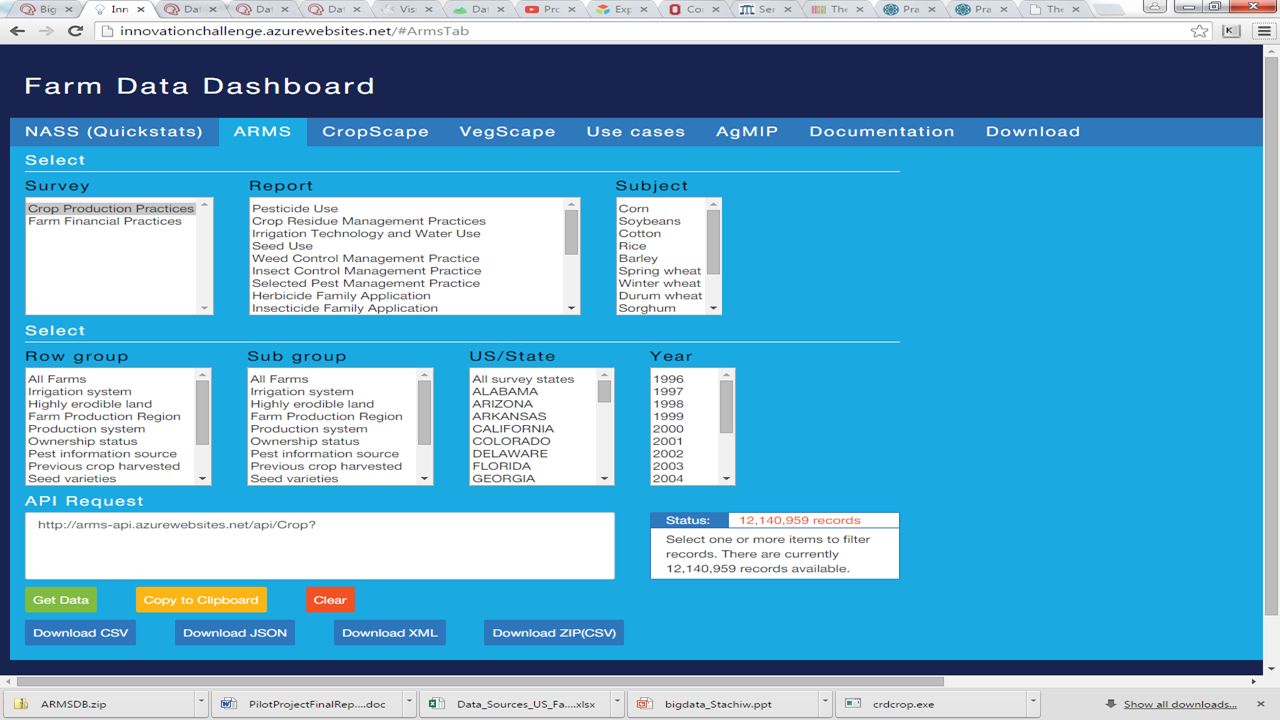
USDA, Microsoft to Launch “Innovation Challenge” Top Prize of $25K Offered for Most Creative Application on Food Resiliency and Data Science. WASHINGTON, July 27, 2015 - The U.S. Department of Agriculture is partnering with Microsoft to launch the “Innovation Challenge,” a competition to develop software applications that help farmers, agriculture businesses, and consumers explore how climate change will affect their food systems. Entrants are invited to develop and publish new applications and tools that can help users analyze multiple sources of information, including key USDA data sets. The Food Resilience theme of the challenge seeks to inspire the creation of tools that help users analyze and explore our food systems. For more than 100 years, USDA has compiled data from economic reports, satellite imagery, remote sensors, and surveys on crop production practices, financial outcomes, demographics and remote sensing products on the health of crops around the country. http://usdaapps.challengepost.com

7
Requirements What to Create: Submit a working, interactive application that integrates one or more of the required USDA datasets. Static data visualizations will not be eligible. Applications must include interactive functionality (e.g. the user can change parameters to update the visualization and/or result). My Note: I use interactive data visualization functionality Eligible Platforms: Smartphone or tablet (iOS, Android, Blackberry, Kindle, Windows 8 Mobile) My Note: Yes Web (mobile or desktop) My Note: Yes Desktop (Windows PC, Mac Desktop) My Note: Yes Software running on other publicly available hardware (including, but not exclusive to, wearable technology, open source hardware, etc.) My Note: Yes Supplemental Material: You must submit a demo video (hosted on YouTube, Vimeo, or Youku) that walks through the main functionality of the application via screencast or video. You must also submit a text description and at least one image/screenshot of your working application. My Note: Yes Testing: You must make your app available for testing by providing a link to access your installation file, an uploaded installation file, a beta distribution build, etc. See full testing access options. My Note: Yes New & Existing Solutions: Apps may be newly created or pre-existing. If the submitted app existed prior to the competition’s submission start date, it must have been updated to integrate the required USDA data during the submission period. My Note: Yes
. My Note: I use interactive data visualization functionality Eligible Platforms: Smartphone or tablet (iOS, Android, Blackberry, Kindle, Windows 8 Mobile) My Note: Yes Web (mobile or desktop) My Note: Yes Desktop (Windows PC, Mac Desktop) My Note: Yes Software running on other publicly available hardware (including, but not exclusive to, wearable technology, open source hardware, etc.) My Note: Yes Supplemental Material: You must submit a demo video (hosted on YouTube, Vimeo, or Youku) that walks through the main functionality of the application via screencast or video. You must also submit a text description and at least one image/screenshot of your working application. My Note: Yes Testing: You must make your app available for testing by providing a link to access your installation file, an uploaded installation file, a beta distribution build, etc. See full testing access options. My Note: Yes New & Existing Solutions: Apps may be newly created or pre-existing. If the submitted app existed prior to the competition’s submission start date, it must have been updated to integrate the required USDA data during the submission period. My Note: Yes.")
8
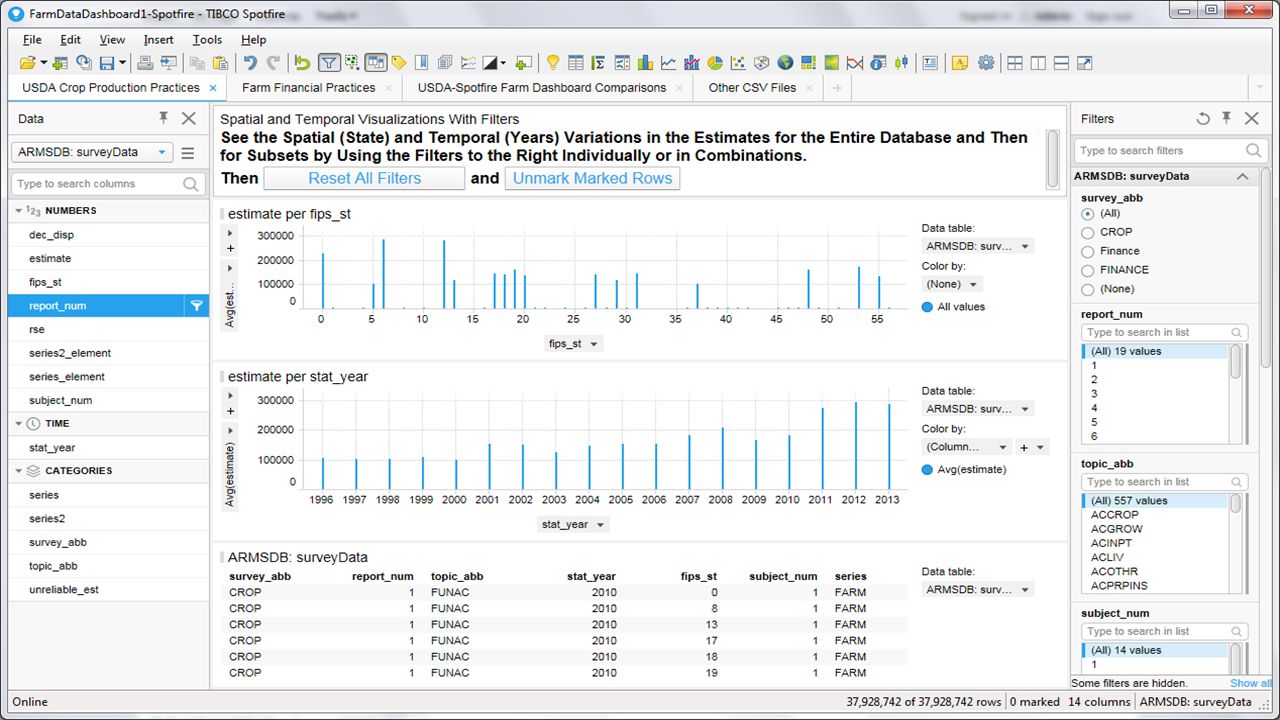
Results Data Science Audit of the USDA and Microsoft Innovation Challenge for Food Resilience: Comments transmitted to USDA CIO and CDO and Captured in Online Knowledge Base. USDA Data Science MOOC, NASS QuickStats 2.0, and Big Data Science for Precision Farming: Data Science Data Publications with Knowledge Bases, Excel Spreadsheets, and Spotfire Analytics and Visualizations. USDA Farm Data Dashboard-Spotfire Farm Data Dashboard Comparisons: USDA Eight Tabs Versus Spotfire 25 Tabs. ARMS 7 Filters Versus Spotfire 9 Filters. ARMS Get or Download Data Versus Spotfire See All 35,928,742 Rows by 14 Columns of the Data! ARMS Has Number of Records Versus Spotfire Has Temporal and Spatial Number of Records and Visualizations! Semantic CommunitySemantic Community Data Science Big Data Science for Precision Farming BusinessData ScienceBig Data Science for Precision Farming Business

Similar presentations