Download presentation
Presentation is loading. Please wait.

1
© Crown copyright Met Office CLIVAR Climate of the 20 th Century Project Adam Scaife, Chris Folland, Jim Kinter, David Fereday January 2009

2
© Crown copyright Met Office Aim Characterize and understand variability and predictability of climate over the past ~130 years associated with slowly varying forcing functions including SST History Initiated by Hadley Centre in 1993 Now jointly lead by Hadley Centre (Folland) and COLA - Center for Ocean Land Atmosphere studies (Kinter) CLIVAR project & reports to WMO/CAS/WGNE Workshops: Hadley 1994, COLA 2002, ICTP 2004, Hadley 2007
 and COLA - Center for Ocean Land Atmosphere studies (Kinter) CLIVAR project & reports to WMO/CAS/WGNE Workshops: Hadley 1994, COLA 2002, ICTP 2004, Hadley 2007")
3
© Crown copyright Met Office Experimental Design Initially focused on ensembles of AGCM simulations, at least 4 members All forced with same HadISST sea surface temperature and sea ice analysis Longer timescale than other intercomparisons such as AMIP: 1871 onwards Focus is on climate variability and predictability rather than model evaluation

4
© Crown copyright Met Office Experimental Design cont…. Expanded to include other forcing data sets, including greenhouse gases, ozone, volcanic aerosols and solar variability Recent extensions: “Pacemaker” experiments with coupled models in order to more accurately simulate variability that is inherently coupled Land surface forcing, interaction with LUCID Land Use and Climate – IDentification of robust impacts (De Noblet et al) More highly resolved SST to be available later this year: HadISST2
 More highly resolved SST to be available later this year: HadISST2.")
5
© Crown copyright Met Office Validating Data Sets NCEP/NCAR Reanalysis (1948-2005) ERA40 Reanalysis (1958-2002) HadSLP global sea level pressure analysis (1871-2005) Jones land surface air temperature (1871-2005) and Hulme land surface rainfall analyses (1871- 2002) Xie-Arkin global precipitation analysis (1979- 2005)
 ERA40 Reanalysis ( ) HadSLP global sea level pressure analysis ( ) Jones land surface air temperature ( ) and Hulme land surface rainfall analyses ( ) Xie-Arkin global precipitation analysis ( )")
6
© Crown copyright Met Office C20C Participating Groups 28 modeling groups involved worldwide Overlap with WGSIP?

7
© Crown copyright Met Office Reproducing climate variability Land Surface TemperatureSahel Rainfall Southern OscillationNorth Atlantic Oscillation

8
© Crown copyright Met Office Multi-Model Comparisons e.g. Evaluation of Climate Events: 20 th Century Climate Event (e.g. surface T trend) Consistent with ensemble means? Potentially predictable, “forced” and well modelled Consistent with ensemble members? Unpredictable internal variation but well modelled Poorly modelled in this experiment: missing process/forcing YES NO YES
 Consistent with ensemble means. Potentially predictable, forced and well modelled Consistent with ensemble members. Unpredictable internal variation but well modelled Poorly modelled in this experiment: missing process/forcing YES NO YES.")
9
© Crown copyright Met Office Predictable interdecadal trends? Ensemble Means Ensemble Members Land Surface T: 1970-2000Sahel Rainfall: 1950-1980 NAO: 1965-1995

10
© Crown copyright Met Office Selected results: Increase in predictability of boreal winter land temperature, using two models - mainly caused by decadal changes in ENSO variability Kang et al, 2006, GRL, highlighted

11
© Crown copyright Met Office Selected results: Winter NAO and the stratosphere Change in NAO index Change in surface pressure Model also forced with HadISST and all known major forcings in C20C mode. Full NAO and surface climate change 1965-95 reproduced Scaife et al, 2005, GRL

12
© Crown copyright Met Office North Atlantic Oscillation in Summer SNAO pattern Biggest single atmospheric circulation influence on summer climate in N W Europe/UK. Related to summer storm track – like 2007/8 flood or 1976 drought in UK. Related to ENSO SSTs, West African Monsoon and climate worldwide on decadal time scales, perhaps via AMO Current phase: (a) better understand mechanisms of SNAO links to atmospheric circulation and forcings, e.g. W. African summer monsoon. (b) Investigate SNAO seasonal predictability. Rainfall correlations 1900-1998 CF Folland et al. 2008
 better understand mechanisms of SNAO links to atmospheric circulation and forcings, e.g. W. African summer monsoon. (b) Investigate SNAO seasonal predictability. Rainfall correlations CF Folland et al")
13
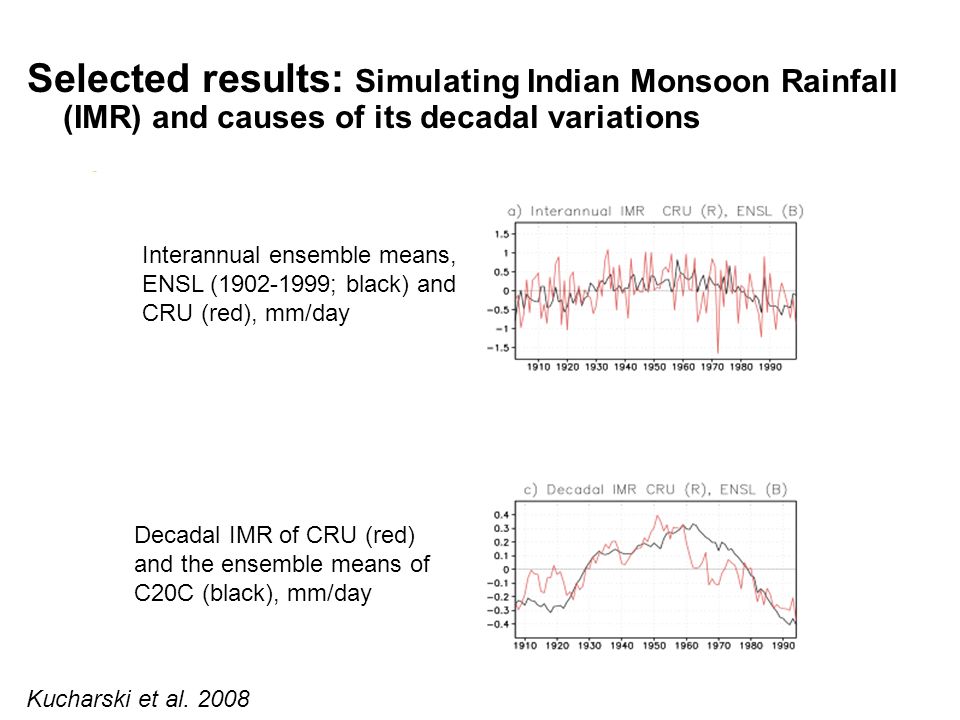
© Crown copyright Met Office Selected results: Simulating Indian Monsoon Rainfall (IMR) and causes of its decadal variations Interannual ensemble means, ENSL (1902-1999; black) and CRU (red), mm/day Decadal IMR of CRU (red) and the ensemble means of C20C (black), mm/day Kucharski et al. 2008
14
© Crown copyright Met Office Schubert et al. 2004 Selected results: Simulating Dust Bowl era drought

15
© Crown copyright Met Office Atlantic hurricanes in C20C simulations Storm counts (obs, model)
")
16
© Crown copyright Met Office Pacemaker Experiments Motivation: On seasonal time scales, there is large-scale atmosphere-ocean covariability (e.g. ENSO-monsoon) There is also local atmosphere-ocean coupling Latent heat flux – SST Rainfall – SST Lag-lead relationships None of these processes are well represented (often wrong sign) in typical AGCM simulations with global prescribed SST CGCM Pacemaker Strategy Specify SST only where it drives the atmosphere, and model the ocean (slab or dynamic) elsewhere Main example: prescribe SST in tropical eastern Pacific (Lau and Nath, 2003) Allow for coupled feedbacks outside region of specified SST Test importance of thermodynamic vs. dynamic coupling Some experiments with mixed-layer (slab) ocean models Some experiments with dynamic ocean models
 There is also local atmosphere-ocean coupling Latent heat flux – SST Rainfall – SST Lag-lead relationships None of these processes are well represented (often wrong sign) in typical AGCM simulations with global prescribed SST CGCM Pacemaker Strategy Specify SST only where it drives the atmosphere, and model the ocean (slab or dynamic) elsewhere Main example: prescribe SST in tropical eastern Pacific (Lau and Nath, 2003) Allow for coupled feedbacks outside region of specified SST Test importance of thermodynamic vs. dynamic coupling Some experiments with mixed-layer (slab) ocean models Some experiments with dynamic ocean models.")
17
© Crown copyright Met Office Pacemaker Strategy: Overcoming Shortcomings of AGCMS and Coupled Models The “Pacemaker” strategy permits a consistent air-sea energy balance while simultaneously including the time sequence of climate-driver events, such as ENSO. Teleconnections from the eastern tropical Pacific to remote tropical and extratropical regions are well represented in pacemaker runs, e.g., phenomena that are at once driven by and independent of ENSO, like the Asian monsoon. DJF SST Composite (El Nino - La Nina) Observed Pacemaker Observed JJA Rainfall Composite (El Nino - La Nina) Cash et al. 2007 Pacemaker design: specified SST regions
 Observed Pacemaker Observed JJA Rainfall Composite (El Nino - La Nina) Cash et al Pacemaker design: specified SST regions.")
18
© Crown copyright Met Office Evolving C20C Experimental Design Pacemaker Specified SST in limited region (e.g. eastern tropical Pacific or north Atlantic) Thermodynamic ocean (slab or mixed layer formulation with Q-flux) Dynamical ocean models in some basins Land Use and Change Coordination with LUCID Phenomena-Focused Experiments subsets of C20C group West African Monsoon Modeling and Evaluation (WAMME) Asian monsoon Influence of the stratosphere on seasonal predictability
 Thermodynamic ocean (slab or mixed layer formulation with Q-flux) Dynamical ocean models in some basins Land Use and Change Coordination with LUCID Phenomena-Focused Experiments subsets of C20C group West African Monsoon Modeling and Evaluation (WAMME) Asian monsoon Influence of the stratosphere on seasonal predictability.")
19
© Crown copyright Met Office Some Lessons Learned Collaborative data analysis sometimes works better than large on-line databases Beware of normalised indices Normalised, ensemble mean anomalies can give the impression of reproducible and potentially predictable anomalies, when members do not even span the observations. Absolute Sahel RainfallNormalised Sahel Rainfall

20
© Crown copyright Met Office Available Diagnostics Large selection of data available: PMSL, T, RH, Z, precip, U, V, w, cloud, heat flux, wind stress, soil moisture All monthly and some daily diagnostics Data available on line from COLA, HADLEY, SNU, GSFC http://www.iges.org/c20c/sharing_data.html

21
© Crown copyright Met Office Link with WGSIP on potential predictability? C20C forcing datasets available Use C20C data as a limit to predictability? Decadal climate events Earlier hindcasts? Pre-1979 Atm. analyses from 1891(Compo et al)
.")
Similar presentations


 Ben Kirtman (Co-Chair WGSIP) George Mason University Center for Ocean-Land-Atmosphere.>")
