Download presentation
Presentation is loading. Please wait.

1
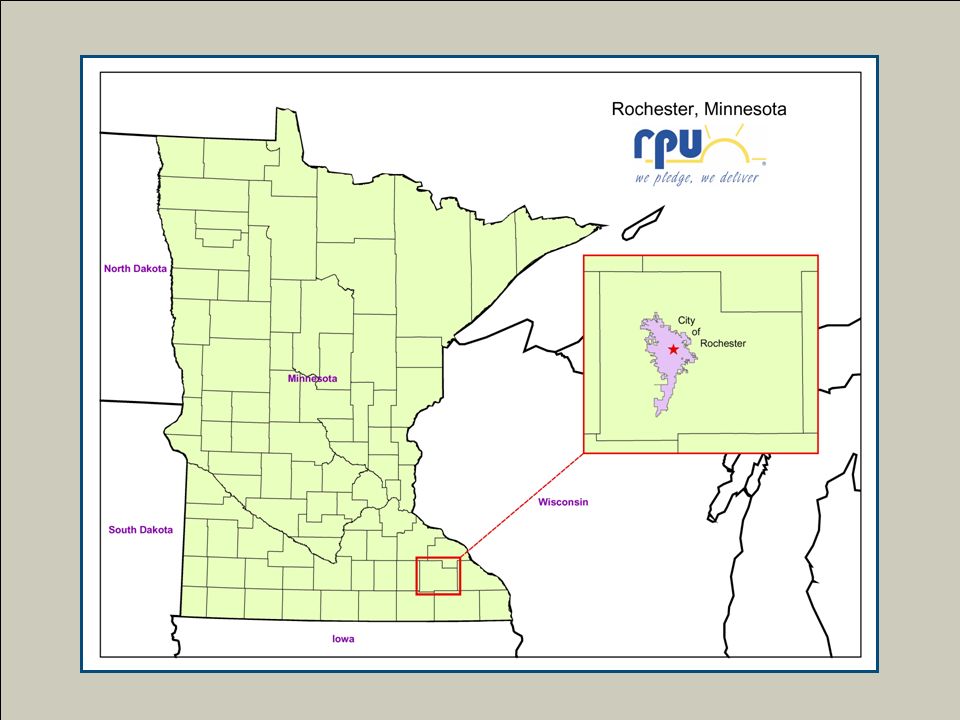
Analysis of Existing and Potential Regulatory Requirements and Emission Control Options for the Silver Lake Power Plant APPA Engineering & Operations Technical Conference March 8, 2004 Ivan Clark, P.E. Joseph Hensel

5
Screening Study Scope Regulatory summary and applicability review Identification and review of emission control technologies, including emerging technologies Review Silver Lake Plant Site and generating units with respect to emission control additions Screen and evaluate emission control technologies for application to the Silver Lake Plant Identify and evaluate various control technology scenarios Evaluate specific scenarios Maintain 1999-2000 Base Case emission levels Application of “state of the art” emission controls

6
Public Participation and Review A group of interested local citizens was invited to participate in the process. The group was named the Emission Control Study Input Group. The Input Group met with the project team five times, including a tour of the Silver Lake Plant to review and receive input on the study and report. All of the meetings were open to the public; the local newspaper generally attended and frequently reported on the progress in articles and editorials. There were also numerous individual questions and comments received during this process. Public meeting was held on October 30, 2003 for review and comment on the report. All of the materials, including various presentations, draft information and final report were posted on the RPU web site.

7
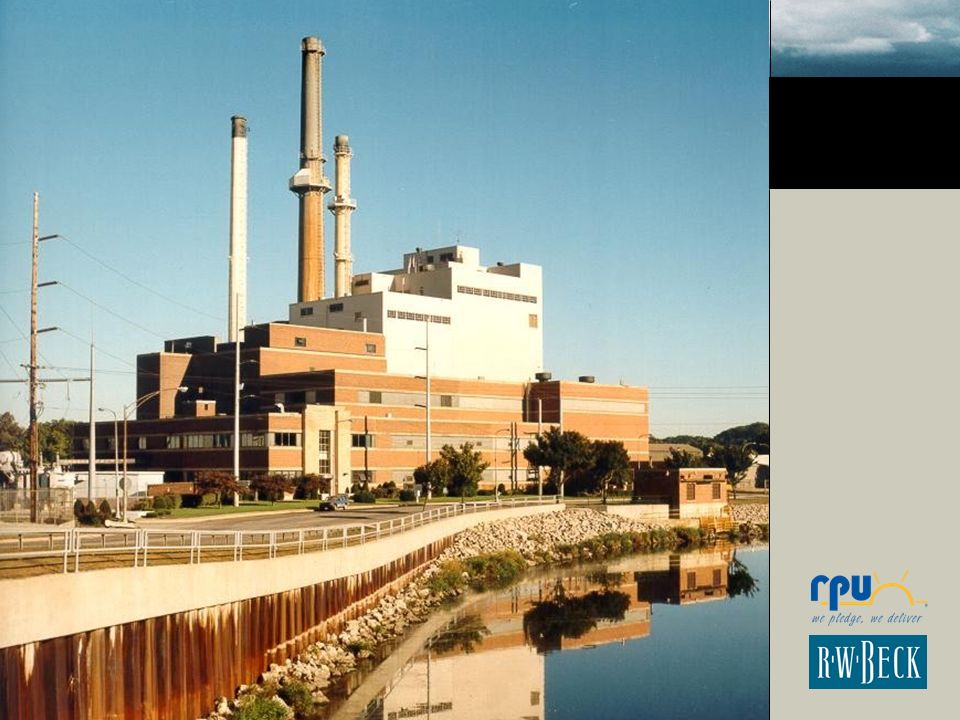
Existing Silver Lake Plant Four Units; Coal and Natural Gas Fuel ≈ 100 mw Boiler #1 – 116 mmBtu/hr(1949) Boiler #2 – 153 mmBtu/hr, 200 ft Common Stack (1952) Boiler #3 – 285 mmBtu/hr, 200 ft Stack(1962) Boiler #4 – 615 mmBtu/hr, 300 ft Stack (1969) 1999 – 2000 Fuel Use Coal 125,000 tons Gas 160,000 mcf Existing Permit Limits SO 2 – 3.2 lb/mmBtu with TACWEF Coal Consumption – 350,000 TPY
 Boiler #2 – 153 mmBtu/hr, 200 ft Common Stack (1952) Boiler #3 – 285 mmBtu/hr, 200 ft Stack(1962) Boiler #4 – 615 mmBtu/hr, 300 ft Stack (1969) 1999 – 2000 Fuel Use Coal 125,000 tons Gas 160,000 mcf Existing Permit Limits SO 2 – 3.2 lb/mmBtu with TACWEF Coal Consumption – 350,000 TPY")
8
Current & Future Emission Regulations That May Affect the Silver Lake Plant 8-hr Ozone Standard PM 2.5 Standard Regional Haze Rule Utility Boiler MACT Industrial Boiler MACT Clear Skies Act of 2003 Clean Power Act of 2003 Clean Air Planning Act Interstate Air Quality Rule

9
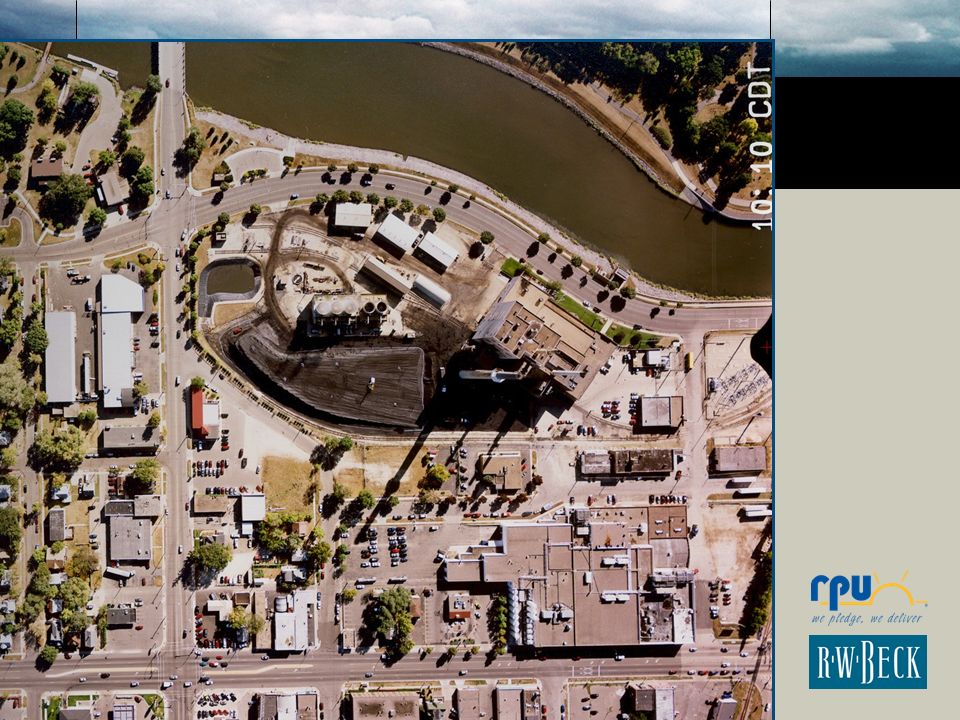
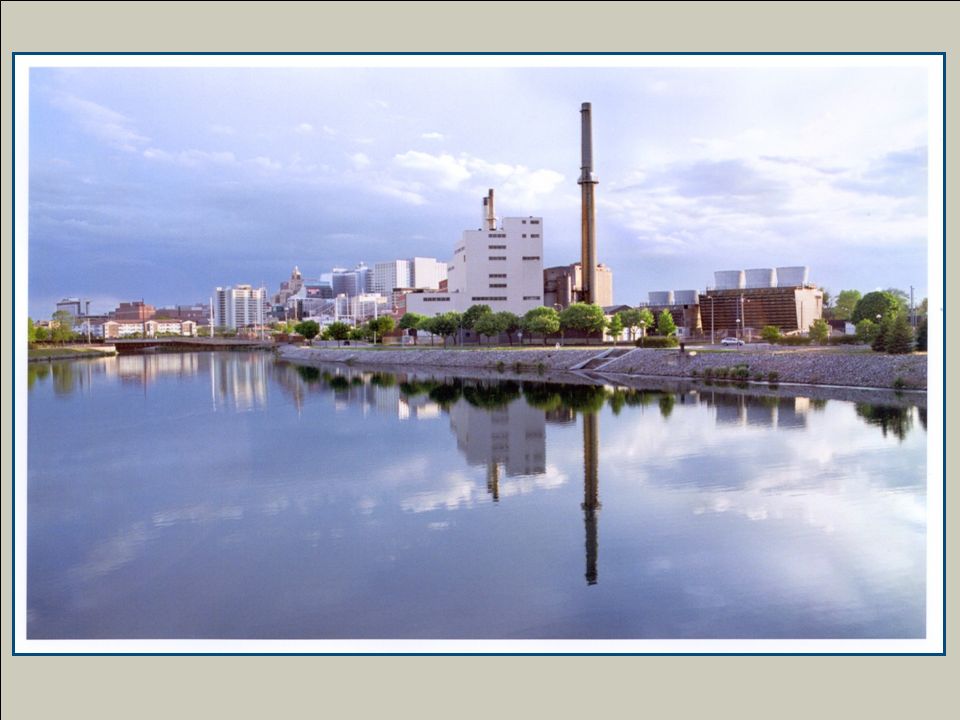
Silver Lake Plant Site

10
Pollutants of Concern Sulfur Dioxide (“SO 2 ”) Nitrogen Oxide (“NOx”) Particulate Matter (“PM or PM 10 ”) Mercury (“Hg”)
 Nitrogen Oxide ( NOx ) Particulate Matter ( PM or PM 10 ) Mercury ( Hg )")
11
SO 2 Control Technologies/Options Wet Scrubbers (lime/limestone) Dry Scrubbers (spray dryer absorbers) Lime Injection into Ducts/Boiler Low Sulfur Coal (“compliance coal”) Emerging Technologies
 Dry Scrubbers (spray dryer absorbers) Lime Injection into Ducts/Boiler Low Sulfur Coal ( compliance coal ) Emerging Technologies")
12
NO X Control Technologies Low NO X Burners and/or Combustion Modifications Gas Reburn Selective Non-Catalytic Reduction System (SNCR) Selective Catalytic Reduction (SCR) Combination of the above Emerging Technologies
 Selective Catalytic Reduction (SCR) Combination of the above Emerging Technologies")
13
PM Control Technologies Fabric Filters (“Baghouse”) Compact Hybrid Particulate Collector (“COHPAC”) Electrostatic Precipitator (“ESP”) Combination of the above
 Compact Hybrid Particulate Collector ( COHPAC ) Electrostatic Precipitator ( ESP ) Combination of the above")
14
Mercury Control Technologies Concurrent reductions resulting from control of SO 2 and/or PM Sorbent Injection

15
Emission Control Technology Screening Criteria Emission reduction capability (i.e. efficiency) Plant site space for required structures Commercial demonstration of technology Ability to achieve reductions consistent with future regulatory requirements Cost Installation schedule
 Plant site space for required structures Commercial demonstration of technology Ability to achieve reductions consistent with future regulatory requirements Cost Installation schedule.")
16
Emission Control Scenarios for Silver Lake Power Plant Emission control for each individual unit Emission controls for combined flue gas streams from units Use of high efficiency controls on larger units with less control on smaller units Use of multi-pollutant control technologies

17
UnitTechnology Capital Costs, $ Capital Cost, $/kw Capacity Annual O&M Costs, $ Total Annual Costs, $ Total Unit Costs $/MWhr Estimated Emission Rate, lb/MMBtu Potential Projected Emissions (ton/yr) Percent of Base Case Emissions Reduction Cost, $/ton of Pollutant Removed 1 Low- NO X Burners/ Overfire Air 338,95834--27,1842.010.3638.02120385 2 Low- NO X Burners/ Overfire Air 356,46225--28,5880.420.36160.8322996 3 Low- NO X Burners/ Overfire Air 364,41915--29,2260.270.34230.7368 4Overfire Air/SNCR1,364,13723351,662488,3491.560.21337.45911,769 1 Selective Catalytic Reduction (SCR) 7,402,96074069,848663,566490.1516.29517,187 2 Selective Catalytic Reduction (SCR) 8,023,587573169,437812,928120.1568.93982,081 3 Selective Catalytic Reduction (SCR) 9,045,233362228,852954,28090.1498.88291,703 4 Selective Catalytic Reduction (SCR) 13,095,750218431,2841,481,56350.0692.03252,841 NOX Control Technology Summary Table
 Percent of Base Case Emissions Reduction Cost, $/ton of Pollutant Removed 1 Low- NO X Burners/ Overfire Air 338, , Low- NO X Burners/ Overfire Air 356, , Low- NO X Burners/ Overfire Air 364, , Overfire Air/SNCR1,364, ,662488, ,769 1 Selective Catalytic Reduction (SCR) 7,402, ,848663, ,187 2 Selective Catalytic Reduction (SCR) 8,023, ,437812, ,081 3 Selective Catalytic Reduction (SCR) 9,045, ,852954, ,703 4 Selective Catalytic Reduction (SCR) 13,095, ,2841,481, ,841 NOX Control Technology Summary Table")
18
UnitTechnology Capital Costs, $ Capital Cost, $/kw Capacity Annual O&M Costs, $ Total Annual Costs, $ Total Unit Costs $/MWhr Estimated Emission Rate, lb/MMBtu Potential Projected Emissions (ton/yr) Percent of Base Case Emissions Reduction Cost, $/ton of Pollutant Removed 1 Spray Dryer Absorber 14,124,8231,412384,5951,517,4061120.2931.526912,036 2 Spray Dryer Absorber 14,289,2621,021535,9431,681,942250.31140.251312,998 3 Spray Dryer Absorber 15,257,864610655,1911,878,872170.27283.06392,566 4 Spray Dryer Absorber 23,233,7103871,250,7233,114,066100.37594.24331,310 1Wet Scrubber16,556,4051,656432,4011,760,2251300.1515.763412,411 2Wet Scrubber16,749,4891,196549,7601,893,069280.1670.12663,000 3Wet Scrubber17,804,024712649,3832,077,266190.1391.53192,522 4Wet Scrubber26,506,5874421,167,7843,293,612110.18297.12171,232 SO2 Control Technology Summary Table
 Percent of Base Case Emissions Reduction Cost, $/ton of Pollutant Removed 1 Spray Dryer Absorber 14,124,8231,412384,5951,517, ,036 2 Spray Dryer Absorber 14,289,2621,021535,9431,681, ,998 3 Spray Dryer Absorber 15,257, ,1911,878, ,566 4 Spray Dryer Absorber 23,233, ,250,7233,114, ,310 1Wet Scrubber16,556,4051,656432,4011,760, ,411 2Wet Scrubber16,749,4891,196549,7601,893, ,000 3Wet Scrubber17,804, ,3832,077, ,522 4Wet Scrubber26,506, ,167,7843,293, ,232 SO2 Control Technology Summary Table")
19
UnitTechnology Capital Costs, $ Capital Cost, $/kw Capacity Annual O&M Costs, $ Total Annual Costs, $ Total Unit Costs $/MWhr Estimated Emission Rate, lb/MMBtu Potential Projected Emissions (ton/yr) Percent of Base Case Emissions Reduction Cost, $/ton of Pollutant Removed 1 Fabric Filter8,477,652 848 2,863682,770510.015 1.602939,229 2 Fabric Filter8,560,402 611 14,544701,088100.015 6.786811,878 3 Fabric Filter9,100,400 364 23,234753,08670.015 10.182310,072 4 Fabric Filter13,556,180 226 66,3511,153,55740.015 24.3882,304 1 COHPAC6,358,239 636 2,863512,793380.015 1.602929,463 2 COHPAC6,420,302 459 14,544529,45280.015 6.78688,970 3 COHPAC6,825,300 273 23,344570,62350.015 10.18237,632 4 COHPAC10,167,135 169 66,351881,75630.015 24.3881,761 PM Control Technology Summary Table
 Percent of Base Case Emissions Reduction Cost, $/ton of Pollutant Removed 1 Fabric Filter8,477, ,863682, ,229 2 Fabric Filter8,560, ,544701, ,878 3 Fabric Filter9,100, ,234753, ,072 4 Fabric Filter13,556, ,3511,153, ,304 1 COHPAC6,358, ,863512, ,463 2 COHPAC6,420, ,544529, ,970 3 COHPAC6,825, ,344570, ,632 4 COHPAC10,167, ,351881, ,761 PM Control Technology Summary Table")
20
UnitTechnology Capital Costs, $ Capital Cost, $/kw Capacity Annual O&M Costs, $ Total Annual Costs, $ Total Unit Costs $/MWhr Estimated Emission Rate, lb/MMBtu Projected Emissions (ton/yr) Percent of Base Case Emissions Reduction Cost, $/ton of Pollutant RemovedComments 1 Sorbent Injection 1,763,2161765,834147,59911**** Mercury emissions are not evaluated since Base Case emission data was not available from the SLP. 2 Sorbent Injection 1,763,21612624,677167,5902**** Mercury emissions are not evaluated since Base Case emission data was not available from the SLP. 3 Sorbent Injection 1,845,9667437,037187,3392**** Mercury emissions are not evaluated since Base Case emission data was not available from the SLP. 4 Sorbent injection 2,531,3074288,702297,1151**** Mercury emissions are not evaluated since Base Case emission data was not available from the SLP. Mercury Control Technology Summary Table

21
UnitTechnology Capital Costs, $ Capital Cost, $/kw Capacity Annual O&M Costs, $ Total Annual Costs, $ Total Unit Costs $/MWhr Pollutant Controlled Estimated Emission Rate, lb/MMBtu Potential Projected Emissions (ton/yr) % of Base Case Emissions 1, 2 3, 4 RJM Corporation “RAP” Process 26,556,1943121,337,3953,998,3269.5NO X 0.35951.11117 SO 2 0.912,368.4098 PM 10 0.01542.9411 Mercury 4 RJM Corporation “RAP” Process 13,722,6891621,198,8132,209,4157.1NO X 0.25398.8065 SO 2 0.36594.2480 PM 10 0.01524.384 Mercury RJM Corporation “RAP” Process Emerging Technology Summary
 % of Base Case Emissions 1, 2 3, 4 RJM Corporation RAP Process 26,556, ,337,3953,998,3269.5NO X SO , PM Mercury 4 RJM Corporation RAP Process 13,722, ,198,8132,209,4157.1NO X SO PM Mercury RJM Corporation RAP Process Emerging Technology Summary")
22
UnitTechnology Capital Costs $ Capital Cost, $/kw Capacity Annual O&M Costs, $ Total Annual Costs, $ Total Unit Costs $/MWhr Pollutant Controlled Estimated Emission Rate, lb/MMBtu Potential Projected Emissions (ton/yr) Percent of Base Case Emissions 1, 2, 3, 4 Powerspan “ECO” System 52,615,3366191,069,9166,341,97312.6NO X 0.034184.0923 SO 2 1.24949.0739 PM 10 0.01542.9411 Mercury 4Powerspan “ECO” System 28,962,570341663,5133,565,56311.4NO X 0.0461.3517 SO 2 0.37594.2433 PM 10 0.01524.388 Mercury--- Powerspan “ECO” System – Emerging Technology Summary Table
 Percent of Base Case Emissions 1, 2, 3, 4 Powerspan ECO System 52,615, ,069,9166,341, NO X SO PM Mercury 4Powerspan ECO System 28,962, ,5133,565, NO X SO PM Mercury--- Powerspan ECO System – Emerging Technology Summary Table")
23
UnitTechnology Capital Costs, Capital Cost, $/kw Capacity Annual O&M Costs Total Annual Costs Total Unit Costs $/MWhr Pollutant Controlled Estimated Emission Rate, lb/MMBtu Potential Projected Emissions (ton/yr) Percent of Base Case Emissions 3 & 4 Enviroscrub “Pahlman” Process 40,844,6504813,135,4787,228,11217NO X 0.0125.463 SO 2 0.0377.733 PM 10 0.01534.5610 Mercury--- 4 Enviroscrub “Pahlman” Process 31,508,7303712,322,2975,479,47217.5NO X 0.0112.273 SO 2 0.0459.423 PM 10 0.01524.388 Mercury--- Enviroscrub “Pahlman” Process – Emerging Technology Summary Table
 Percent of Base Case Emissions 3 & 4 Enviroscrub Pahlman Process 40,844, ,135,4787,228,11217NO X SO PM Mercury--- 4 Enviroscrub Pahlman Process 31,508, ,322,2975,479, NO X SO PM Mercury--- Enviroscrub Pahlman Process – Emerging Technology Summary Table")
24
UnitPollutant Control Technology Base Case Emissions (ton/yr) (1) Projected Actual Emissions (ton/yr) (2) Percent of Base Case Emissions (Actual) (3) Projected Potential Emissions (ton/yr) (4) Percent of Base Case Emissions (Potential) (5) 1NO X Low NO X Burners/Overfire Air 31.6628.188938.02120 2NO X Low NO X Burners/Overfire Air 70.11119.21170160.83229 3NO X Low NO X Burners/Overfire Air 338.97171.0150230.7368 4NO X Overfire Air/Selective Non- Catalytic Reduction 369.02250.1268337.4591 Total Plant NO X 809.76568.5270767.0395 Case 1: Maintain 1999–2000 Base Case Emissions NOX Emission Control Technology Summary Table – Option 1
 (1) Projected Actual Emissions (ton/yr) (2) Percent of Base Case Emissions (Actual) (3) Projected Potential Emissions (ton/yr) (4) Percent of Base Case Emissions (Potential) (5) 1NO X Low NO X Burners/Overfire Air NO X Low NO X Burners/Overfire Air NO X Low NO X Burners/Overfire Air NO X Overfire Air/Selective Non- Catalytic Reduction Total Plant NO X Case 1: Maintain 1999–2000 Base Case Emissions NOX Emission Control Technology Summary Table – Option 1")
25
UnitPollutant Control Technology Base Case Emissions (ton/yr) (1) Projected Actual Emissions (ton/yr) (2) Percent of Base Case Emissions (Actual) (3) Projected Potential Emissions (ton/yr (4) Percent of Base Case Emissions (Potential) (5) 1NO X Low NOx Burners/ Overfire Air 31.6628.188938.02120 2NO X Low NO X Burners/ Overfire Air 70.11119.21170160.83229 3NO X Low NO X Burners/ Overfire Air 338.97171.0150230.7368 4NO X Selective Catalytic Reduction 369.0268.211892.0325 Total Plant NO X 809.76386.6248521.6164 Case 1: Maintain 1999–2000 Base Case Emissions NOX Emission Control Technology Summary Table – Option 2
 (1) Projected Actual Emissions (ton/yr) (2) Percent of Base Case Emissions (Actual) (3) Projected Potential Emissions (ton/yr (4) Percent of Base Case Emissions (Potential) (5) 1NO X Low NOx Burners/ Overfire Air NO X Low NO X Burners/ Overfire Air NO X Low NO X Burners/ Overfire Air NO X Selective Catalytic Reduction Total Plant NO X Case 1: Maintain 1999–2000 Base Case Emissions NOX Emission Control Technology Summary Table – Option 2")
26
UnitPollutant Control Technology Base Case Emissions (ton/yr) (1) Projected Actual Emissions (ton/yr) (2) Percent of Base Case Emissions (Actual) (3) Projected Potential Emissions (ton/yr) (4) Percent of Base Case Emissions (Potential) (5) 1SO 2 No Control45.93116.81254157.59343 2SO 2 No Control106.99519.77486701.25655 3SO 2 No Control470.66678.44144915.32194 4SO 2 Spray Dryer Absorber 1787.05440.4525594.2433 Total Plant SO 2 2410.631755.47732368.4098 Case 1: Maintain 1999–2000 Base Case Emissions SO2 Emission Control Technology Summary Table
 (1) Projected Actual Emissions (ton/yr) (2) Percent of Base Case Emissions (Actual) (3) Projected Potential Emissions (ton/yr) (4) Percent of Base Case Emissions (Potential) (5) 1SO 2 No Control SO 2 No Control SO 2 No Control SO 2 Spray Dryer Absorber Total Plant SO Case 1: Maintain 1999–2000 Base Case Emissions SO2 Emission Control Technology Summary Table")
27
UnitPollutant Control Technology (1) Base Case Emissions (ton/yr) (2) Projected Actual Emissions (ton/yr) (3) Percent of Base Case Emissions (Actual) (4) Projected Potential Emissions (ton/yr) (5) Percent of Base Case Emissions (Potential) (6) 1PM 10 ESP5.5414.0925419.01343 2PM 10 ESP10.0448.7848665.81655 3PM 10 ESP43.6862.9614484.95194 4PM 10 Fabric Filter315.7918.07624.388 Total Plant PM 10 375.05143.9038194.1452 Case 1: Maintain 1999–2000 Base Case Emissions PM10 Emission Control Technology Summary Table
 Base Case Emissions (ton/yr) (2) Projected Actual Emissions (ton/yr) (3) Percent of Base Case Emissions (Actual) (4) Projected Potential Emissions (ton/yr) (5) Percent of Base Case Emissions (Potential) (6) 1PM 10 ESP PM 10 ESP PM 10 ESP PM 10 Fabric Filter Total Plant PM Case 1: Maintain 1999–2000 Base Case Emissions PM10 Emission Control Technology Summary Table")
28
Unit Pollutant/ TechnologyCapital Costs, $ Capital Cost, $/kw Capacity Annual O&M Costs, $ Total Annual Costs, $ Total Unit Costs $/MWhr Reduction Cost, $/ton of Pollutant Removed NO X 1,2 & 3Low- NO X Burners/ Overfire Air 1,059,83922--84,9980.44106 4Overfire Air/SNCR1,364,13723351,662488,3491.561,769 SO 2 1,2 &3No new control-- 4Spray Dryer Absorber w/ Fabric Filter 23,233,7103871,250,7233,114,066101310 PM 10 1,2&3Existing ESP –No new control -- 4Fabric Filter (included with SO 2 control above) (included with SO 2 control above) See Table 11-3 Mercury 1,2&3No new control-- 4Control assumed with SO 2 above (included with SO 2 control above) -- Total Costs 25,657,6862351,602,3853,687,4137.31-- Case 1: Maintain 1999–2000 Base Case Emissions Summary Cost Table – Option 1
 (included with SO 2 control above) See Table 11-3 Mercury 1,2&3No new control-- 4Control assumed with SO 2 above (included with SO 2 control above) -- Total Costs 25,657, ,602,3853,687, Case 1: Maintain 1999–2000 Base Case Emissions Summary Cost Table – Option 1")
29
Technology Controlled UnitsCapital Cost, $Total Annual Cost, $ RJM “RAP” ProcessUnit 415,062,5282,294,413 Powerspan “ECO” SystemUnit 428,962,5703,565,563 Enviroscrub “Pahlman” Process Unit 431,508,7305,479,472 Case 1: Maintain 1999–2000 Base Case Emissions Emerging Control Technology Cost Summary Table

30
UnitPollutantState-of-the-Art Technology Base Case Emissions (ton/yr) Projected Actual Emissions (ton/yr) Percent of Base Case Emissions Projected Potential Emissions (ton/yr) Percent of Base Case Emissions 1NO X Selective Catalytic Reduction31.6612.083816.2951 2NO X Selective Catalytic Reduction70.1151.097368.9398 3NO X Selective Catalytic Reduction338.9773.292298.8829 4NO X Selective Catalytic Reduction369.0268.211892.0325 1SO 2 Wet Scrubber45.9311.682515.7634 2SO 2 Wet Scrubber106.9951.984970.1266 3SO 2 Wet Scrubber470.6667.841491.5319 4SO 2 Wet Scrubber1787.05220.2312297.1217 1PM 10 Fabric Filter5.541.19211.6029 2PM 10 Fabric Filter10.045.03506.7868 3PM 10 Fabric Filter43.687.541710.1823 4PM 10 Fabric Filter315.7918.07624.388 State-of-the-Art Emission Control Technology Summary Table
 Projected Actual Emissions (ton/yr) Percent of Base Case Emissions Projected Potential Emissions (ton/yr) Percent of Base Case Emissions 1NO X Selective Catalytic Reduction NO X Selective Catalytic Reduction NO X Selective Catalytic Reduction NO X Selective Catalytic Reduction SO 2 Wet Scrubber SO 2 Wet Scrubber SO 2 Wet Scrubber SO 2 Wet Scrubber PM 10 Fabric Filter PM 10 Fabric Filter PM 10 Fabric Filter PM 10 Fabric Filter State-of-the-Art Emission Control Technology Summary Table")
31
Case 2 - State-of-the-Art Emission Control, Summary Cost Table UnitPollutant State-of-the-Art Technology Capital Costs, $ Capital Cost, $/kw Capacity Annual O&M Costs, $ Total Annual Costs, $ Total Unit Costs $/MWhr Reduction Cost, $/ton of Pollutant Removed 1 NO X Selective Catalytic Reduction7,402,96074069,848663,566497,187 2 NO X Selective Catalytic Reduction8,023,587573169,437812,928122,081 3 NO X Selective Catalytic Reduction9,045,233362228,852954,28091,703 4 NO X Selective Catalytic Reduction13,095,750218431,2841,481,56352,841 1 SO 2 Wet Scrubber16,556,4051,656432,4001,760,22513012,411 2 SO 2 Wet Scrubber16,749,4891,196549,7601,893,069283,000 3 SO 2 Wet Scrubber17,804,024712649,3832,077,266192,522 4 SO 2 Wet Scrubber26,506,5874421,167,7843,293,612111,232 1 PM 10 Fabric Filter8,477,6526362,863682,7705139,229 2 PM 10 Fabric Filter8,560,40245914,544701,0881011,878 3 PM 10 Fabric Filter9,100,40027323,234753,086710,072 4 PM 10 Fabric Filter13,556,18016966,3511,153,55742,304 1 MercurySorbent Injection1,763,2161765,834147,59911-- 2 MercurySorbent Injection1,763,21612624,677167,5902-- 3 MercurySorbent Injection1,845,9667437,037187,3392-- 4 MercurySorbent Injection2,531,3074288,702297,1151-- Total162,782,3741,4933,961,99017,026,65333.77

32
Regulation Timeline

33
Silver Lake Power Plant Emission Controls Review Phase II

Similar presentations


 Presented at the NC Clean Smokestacks Act Sections.>")


 Emissions Reductions Beyond the Clean Smokestacks Act (CSA) Environmental Management Commission.>")


 van Leeuwen.>")


