Download presentation
Presentation is loading. Please wait.

1
Pension Reform in the Nordic Countries A Model for the Other EU Member States? Arne Paulsson SIA Sweden CICERO FOUNDATION SEMINAR PARIS - 11 MAY 2007

2
What´s common for Nordic Pension Systems Basic Security – guaranteed by the State Earningsrelated supplements Means-tested support for the poor Universal benefits Individual rights

3
Different Designs Sweden Basic security and mandatory Norway earningsrelated supplement by Finland public law Denmark Basic security by public law and Iceland earningsrelated supplement by occupational systems

4
Recent Pension Reforms in Sweden Finland Norway Finacially stable Pension System to meet the future demographic and economic conditions Politically stable Pension System by a broad political support in the Parliament

5
Swedish Reform – time schedule 1984-1990Pension Comission 1991-1994Working Group on Pensions 1994New System approved in Parliament 1998Final Legislation approved 1999New System comes into force 2003New System fully implemented

6
Defined Contributions – NDC 16% (Pay-as-you-go) – FDC 2,5% (Funded) Lifetime earnings Rate of return – NDC: wage index – FDC: financial market Main Features of the Swedish Pension System
 – FDC 2,5% (Funded) Lifetime earnings Rate of return – NDC: wage index – FDC: financial market Main Features of the Swedish Pension System")
7
Benefits based on life expectancy at retirement NDC – automatic balancing Transitional rules Guarantee pension – basic protection (general tax financed) Main Features of the Swedish Pension System
 Main Features of the Swedish Pension System")
8
Every contribution give corresponding pension credit, the whole life 16 % Pay-as-you-go Funded 2,5 % Pensionable income SEK

9
Pension rights Pensionable earnings – wages – social insurance benefits Pensionable amounts –children under 4 years –disability pension –higher studies –military service

10
NDC Account Year Account Value 1/1 Pension Rights Survivors Bonus Index- ation Adm. Costs Account Value 31/12 1999851 83235 100162915 372-143903 790 2000903 79035 712196913 605-436954 640 2001954 64035 808207428 468-3671020 623

11
Annuity = Annuity calculation NDC Account value at retirement Annuitization divisor Annuitization divisor is calculated from unisex life expectancy at retirement age and an interest rate of 1,6 %

12
Retirement From the age of 61 NDC-pension, FDC-pension or both 25%, 50%, 75% or 100% of benefit

13
..interest 1,6 % Growth 1,6 % Imputed interest 0,0 % Growth 1,6 % PENSION FIXED PRICES AGE Pension as an annuity

14
Norway Pension rights accrued by 1,35 % of earnings annually Lifetime earnings count Pension rights indexed by wages Retirement age 62 – Life expectancy affects pensions Pensions indexed 50/50 by prices/wages

15
Finland Pension rights accrued by 1,5 %(age 18-52), 1,9 %(age 53-62) and 4,5 %(age 63-68) Pension rights indexed 20/80 by prices/wages Retirement age 63 – 68 Life expectancy affects pensions Pensions indexed 80/20 by prices/wages
, 1,9 %(age 53-62) and 4,5 %(age 63-68) Pension rights indexed 20/80 by prices/wages Retirement age 63 – 68 Life expectancy affects pensions Pensions indexed 80/20 by prices/wages")
16
Effect from forecasted increase in life expectancy Cohort born.. turns 65 year Forecasted divisor (at 65) Effect on pension, relative to cohort born 1940 Required delay of retirement age to offset effect of increase in divisor 1940200515.6- - 1945201016.0-2% + 5 months 1950201516.3-4% + 9 months 1955202016.6-6% + 13 months 1960202516.9-8% + 16 months 1965203017.2-9% + 20 months 1970203517.4-10% + 23 months 1975204017.6-11% + 26 months 1980204517.8-12% + 28 months 1985205018.0-13% + 29 months 1990205518.1-14% + 30 months
 Effect on pension, relative to cohort born 1940 Required delay of retirement age to offset effect of increase in divisor % + 5 months % + 9 months % + 13 months % + 16 months % + 20 months % + 23 months % + 26 months % + 28 months % + 29 months % + 30 months.")
17
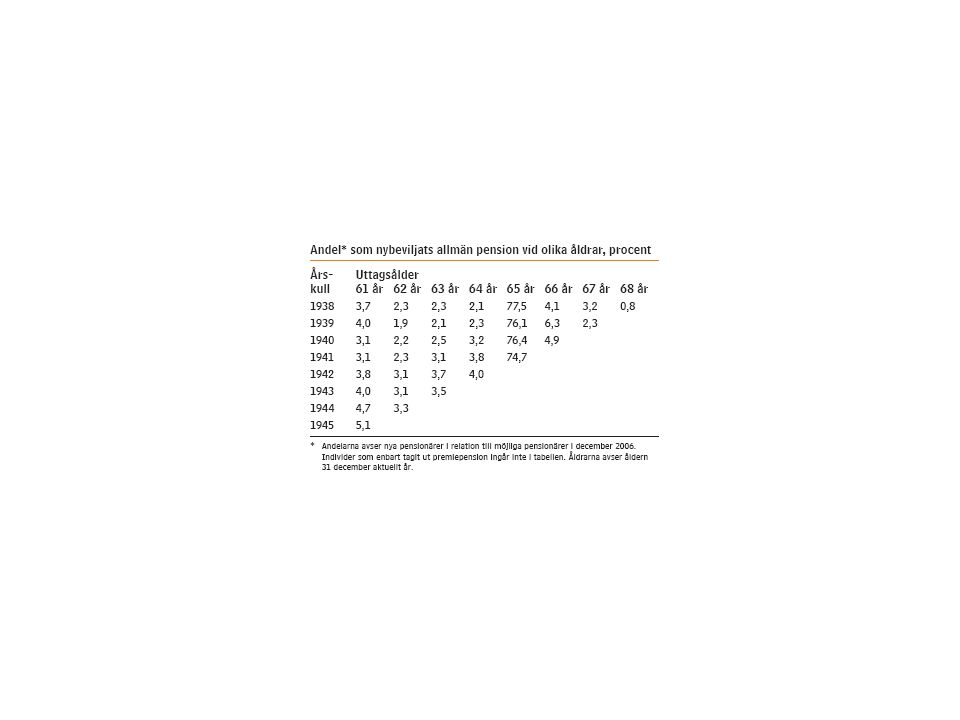
For those born 1938-1953 Försäkringskassan och Riksförsäkringsverket 1999 5

18
Guarantee pensions Basic security for those with low or no income-related pension 0 20 000 40 000 60 000 80 000 100 000 120 000 140 000 0 Income-related pension Income related + guarantee 42 000100 000 Income-related pension Guarantee 0 20 000 40 000 60 000 80 000 100 000 120 000 140 000 0 Income-related pension Income related + guarantee 42 000100 000 Income-related pension Guarantee

19
Balanstalet Balance ratio Pension Liabilities Contributions AssetFund + =

20
Time is money... Payments In average year 2000: 43 years age76 years age age Contributions 15202530354045505560657075808590 95 100 Wait… 33 years Contributions Payments age

21
Exp. turnover duration contributions The present value of contribution flow, i.e. the contribution asset, is calculated as:

22
Fund 550 mdr. SEK The Balance Sheet in 2003 Pension Liabilities 5 984 mdr. SEK Contribution Asset 5 465 mdr. SEK Fund 577 mdr. SEK Balance Ratio = 1.0097

23
100 105 110 115 120 125 130 135 140 145 150 1234567891011121314151617181920 Income index Balance index slower indexation faster indexation Year Income and balance index

31
Key Figures Billions of SEK 20062005200420032002 Buffer Fund 858 769 646 577 488 Contribution Assets5 9455 7215 6075 4655 301 Total Assets6 8036 4906 2536 0425 789 Pension Liabilities6 7036 4616 2445 9845 729 Surplus 100 28 9 58 60 Balance Ratio1,01491,00441,00141,00971,0105

33
To learn from the Nordic Countries Broad political support Tight connection between earnings and benefits Lifetime earnings Pensions affected by life expectancy Flexible retirement

34
Thank you for your attention For more information www.forsakringskassan.se arne.paulsson@forsakringskassan.se

Similar presentations