Download presentation
Presentation is loading. Please wait.

1
The Evaluation of a Passive Microwave-Based Satellite Rainfall Estimation Algorithm with an IR-Based Algorithm at Short time Scales Robert Joyce RS Information Systems John Janowiak Climate Prediction Center/NCEP/NWS Phillip Arkin ESSIC – University of Maryland Pingping Xie Climate Prediction Center/NCEP/NWS 2 nd International Precipitation Working Group October 25-28, 2004 *CPC Morphing Technique

2
1. CMORPH concept 2. CMORPH methodology 3. Validation 4. Improvement potential and future work 5. Conclusions Outline

3
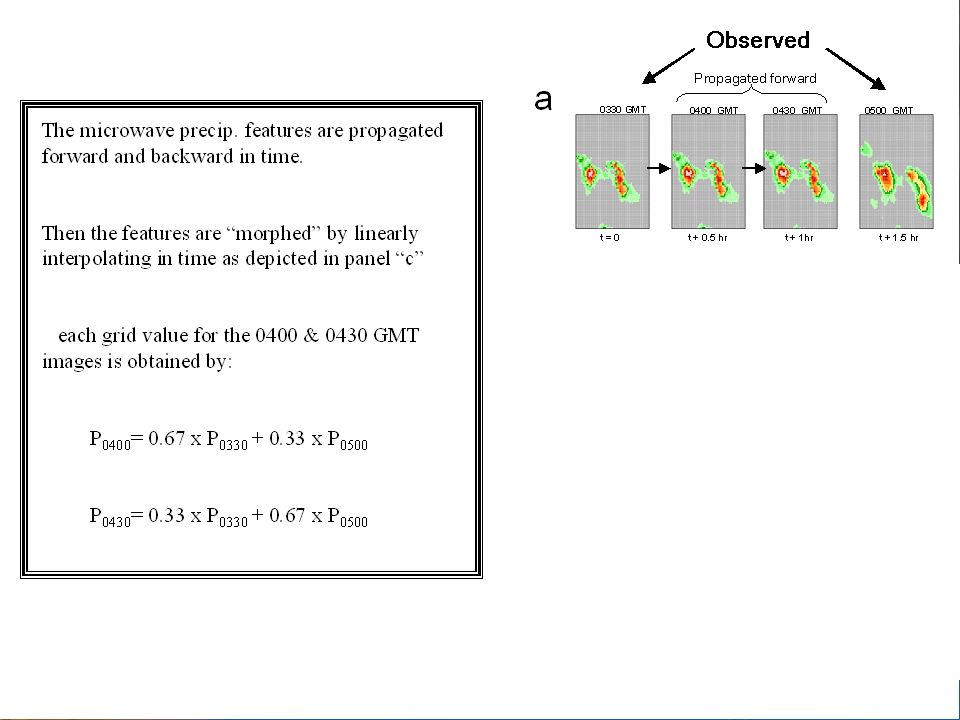
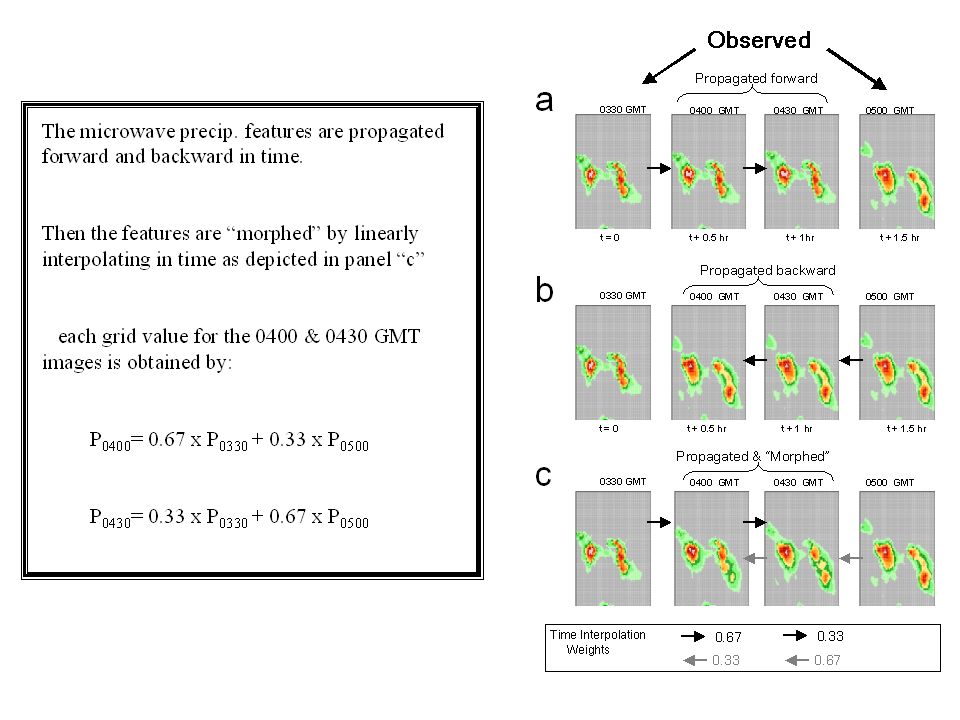
“CMORPH” is not a precipitation estimation technique but rather a method that creates spatially & temporally complete information using existing precipitation products that are derived from passive microwave observations. At present, precipitation estimates are used from various passive microwave sensor types on 8 platforms: AMSU-B (NOAA 15, 16, 17) SSM/I (DMSP 13, 14, 15) TMI (TRMM – NASA/Japan) AMSR-E (Aqua) NOAA/NESDIS (Ferraro et al)
 SSM/I (DMSP 13, 14, 15) TMI (TRMM – NASA/Japan) AMSR-E (Aqua) NOAA/NESDIS (Ferraro et al).")
4
TMI rainfall estimates from NASA’s 2A12 algorithm (Kummerow et al., 1996) Goddard Profiling (GPROF) version 5, soon version 6 AMSR-E precipitation estimates from GPROF-6 rainfall algorithm run at NOAA/NESDIS/ORA. SSMI precipitation estimates from NOAA/NESDIS/ORA GPROF-6 SSMI rainfall algorithm. AMSU-B rainfall estimates from new NESDIS/ORA AMSU-B rainfall algorithm (Weng et al., 2003) Half hourly, 0.0727 lat/lon (8 km at equator) resolution arrays (separate for each sensor type) are assigned the nearest rainfall estimate within swath regions Averaging of retrieval estimates within same grid points (AMSR-E and TMI only) Anomalous microwave estimated rainfall screened with NESDIS Satellite Services Division (SSD) daily Interactive Multi-sensor Snow and Ice Mapping System (IMS) product
 Half hourly, lat/lon (8 km at equator) resolution arrays (separate for each sensor type) are assigned the nearest rainfall estimate within swath regions Averaging of retrieval estimates within same grid points (AMSR-E and TMI only) Anomalous microwave estimated rainfall screened with NESDIS Satellite Services Division (SSD) daily Interactive Multi-sensor Snow and Ice Mapping System (IMS) product.")
5
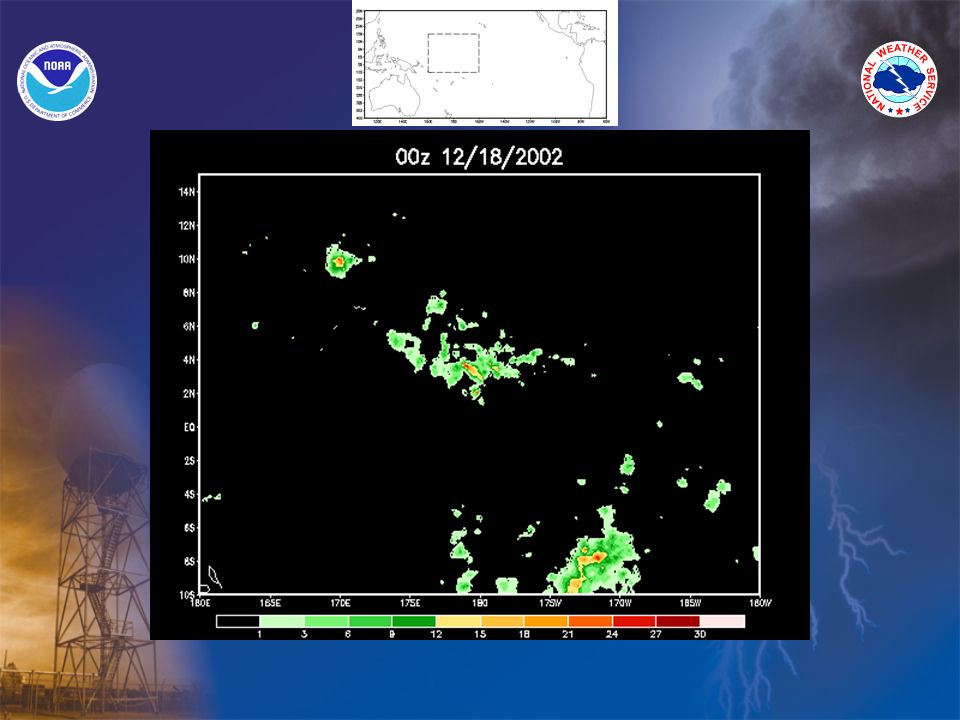
PMW rainfall gridded to 8km resolutionPMW rainfall gridded to 8km resolution 3-hr mosaic: good coverage but time of obs. varies by 3 hrs MANY thanks to NESDIS/OSDPD & R. Ferraro (NESDIS/ORA)
.")
6
PMW rainfall gridded to 8km resolutionPMW rainfall gridded to 8km resolution 3-hr mosaic: good coverage but time of obs. varies by 3 hrs

7
IR Data All 5 geostationary meteorological satellites Obtained via McIDAS Merged into ½ hr global (60N-60S), ~ 4 km maps Corrections for limb darkening & parallax applied Refs: Janowiak et al., Bull. Amer. Meteor. Soc., Feb 2001) Joyce et al., J. Appl. Meteor., Apr 2001 Most recent 8 days (each ½ hr period) available at: ftpprd.noaa.gov: pub/precip/global_full_res_IR
 Joyce et al., J. Appl. Meteor., Apr 2001 Most recent 8 days (each ½ hr period) available at: ftpprd.noaa.gov: pub/precip/global_full_res_IR.")
8
Advection Vector Components Zonal Meridional 20Z March 7, 2004

12
Hourly Rainfall during 06UTC to 23UTC on Oct 5, 2003 CMORPH RADAR

14
Satellite - CPC gauge analysis Merged PMW – only & Radar Difference from gauge analysis

15
Satellite - CPC gauge analysis CMORPH & Radar Difference from gauge analysis

16
Comparison with U.S. Gauge Analyses Radar CMORPH RADAR Merged PMW

17
DJF 2003-2004 statistics using Australian Bureau of Meteorology 0.25 degree lat/lon daily rain gauge analyses for validationDJF 2003-2004 statistics using Australian Bureau of Meteorology 0.25 degree lat/lon daily rain gauge analyses for validation Red line = CMORPHRed line = CMORPH Blue line = Merged PMWBlue line = Merged PMW Black = gauge analysesBlack = gauge analyses

18
Limitations Present estimation algorithms cannot retrieve precip. over snow or ice covered surfaces - New algorithms being developed (Liu, Ferraro) Data Latency: ~ 18 hours past real-time Will not presently detect precip. that develops, matures & decays between microwave scans Limits on how far back data can be processed … early 1990’s?
 Data Latency: ~ 18 hours past real-time Will not presently detect precip. that develops, matures & decays between microwave scans Limits on how far back data can be processed … early 1990’s .")
19
Hourly, 0.25 degree lat/lon CMORPH timestamp = 1 (30 minutes from nearest PMW scan) correlation with Stage II radar rainfall (top panel)Hourly, 0.25 degree lat/lon CMORPH timestamp = 1 (30 minutes from nearest PMW scan) correlation with Stage II radar rainfall (top panel) Hourly, 0.25 degree lat/lon IR- based PMW/IR combined frequency matching rainfall estimation (IRFREQ) correlation with Stage II radar rainfall (2 nd from top)Hourly, 0.25 degree lat/lon IR- based PMW/IR combined frequency matching rainfall estimation (IRFREQ) correlation with Stage II radar rainfall (2 nd from top) CMORPH – radar rainfall correlation minus IRFREQCMORPH – radar rainfall correlation minus IRFREQ Correlation pair countsCorrelation pair counts
 correlation with Stage II radar rainfall (top panel)Hourly, 0.25 degree lat/lon CMORPH timestamp = 1 (30 minutes from nearest PMW scan) correlation with Stage II radar rainfall (top panel) Hourly, 0.25 degree lat/lon IR- based PMW/IR combined frequency matching rainfall estimation (IRFREQ) correlation with Stage II radar rainfall (2 nd from top)Hourly, 0.25 degree lat/lon IR- based PMW/IR combined frequency matching rainfall estimation (IRFREQ) correlation with Stage II radar rainfall (2 nd from top) CMORPH – radar rainfall correlation minus IRFREQCMORPH – radar rainfall correlation minus IRFREQ Correlation pair countsCorrelation pair counts")
20
Hourly, 0.25 degree lat/lon CMORPH timestamp = 2 (60 minutes from nearest PMW scan) correlation with Stage II radar rainfall (top panel)Hourly, 0.25 degree lat/lon CMORPH timestamp = 2 (60 minutes from nearest PMW scan) correlation with Stage II radar rainfall (top panel) Hourly, 0.25 degree lat/lon IRFREQ correlation with Stage II radar rainfall (2 nd from top)Hourly, 0.25 degree lat/lon IRFREQ correlation with Stage II radar rainfall (2 nd from top) CMORPH – radar rainfall correlation minus IRFREQCMORPH – radar rainfall correlation minus IRFREQ Correlation pair countsCorrelation pair counts
 correlation with Stage II radar rainfall (top panel)Hourly, 0.25 degree lat/lon CMORPH timestamp = 2 (60 minutes from nearest PMW scan) correlation with Stage II radar rainfall (top panel) Hourly, 0.25 degree lat/lon IRFREQ correlation with Stage II radar rainfall (2 nd from top)Hourly, 0.25 degree lat/lon IRFREQ correlation with Stage II radar rainfall (2 nd from top) CMORPH – radar rainfall correlation minus IRFREQCMORPH – radar rainfall correlation minus IRFREQ Correlation pair countsCorrelation pair counts")
21
Hourly, 0.25 degree lat/lon CMORPH timestamp = 3 (90 minutes from nearest PMW scan) correlation with Stage II radar rainfall (top panel)Hourly, 0.25 degree lat/lon CMORPH timestamp = 3 (90 minutes from nearest PMW scan) correlation with Stage II radar rainfall (top panel) Hourly, 0.25 degree lat/lon IRFREQ correlation with Stage II radar rainfall (2 nd from top)Hourly, 0.25 degree lat/lon IRFREQ correlation with Stage II radar rainfall (2 nd from top) CMORPH – radar rainfall correlation minus IRFREQCMORPH – radar rainfall correlation minus IRFREQ Correlation pair countsCorrelation pair counts
 correlation with Stage II radar rainfall (top panel)Hourly, 0.25 degree lat/lon CMORPH timestamp = 3 (90 minutes from nearest PMW scan) correlation with Stage II radar rainfall (top panel) Hourly, 0.25 degree lat/lon IRFREQ correlation with Stage II radar rainfall (2 nd from top)Hourly, 0.25 degree lat/lon IRFREQ correlation with Stage II radar rainfall (2 nd from top) CMORPH – radar rainfall correlation minus IRFREQCMORPH – radar rainfall correlation minus IRFREQ Correlation pair countsCorrelation pair counts")
22
Hourly, 0.25 degree lat/lon CMORPH timestamp = 4 (120 minutes from nearest PMW scan) correlation with Stage II radar rainfall (top panel)Hourly, 0.25 degree lat/lon CMORPH timestamp = 4 (120 minutes from nearest PMW scan) correlation with Stage II radar rainfall (top panel) Hourly, 0.25 degree lat/lon IRFREQ correlation with Stage II radar rainfall (2 nd from top)Hourly, 0.25 degree lat/lon IRFREQ correlation with Stage II radar rainfall (2 nd from top) CMORPH – radar rainfall correlation minus IRFREQCMORPH – radar rainfall correlation minus IRFREQ Correlation pair countsCorrelation pair counts
 correlation with Stage II radar rainfall (top panel)Hourly, 0.25 degree lat/lon CMORPH timestamp = 4 (120 minutes from nearest PMW scan) correlation with Stage II radar rainfall (top panel) Hourly, 0.25 degree lat/lon IRFREQ correlation with Stage II radar rainfall (2 nd from top)Hourly, 0.25 degree lat/lon IRFREQ correlation with Stage II radar rainfall (2 nd from top) CMORPH – radar rainfall correlation minus IRFREQCMORPH – radar rainfall correlation minus IRFREQ Correlation pair countsCorrelation pair counts")
23
The cumulative percentage of half hourly periods sampled for an eight day period, in 30 minute increments to nearest past/future scan, instantaneous (timestamp = 0, top)The cumulative percentage of half hourly periods sampled for an eight day period, in 30 minute increments to nearest past/future scan, instantaneous (timestamp = 0, top) cumulative % sampled within 30 minutes of half hourly frame (timestamp <= 1, middle) cumulative % sampled within 30 minutes of half hourly frame (timestamp <= 1, middle) cumulative % sampled within 60 minutes of half hourly frame (timestamp <= 2)cumulative % sampled within 60 minutes of half hourly frame (timestamp <= 2)
The cumulative percentage of half hourly periods sampled for an eight day period, in 30 minute increments to nearest past/future scan, instantaneous (timestamp = 0, top) cumulative % sampled within 30 minutes of half hourly frame (timestamp <= 1, middle) cumulative % sampled within 30 minutes of half hourly frame (timestamp <= 1, middle) cumulative % sampled within 60 minutes of half hourly frame (timestamp <= 2)cumulative % sampled within 60 minutes of half hourly frame (timestamp <= 2)")
24
Half hourly, 0.25 degree lat/lon CMORPH correlation against withheld MWCOMB rainfall 23 June – 6 August 2004. Temporal distance of CMORPH to nearest PMW scan = 30 minutes (timestamp = 1, top)Half hourly, 0.25 degree lat/lon CMORPH correlation against withheld MWCOMB rainfall 23 June – 6 August 2004. Temporal distance of CMORPH to nearest PMW scan = 30 minutes (timestamp = 1, top) Half hourly, 0.25 degree lat/lon IRFREQ correlation against withheld MWCOMB rainfall (timestamp = 1, 2 nd from top)Half hourly, 0.25 degree lat/lon IRFREQ correlation against withheld MWCOMB rainfall (timestamp = 1, 2 nd from top) CMORPH correlation minus IRFREQ (3 rd from top)CMORPH correlation minus IRFREQ (3 rd from top) # of correlation pairs (bottom)# of correlation pairs (bottom)
Half hourly, 0.25 degree lat/lon CMORPH correlation against withheld MWCOMB rainfall 23 June – 6 August Temporal distance of CMORPH to nearest PMW scan = 30 minutes (timestamp = 1, top) Half hourly, 0.25 degree lat/lon IRFREQ correlation against withheld MWCOMB rainfall (timestamp = 1, 2 nd from top)Half hourly, 0.25 degree lat/lon IRFREQ correlation against withheld MWCOMB rainfall (timestamp = 1, 2 nd from top) CMORPH correlation minus IRFREQ (3 rd from top)CMORPH correlation minus IRFREQ (3 rd from top) # of correlation pairs (bottom)# of correlation pairs (bottom).")
25
Half hourly, 0.25 degree lat/lon CMORPH correlation against withheld MWCOMB rainfall, temporal distance of CMORPH to nearest PMW scan = 60 minutes (timestamp = 2, top)Half hourly, 0.25 degree lat/lon CMORPH correlation against withheld MWCOMB rainfall, temporal distance of CMORPH to nearest PMW scan = 60 minutes (timestamp = 2, top) Half hourly, 0.25 degree lat/lon IRFREQ correlation against withheld MWCOMB rainfall (timestamp = 2, 2 nd from top)Half hourly, 0.25 degree lat/lon IRFREQ correlation against withheld MWCOMB rainfall (timestamp = 2, 2 nd from top) CMORPH correlation minus IRFREQ (3 rd from top)CMORPH correlation minus IRFREQ (3 rd from top) # of correlation pairs (bottom)# of correlation pairs (bottom)
Half hourly, 0.25 degree lat/lon CMORPH correlation against withheld MWCOMB rainfall, temporal distance of CMORPH to nearest PMW scan = 60 minutes (timestamp = 2, top) Half hourly, 0.25 degree lat/lon IRFREQ correlation against withheld MWCOMB rainfall (timestamp = 2, 2 nd from top)Half hourly, 0.25 degree lat/lon IRFREQ correlation against withheld MWCOMB rainfall (timestamp = 2, 2 nd from top) CMORPH correlation minus IRFREQ (3 rd from top)CMORPH correlation minus IRFREQ (3 rd from top) # of correlation pairs (bottom)# of correlation pairs (bottom)")
26
Half hourly, 0.25 degree lat/lon CMORPH correlation against withheld MWCOMB rainfall, temporal distance of CMORPH to nearest PMW scan = 90 minutes (timestamp = 3, top)Half hourly, 0.25 degree lat/lon CMORPH correlation against withheld MWCOMB rainfall, temporal distance of CMORPH to nearest PMW scan = 90 minutes (timestamp = 3, top) Half hourly, 0.25 degree lat/lon IRFREQ correlation against withheld MWCOMB rainfall (timestamp = 3, 2 nd from top)Half hourly, 0.25 degree lat/lon IRFREQ correlation against withheld MWCOMB rainfall (timestamp = 3, 2 nd from top) CMORPH correlation minus IRFREQ (3 rd from top)CMORPH correlation minus IRFREQ (3 rd from top) # of correlation pairs (bottom)# of correlation pairs (bottom)
Half hourly, 0.25 degree lat/lon CMORPH correlation against withheld MWCOMB rainfall, temporal distance of CMORPH to nearest PMW scan = 90 minutes (timestamp = 3, top) Half hourly, 0.25 degree lat/lon IRFREQ correlation against withheld MWCOMB rainfall (timestamp = 3, 2 nd from top)Half hourly, 0.25 degree lat/lon IRFREQ correlation against withheld MWCOMB rainfall (timestamp = 3, 2 nd from top) CMORPH correlation minus IRFREQ (3 rd from top)CMORPH correlation minus IRFREQ (3 rd from top) # of correlation pairs (bottom)# of correlation pairs (bottom)")
27
Half hourly, 0.25 degree lat/lon CMORPH correlation against withheld MWCOMB rainfall, temporal distance of CMORPH to nearest PMW scan = 120 minutes (timestamp = 4, top)Half hourly, 0.25 degree lat/lon CMORPH correlation against withheld MWCOMB rainfall, temporal distance of CMORPH to nearest PMW scan = 120 minutes (timestamp = 4, top) Half hourly, 0.25 degree lat/lon IRFREQ correlation against withheld MWCOMB rainfall (timestamp = 4, 2 nd from top)Half hourly, 0.25 degree lat/lon IRFREQ correlation against withheld MWCOMB rainfall (timestamp = 4, 2 nd from top) CMORPH correlation minus IRFREQ (3 rd from top)CMORPH correlation minus IRFREQ (3 rd from top) # of correlation pairs (bottom)# of correlation pairs (bottom)
Half hourly, 0.25 degree lat/lon CMORPH correlation against withheld MWCOMB rainfall, temporal distance of CMORPH to nearest PMW scan = 120 minutes (timestamp = 4, top) Half hourly, 0.25 degree lat/lon IRFREQ correlation against withheld MWCOMB rainfall (timestamp = 4, 2 nd from top)Half hourly, 0.25 degree lat/lon IRFREQ correlation against withheld MWCOMB rainfall (timestamp = 4, 2 nd from top) CMORPH correlation minus IRFREQ (3 rd from top)CMORPH correlation minus IRFREQ (3 rd from top) # of correlation pairs (bottom)# of correlation pairs (bottom)")
28
Daily times series of correlation comparing IRFREQ, CMORPH, and CMORPH-IR 0.25 degree lat/lon rainfall estimates with same high-quality rain gauge and radar analyses over the U.S. for the 7 May – 27 July 2004 period. IRFREQ = blue lines CMORPH = green lines CMORPH-IR = red lines

30
Improve accuracy of CMORPH PMW rainfall vectors Continue to investigate model winds – GMORPH Continue investigation into the development of CMORPH – IR FUTURE WORK

31
Further Information Satellite Estimated Rainfall Validation over United States: http://www.cpc.ncep.noaa.gov/products/janowiak/us_web.shtml Australia: http://www.bom.gov.au/bmrc/wefor/staff/eee/SatRainVal/dailyval.html CMORPH Web: http://www.cpc.ncep.noaa.gov/products/janowiak/cmorph.htmlhttp://www.cpc.ncep.noaa.gov/products/janowiak/cmorph.html (includes data access info.) E-mail: john.janowiak@noaa.gov or robert.joyce@noaa.govjohn.janowiak@noaa.govrobert.joyce@noaa.gov Paper: Joyce, R. J., J. E. Janowiak, P. A. Arkin and P. Xie, 2004: CMORPH: A method that produces global precipitation estimates from passive microwave and infrared data at high spatial and temporal resolution. J. Hydromet. Vol. 5, No. 3, pages 487-503. The End – Thank You

Similar presentations


 Part II: Drizzle Detection.>")

>")


 forecasts during the 2003-04 Australian tropical cyclone season Beth Ebert BMRC, Melbourne, Australia.>")


