Download presentation
Presentation is loading. Please wait.

1
Real-Time Sea Ice Detection from Coastal Radars 3 rd Ice Analyst WorkshopTuomas Niskanen 14-18 of June, 2011Oceanographic Services Copenhagen, DenmarkFinnish Meteorological Institute

2
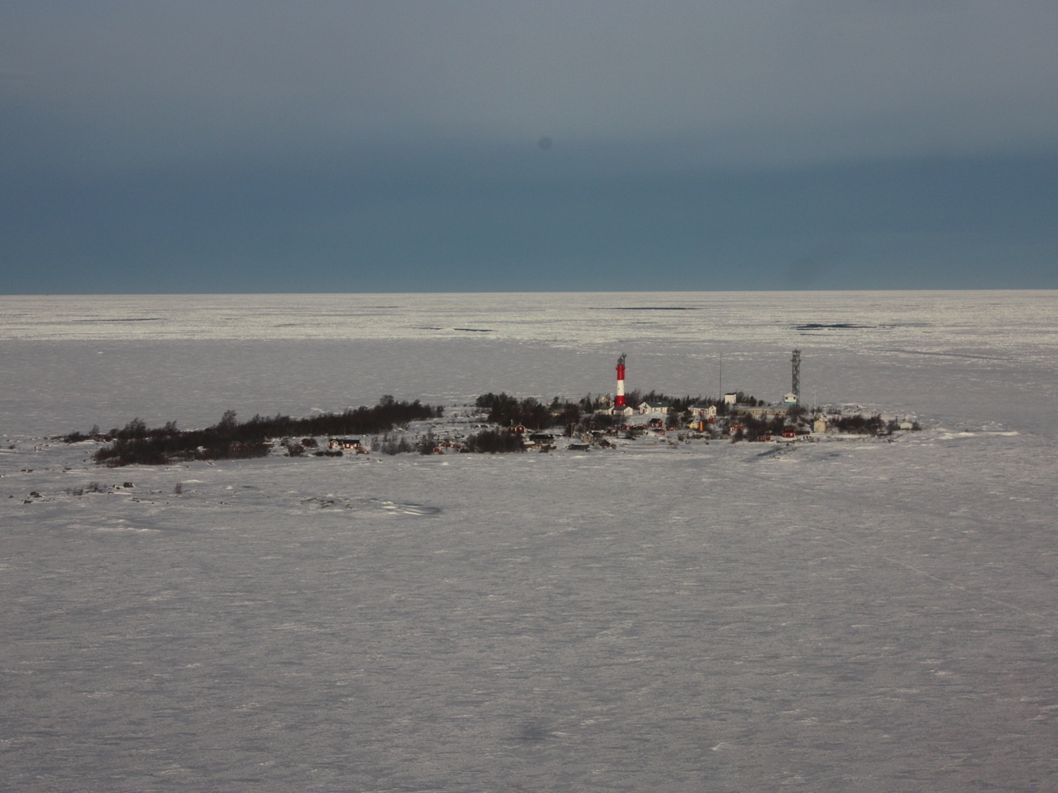
Coastal radars are part of an existing VTS network VTS = Vessel Traffic Service 20 to 30 non-military fixed coastal radars along the Finnish coast The radars are designed for observing targets Movements of ice are noise which is normally filtered out With an external device, the filtered signal can be processed in order to get movements of ice out Background Hailuoto Tankar

3
ShipSensorNet project in 2008 Founded by TEKES (Finnish Funding Agency for Technology and Innovation) External signal capturing device by ImageSoft Oy Ice movements can be brought out from processed filtered signal The external device can be installed into radars Vessels, coastal radar stations, etc. The technology has been in use RV Aranda Icebreaker Otso Hailuoto, Raahe and Tankar Background

4
Coastal radars currently used for sea ice monitoring BACKGROUND RadarSat-2 image on 10 th of Feb 2011 TANKAR HAILUOTO COASTAL RADARS TERMA 9 Ghz X-band Antenna height Hailuoto: 30.2 m Tankar: 37.8 m 1

5
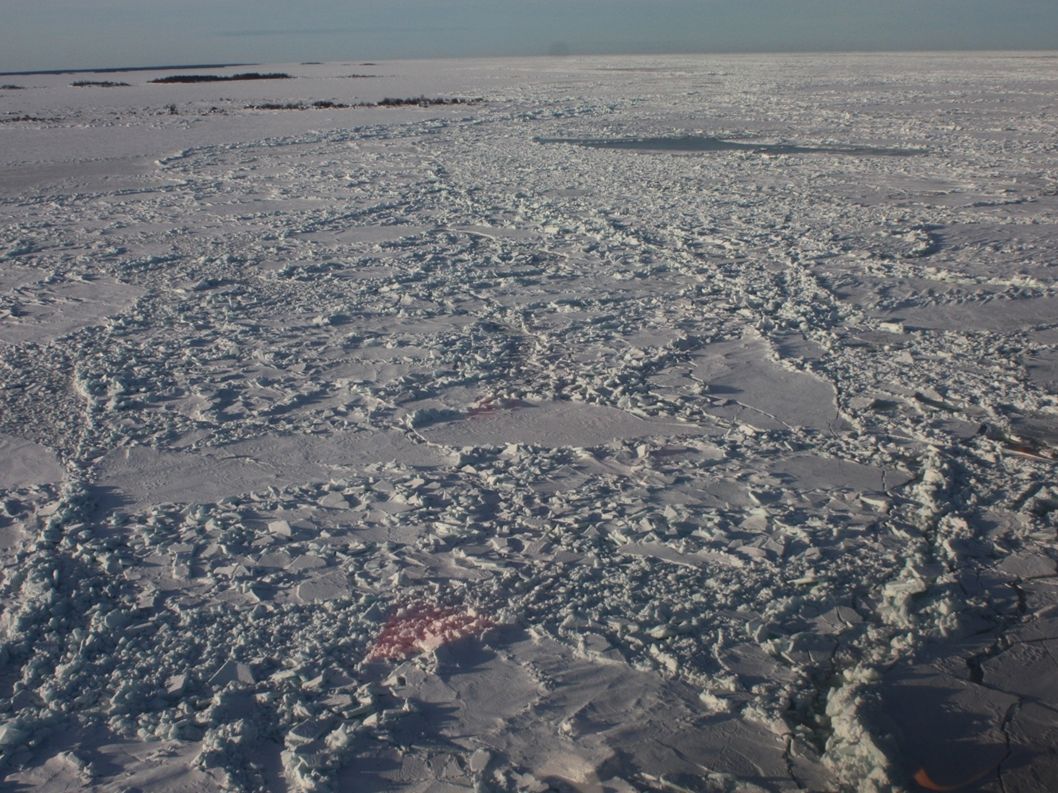
Satellite SAR Image vs. Coastal radar Image

6
Data flow Image capturing device Coastal radar Image post processing at FMI’s server Via 3G mobile link Ice Service Scientific database Future customers

7
Advantages Satellite Strength: covers large area at one pass Weakness: passes same area once in 1-2 days Coastal radar Strength: covers certain area every 2 seconds Weakness: maximum coverage approximately 30 km * 30 km Advantage of coastal radar images and animations Useful tool for ice forecasting and charting when there are no satellite images available

8
RadarSat-2 ImageCoastal Radar Image Area coverage

9
Ice motion, divergence and rotation determined from consecutive images IMAGE INTERVAL 2 sec SIZE 30 km ROTATION red = clocwise blue = anticlocwise DIVERGENCE red = closing blue = opening

10
Coastal radars in operational use at FMI Today at Finnish Ice Service Animation is created with 2 minutes interval Length of animation is 2 days In daily operational use since Jan 2011 Several other operational and research options

11
Coastal radars in operational use at FMI Future plans More image capturing devices need to be installed One will be installed to the Quark for winter 2011-12 In the future a mosaic of several devices? Different animations (divergence, rotation)? Colorization of black-white images? can bring out more details from ice field
. Colorization of black-white images. can bring out more details from ice field.")
Similar presentations

 is responsible for issuing warnings and forecasts to protect life and property in the maritime community. Area of responsibility.>")


 Engr. Mehran Mamonai. Introduction Every good RF design, after its implantation should be evaluated. There are few ways to do.>")


 Finnish Institute of Marine Research IICWG-4, St. Petersburg, Russia,>")


