Download presentation
Presentation is loading. Please wait.

1
Lecture 7 Chapter 7 – Correlation & Differential (Quasi)
")
2
Ch. 7 – Correlational & Differential Correlational: Strength of association No manipulation Differential (quasi): Strength of association Preexisting characteristic Has the non manipulated IV BUT..CANNOT INFER CAUSALITY BECAUSE YOU DID NOT MANIPULATE THE IV
: Strength of association Preexisting characteristic Has the non manipulated IV BUT..CANNOT INFER CAUSALITY BECAUSE YOU DID NOT MANIPULATE THE IV.")
3
Does not infer causation but… Serves as basis for true experiments Can make predictions …however cannot infer cause…why it happens Group differences exist before study conducted

4
Differential Research (quasi): Looks like experimental design but lacks key ingredient Random Assignment (important for Stats) Use when the manipulation of IV is impractical, impossible or ethically inappropriate Ex: Cancer, stroke, depression, gender etc…
: Looks like experimental design but lacks key ingredient Random Assignment (important for Stats) Use when the manipulation of IV is impractical, impossible or ethically inappropriate Ex: Cancer, stroke, depression, gender etc…")
5
Differential Research (quasi): groups already set up Cross-sectional design used mainly in developmental studies (one snap shot in time – various age groups) Limitations & Problems: relationship between IV & DV may not be real but may be due to a shared life experience “Cohort Effect” :shared experience Older people more cautious about going into debt than younger people Great Depression
: groups already set up Cross-sectional design used mainly in developmental studies (one snap shot in time – various age groups) Limitations & Problems: relationship between IV & DV may not be real but may be due to a shared life experience Cohort Effect :shared experience Older people more cautious about going into debt than younger people Great Depression")
6
Differential Research (Quasi) Used in many applied settings hospitals, schools, business EX: (SCHOOLS) investigate the effectiveness of 2 types of reading programs - 1 school?? Set up your own school?? (not feasible) - go to 2 existing schools that use programs
 - go to 2 existing schools that use programs.")
7
Correlational Research (limitations) Precautions when measuring variables: (pairs of data) Researcher influencing the participant 1.Never allow the same person to collect both measures on the participant 2. Never allow the researcher to know the participant’s score on the first measure until after the second measure has been taken Ex. Research question is their a relationship between the amount of time in takes to eat and ability to exercise? Experimenter expectancy Experimenter reactivity

8
Correlational Research Precautions when measuring variables: Measurement Reactivity Participant Any effect on the participant’s behavior that is a result of the participant knowing he/she is being observed or measured – participant believes he/she knows what response is expected -filler items: insert questions that are irrelevant to focus of study -use measures beyond the control of the participant Ex. Instead of an anxiety scale…measure physiological activity

9
Correlational Research Precautions when measuring variables Confounding variables: extraneous variable systematically changes along with the variable of interest – don’t know if relationship is due to our variable of interest.. Ex: men that are more attractive are better liked: what if more men in this study dressed better too …are they more likable because of the are more attractive?

10
Extension of Descriptive Statistics Correlation: measures the relationship between 2 variables Correlation coefficient (r) strength (# value) & direction (+ or -) Pearson Product-Moment Coefficient A number between –1 & 1 Describes the relationship btwn pairs of variables r = 1.00 r = -1.00 Perfect positive correlationPerfect negative correlation Drinking & Accidents Study time & Party time
 strength (# value) & direction (+ or -) Pearson Product-Moment Coefficient A number between –1 & 1 Describes the relationship btwn pairs of variables r = 1.00 r = Perfect positive correlationPerfect negative correlation Drinking & Accidents Study time & Party time")
11
Scatter plots: - similar to line graphs (horizontal and vertical axes, x & y axis) - scatter plots show how much one variable is affected by another -the relationship between two variables is called their correlation - usually consist of a large body of data points (pairs of scores)
 - scatter plots show how much one variable is affected by another -the relationship between two variables is called their correlation - usually consist of a large body of data points (pairs of scores)")
12
Correlational Research Analyze Data Measure an index of the degree of the relationship Both at least interval scale One ordinal, one at least ordinal Pearson product-moment correlation coefficient Spearman rank-order correlation Degree of linear relationship Correlation coefficients: -1.00 to 1.00

13
= r

14
Coefficient of determination = r 2 Measure of the amount of variance shared by the two variables How much variability in one score can be explained by the variability in the other score, so… r =.60 r 2 =.36 36% of the variation in school performance can be accounted for by the variation in intelligence 36% of the change in one variable can account for the change in the other variable

15
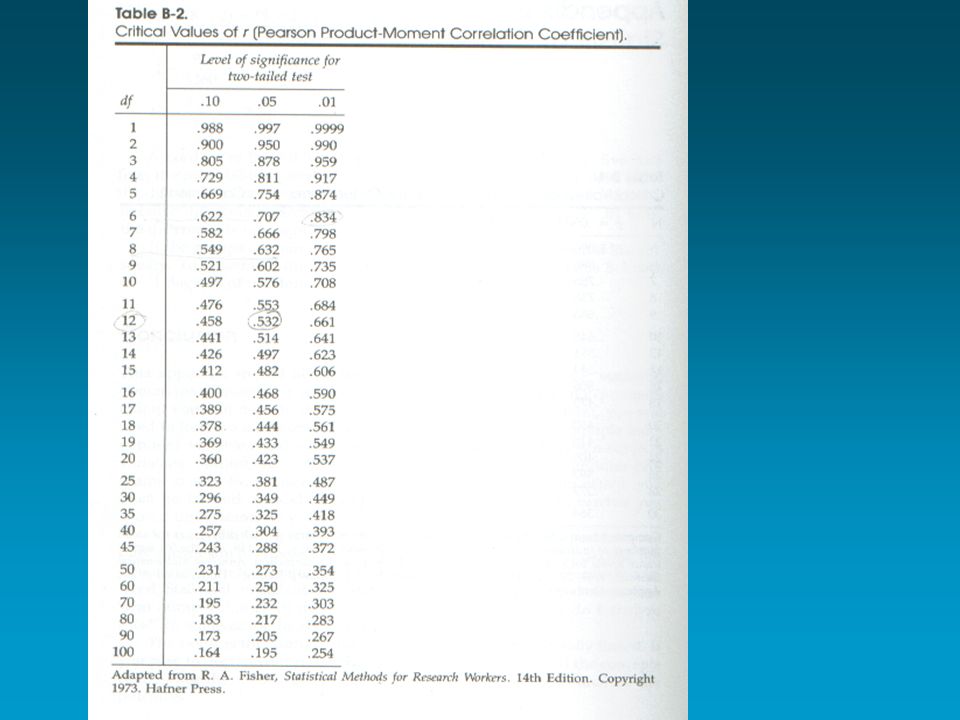
Correlation Problem You have noticed that the more x-mas cards you mail the more you receive…. Get your calculators out… Test whether an r of this size is statistically significant with 8 pairs Of scores…testing the null hypothesis...here that the correlation is 0

16
Correlation Problem r = degree to which X & Y vary together degree to which X & Y vary separately

17
Degrees of freedom (df): n-1 When we use samples we approximate to represent the true population Tends to underestimate population variability Restriction is placed = making up for this mathematically by using n-1 in denominator estimate some unknown population = price we pay for sampling Pearson r: df=n-2 (n=pairs)
: n-1 When we use samples we approximate to represent the true population Tends to underestimate population variability Restriction is placed = making up for this mathematically by using n-1 in denominator estimate some unknown population = price we pay for sampling Pearson r: df=n-2 (n=pairs)")
18
Degrees of freedom (df): n-1 The number of values (scores) that are free to vary given mathematical restrictions on a sample of observed values used to estimate some unknown population = price we pay for sampling
: n-1 The number of values (scores) that are free to vary given mathematical restrictions on a sample of observed values used to estimate some unknown population = price we pay for sampling")
19
Degrees of freedom (df): n-1 Number of scores free to vary Data Set you know the mean (use mean to compute variance) n=2 with a mean of 6 X8?6X8?6 In order to get a mean of 6 with an n of 2…need a sum of 12…second score must be 4… second score is restricted by sample mean (this score is not free to vary) =x
: n-1 Number of scores free to vary Data Set you know the mean (use mean to compute variance) n=2 with a mean of 6 X8 6X8 6 In order to get a mean of 6 with an n of 2…need a sum of 12…second score must be 4… second score is restricted by sample mean (this score is not free to vary) =x")
Similar presentations


. Correlation coefficient: statistic.>")


.>")
 by calculating.>")


