Download presentation
Presentation is loading. Please wait.

1
EVALUATION REPORT Derek R. Lane, Ph.D. Department of Communication University of Kentucky

4
Evaluation Questions RQ1: What is the reliability of existing scales for evaluating the faculty (n=11) and student (n=198) dimensions of TBL Team Science implementation? RQ2: What are the differences in student perceptions with respect to first-time and more experienced TBL teachers? RQ3: How do student perceptions of TBL different with respect to lecture and lab classes? RQ4: How do student perceptions of TBL Team Science differ as a function of course section? RQ5: How has the curricular development impacted student achievement scores (withdrawal, unsatisfactory scores)?
 .")
5
Methods Cross-sectional Post-test Only Survey Research Design Eleven Dependent Measures Scales where appropriate Single item measures Three open-ended questions Multiple Analysis of Variance Analysis Eleven Dependent Measures

6
Measures Positive Attitudes about Learning Student Motivation TBL Attitudes Value of Teams Self Efficacy Self-Reported Learning Motivation to Excel in College Overall Quality of Group Experiences During Semester Teacher Caring Teacher Classroom Management Teacher Immediacy

7
Sample Demographics Gender (54% Male; 46% Female) Class Rank (75% Sophomore) Ethnicity (70% Caucasian)
 Class Rank (75% Sophomore) Ethnicity (70% Caucasian)")
8
Sample Demographics GPA (68% 3.0-3.5) Full-time (85%) Major (~32% Pre-professional)
 Full-time (85%) Major (~32% Pre-professional)")
10
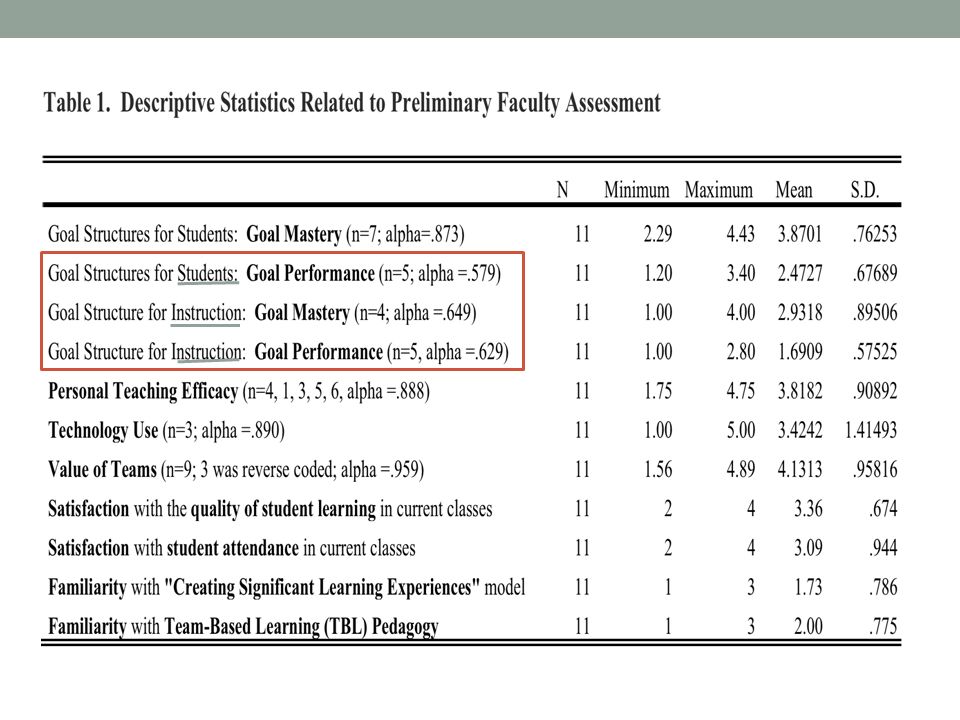
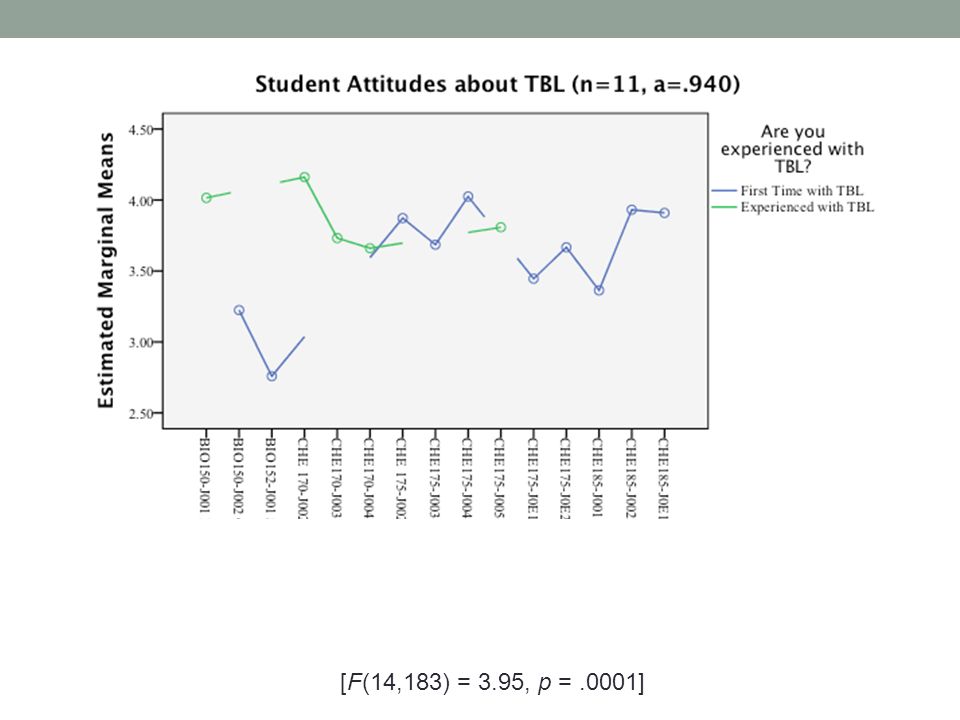
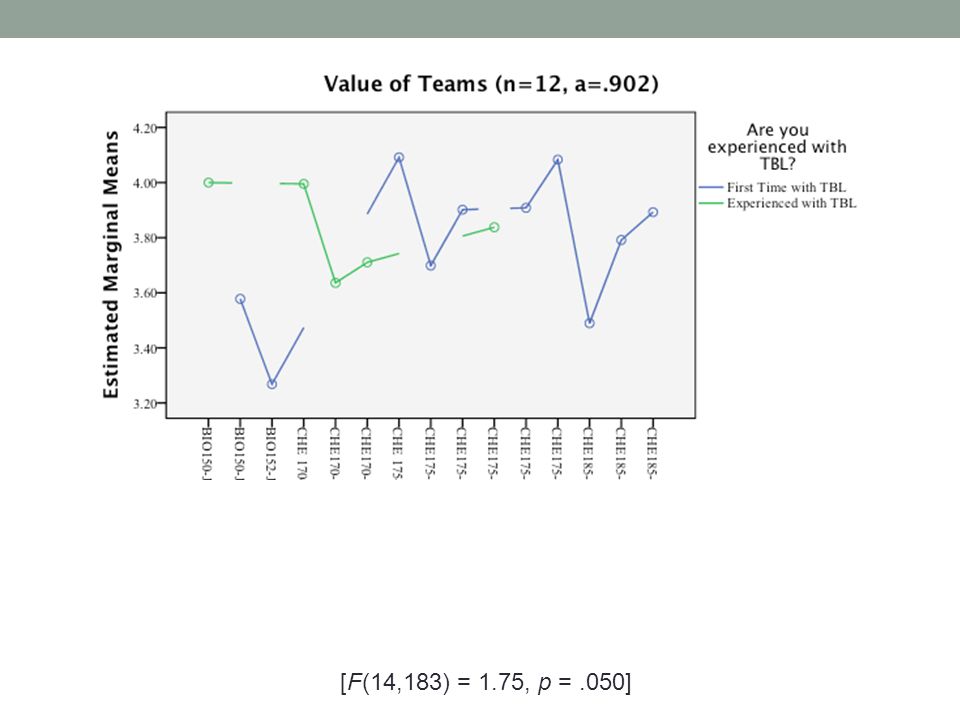
Student Measures - Scales Positive Attitudes about Learning n=7, α=.913, range = 1-7 mean = 5.64, s.d. = 1.02 Student Motivation n=8, α=.885, range = 1-7 mean = 5.07, s.d. = 1.09 TBL Attitudes n=11, α=.940, 1-5 mean = 3.65, s.d. =.84 Value of Teams n=12, α=.902, range = 1-5 mean = 3.74, s.d. =.68 Self Efficacy n=5, α=.929, range = 1-5 mean = 4.16, s.d. =.76 Self-Reported Learning n=9, α=.782, range = 1-5 mean = 3.81, s.d. =.59

11
Student Measures – Single Items Overall Motivation to Excel in College range = 1 – 7 mean = 5.99, s.d. = 1.05 Overall Quality of Group Experiences this Semester range = 0 - 100 mean = 66.04, s.d. = 26.53

12
Teacher Measures - Scales Teacher Caring n=6, α=.80, range = 1-7 mean = 5.69, s.d. = 1.09 Teacher Classroom Management n=7, α=.938, range = 1-5 mean = 4.16, s.d. =.80 Teacher Immediacy n=8, α=.749, range = 1-5 mean = 3.96, s.d. =.60

13
RQ2: First Time TBL Teachers vs. Experienced TBL Teachers (n=198)
")
14
RQ3: Lab Classes vs. Lecture Classes (n=198)
")
15
[F(14,183) = 1.92, p =.026]
![[F(14,183) = 1.92, p =.026]](http://images.slideplayer.com/24/6930032/slides/slide_15.jpg "[F(14,183) = 1.92, p =.026]")
17
[F(14,183) = 3.95, p =.0001]
![[F(14,183) = 3.95, p =.0001]](http://images.slideplayer.com/24/6930032/slides/slide_17.jpg "[F(14,183) = 3.95, p =.0001]")
19
[F(14,183) = 1.75, p =.050]
![[F(14,183) = 1.75, p =.050]](http://images.slideplayer.com/24/6930032/slides/slide_19.jpg "[F(14,183) = 1.75, p =.050]")
22
Student Outcomes in Selected Chemistry and Biology Courses 2008-2009 Academic Year

24
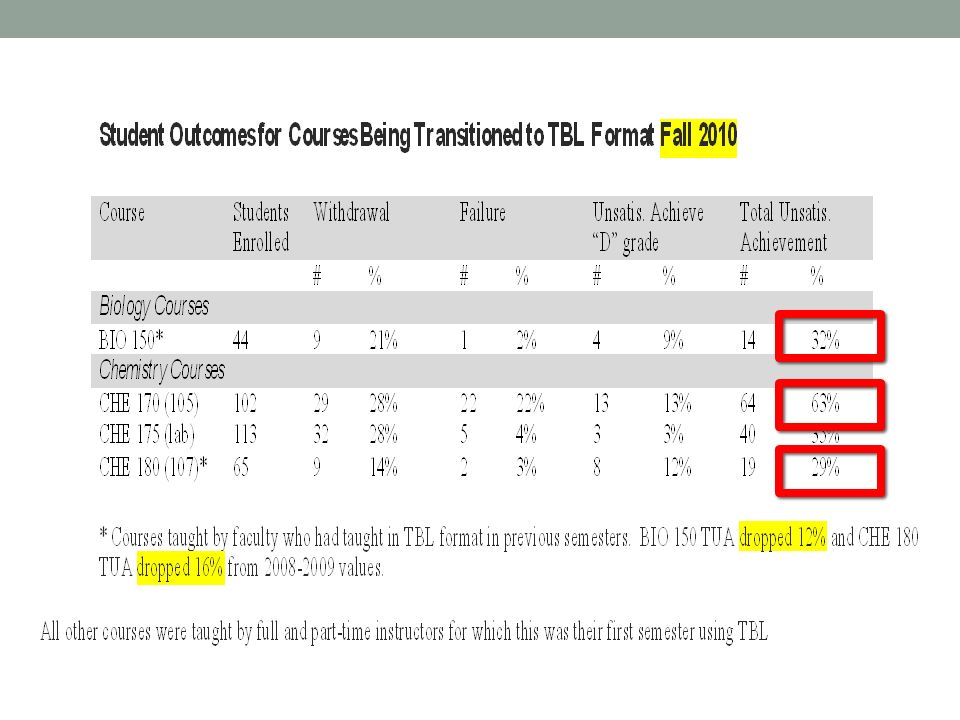
Table 4. Student Outcomes for Courses Being Transitioned to TBL Format Spring 2011 * Two courses –one taught by an experienced faculty member (22% TUA) and one by a part-time untrained but mentored faculty member (46% TUA).
 and one by a part-time untrained but mentored faculty member (46% TUA)..")
25
Evaluation Results RQ1: What is the reliability of existing scales for evaluating the faculty (n=11) and student (n=198) dimensions of TBL Team Science implementation? All scales operated at acceptable to excellent levels except the problems associated with GOAL STRUCTURES, and TEACHER IMMEDIACY measures. RQ2: What are the differences in student perceptions with respect to first-time and more experienced TBL teachers? EXPECTED! Higher scores for experienced teachers on motivation, TBL attitudes, group experiences, and perceived learning. Significant differences for first time classes on positive learning attitudes. RQ3: How do student perceptions of TBL different with respect to lecture and lab classes? GOOD NEWS! No significant differences; though lab means were higher for all measures except classroom management, immediacy, and learning). RQ4: How do student perceptions of TBL Team Science differ as a function of course section? Courses were significantly different for only 3 of the 11 measures: overall group experiences, TBL attitudes, and the perceived value of teams)—explained by experience teaching TBL courses. RQ5: How has the curricular development impacted student unsatisfactory achievement scores (withdrawal, unsatisfactory scores)? Improvements between 7 – 16%; mean=12.2%. BIO 150 improved 9- 12% from 44% to 32% to 35% BIO 152 improved 17% from 32% to 15% CHE 170 improved 7% from 48% to 63% to 41% CHE 180 improved 16% from 45% to 29%
. RQ4: How do student perceptions of TBL Team Science differ as a function of course section. Courses were significantly different for only 3 of the 11 measures: overall group experiences, TBL attitudes, and the perceived value of teams)—explained by experience teaching TBL courses. RQ5: How has the curricular development impacted student unsatisfactory achievement scores (withdrawal, unsatisfactory scores). Improvements between 7 – 16%; mean=12.2%. BIO 150 improved 9- 12% from 44% to 32% to 35% BIO 152 improved 17% from 32% to 15% CHE 170 improved 7% from 48% to 63% to 41% CHE 180 improved 16% from 45% to 29%.")
26
Qualitative Results Strengths of TBL Experiences Challenging/Engaging Hands-on Applications Collaboration and Peer Support Outstanding Instruction Suggestions for Improving TBL Experiences Improve structural issues related to... Time management (4s, no need for outside meetings) Individual accountability (peer evaluation) Balance between individual and group expectations Specificity of RATs and Assignments (i.e., experiments, group appeals) Logistical Issues Timely return of graded assignments Improve online organization of assignments More realistic experiments
 Individual accountability (peer evaluation) Balance between individual and group expectations Specificity of RATs and Assignments (i.e., experiments, group appeals) Logistical Issues Timely return of graded assignments Improve online organization of assignments More realistic experiments.")
27
Qualitative Results Additional Comments Identify TBL Sections Improve Teacher Training Student Preparation Teacher Clarity

28
Discussion Implications Limitations Post-test only Sample – representative? Future Directions – this semester Pretest on attitudes Pretest on cognition Other measures to include Teacher Credibility? Student Engagement? Follow-up interviews with students who drop or fail to perform to standards?

29
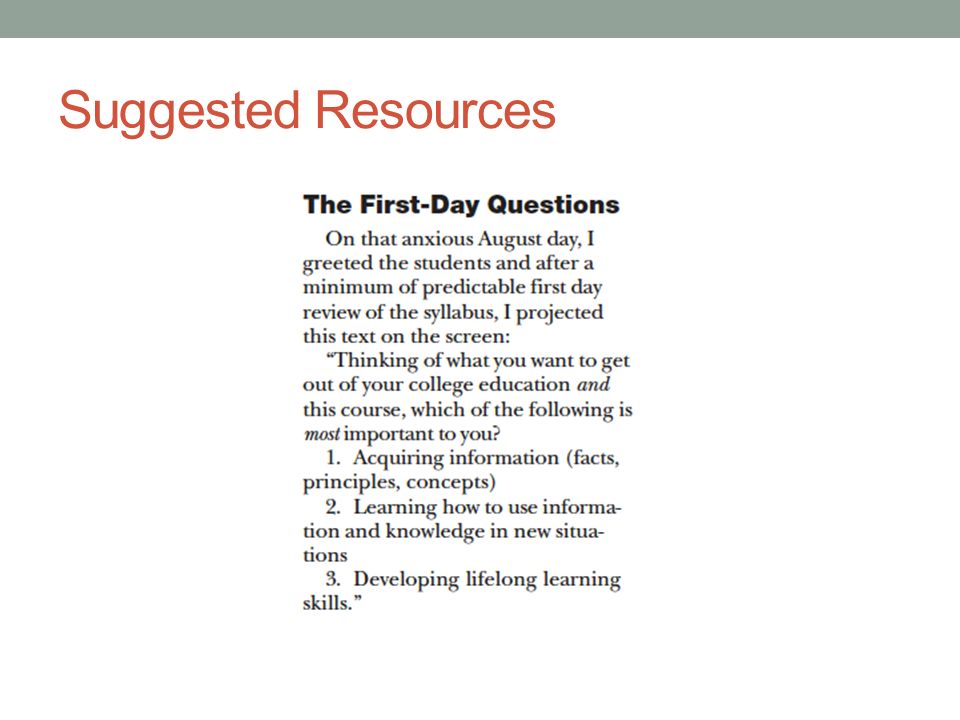
Suggested Resources

32
EVALUATION REPORT Derek R. Lane, Ph.D. Department of Communication University of Kentucky

Similar presentations


 Community College Faculty Survey of Student Engagement 2005 Findings Presenter: LaSylvia Pugh – September 14, 2006.>")


 Bernard Longden (U.K.)>")


