Download presentation
Presentation is loading. Please wait.

1
Overview of USGS Groundwater Quality Assessment Activities and Related Data in Alabama 2011 Alabama Water Resources Conference September 9, 2011, Perdido Beach Resort, Orange Beach, Alabama Richard Moreland, USGS, Montgomery, Alabama

2
Groundwater Projects National Studies National Water Quality Assessment Program (NAWQA) Cooperative Programs Occurrence of Pesticides in Groundwater in Areas of Intense Row Crop Production in Alabama, 2009 Alabama Department of Agriculture and Industries Capitol City Plume EPA USGS Alabama WSC
 Cooperative Programs Occurrence of Pesticides in Groundwater in Areas of Intense Row Crop Production in Alabama, 2009 Alabama Department of Agriculture and Industries Capitol City Plume EPA USGS Alabama WSC")
3
Groundwater Projects Cooperative Programs – cont. Groundwater networks Active ground-water levels Real-time data Climate Response Network

4
National Water Quality Assessment Program Montgomery Urban Land Use Study 30 wells sampled in 1999 Tape downs annually on all wells Subset of five wells plus one reference well sampled biannually for trend analysis Mobile Urban Land Use Study 31 wells drilled in 2010 Sampled in 2011 – full suite of QW constituents (Nutrients, trace metals, pesticides, VOCs, bacteria)
")
5
Lower Tennessee River Basin Agricultural groundwater study 30 wells originally sampled in 1999 Subset of 5 wells sampled biannually for trend analysis National Water Quality Assessment Program

6
Montgomery Urban Land Use Study Resampled this past May. Waiting for results. 21 3 10 20 17 5

7
Mobile Urban Land Use Study 30 wells targeting residential/light commercial land use.

8
First round of sampling ongoing VOC’s, pesticides, nutrients, major ions, trace elements, DOC, age dating.

9
Occurrence of Pesticides in GW in Areas of Intense Row Crop Production Alabama Department of Agriculture and Industries – Pesticide Management Branch

10
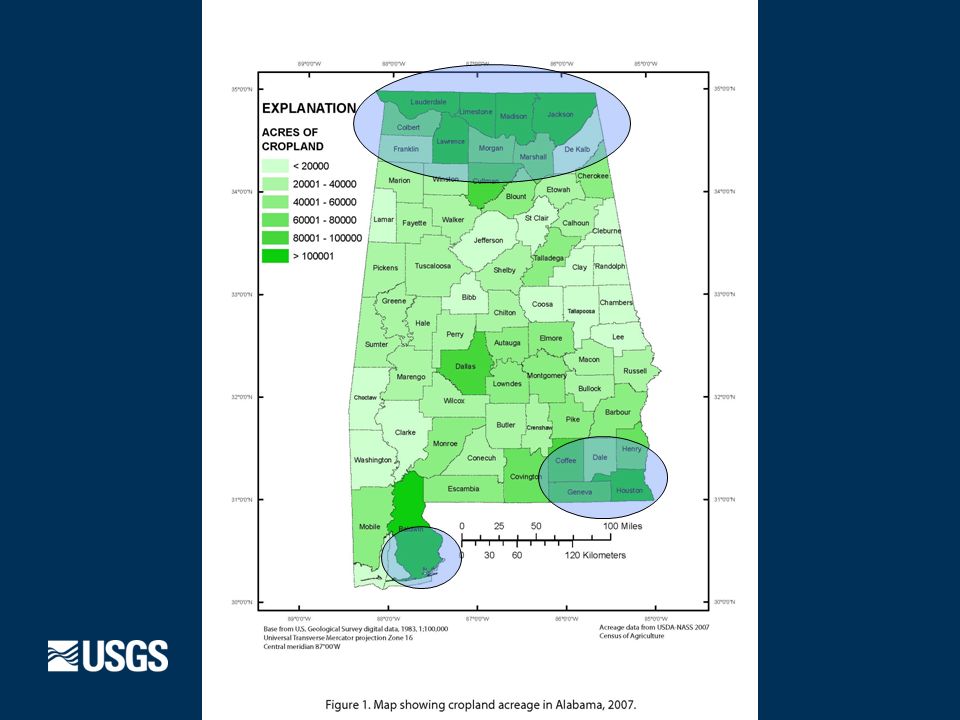
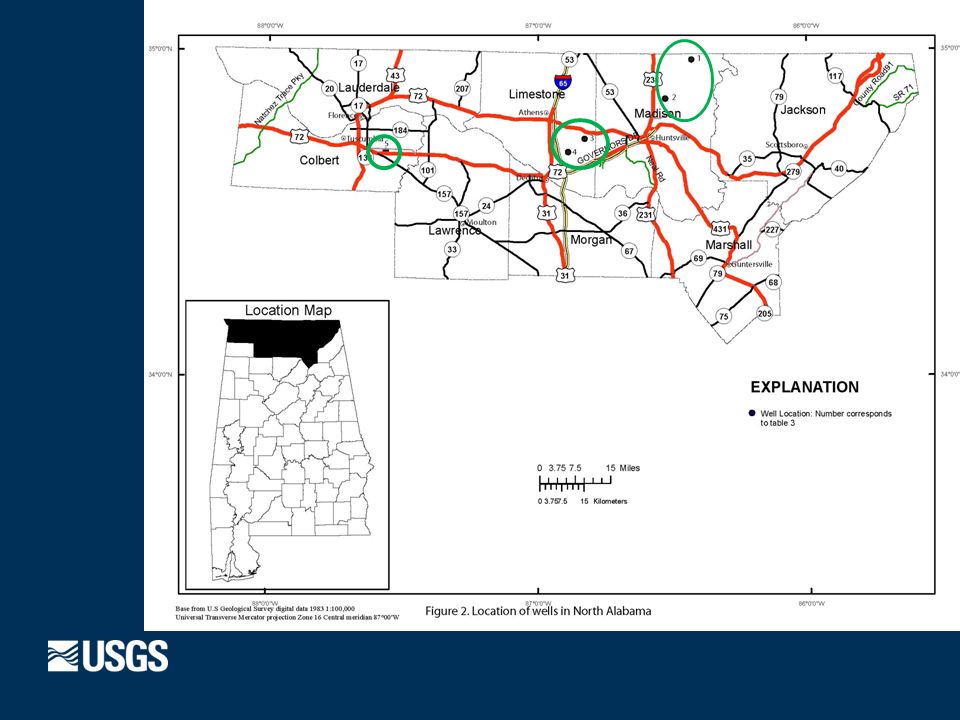
Occurrence of Pesticides in GW in Areas of Intense Row Crop Production Purpose and Scope Multi-year study – initial sampling in FY09 Evaluate trends in detection frequencies and concentrations of pesticides in GW near areas of high-intensity row crop production. Sample 15 wells in three areas of state. Northern Alabama Southeast Alabama Baldwin County Samples analyzed for temperature, specific conductance, DO, pH, and pesticides.

13
Sampling sites – Southeast Alabama

15
Occurrence of Pesticides in GW in Areas of Intense Row Crop Production Results Samples analyzed for 87 filtered pesticides and pesticide degradates using GC/MS Three most frequently detected cpds Atrazine -- in 9 wells CIAT 2-Chloro-4-isopropylamino-6-amino-s-triazine - 9 wells Metolachor – in 8 wells Highest number of pesticides detected Well 1 and 4 (13 cpd), Well 5 (10 cpd), Well 3 (9 cpd), & Well 2 and Well 6 (8cpd)
, Well 5 (10 cpd), Well 3 (9 cpd), & Well 2 and Well 6 (8cpd)")
16
Occurrence of Pesticides in GW in Areas of Intense Row Crop Production Results – continued Highest concentration for any analyte – 4.30 ug/L for metolachlor in well 15 in Baldwin Co. (4.08 ug/L 2009)
.")
17
Capitol City Plume Monitoring U.S. Environmental Protection Agency

18
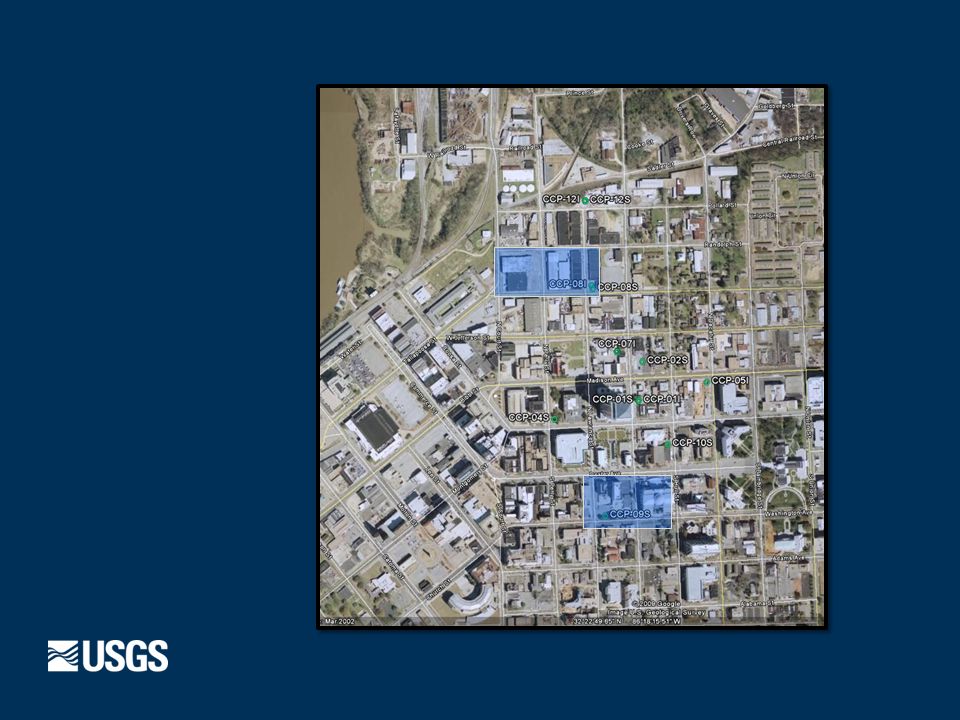
Capitol City Plume Monitoring Capitol City Plume is an area of groundwater contamination identified in downtown Montgomery, Alabama. The main contaminant of concern in the plume is tetrachloroethylene (PCE). PCE is an organic compound commonly used in dry-cleaning and degreasing. The site is listed on the National Priorities List and is currently being evaluated for potential remediation strategies by the U.S. Environmental Protection Agency. USGS has provided Capitol City Plume monitoring data to the USEPA in support of the remediation investigation, led by Dr. James Landmeyer South Carolina WSC.
. PCE is an organic compound commonly used in dry-cleaning and degreasing. The site is listed on the National Priorities List and is currently being evaluated for potential remediation strategies by the U.S. Environmental Protection Agency. USGS has provided Capitol City Plume monitoring data to the USEPA in support of the remediation investigation, led by Dr. James Landmeyer South Carolina WSC..")
19
Capitol City Plume Monitoring USGS collected samples for analysis of dissolved gases for assessment of groundwater age. Samples were collected from the same 13 wells sampled in 2009. In 2011 numerous GORE passive vapor sampling modules were installed. Five nested soil vapor monitor wells installed near one of suspected sources.

20
Capitol City Plume Monitoring 13 existing monitoring wells were sampled in spring 2010 Samples collected for age dating

21
Atmospheric mixing ratios of CFC-11, CFC-12, CFC-113, and SF 6 in North American air. SF 6 and CFC data show groundwater ages range from 1952 to 2009.

25
PCE

26
BTEX

27
Groundwater Networks

29
Active Ground-Water Level Network Active Well Count Real- Time: 1,222Daily:1,185Periodic:16,833 Active Ground-Water Level Network

30
Real-Time Ground-Water Level Network Real-Time Ground-Water Level Network Well Count: 1,222

31
Alabama Real-Time Network

32
Alabama Climate Response Network

33
Alabama Real-Time Network Madison County

34
Alabama Real-Time Network Montgomery 3 Well Montgomery Water Works and Sanitary Sewer Board

35
Daily Ground-Water Data Most recent Provisional daily data value: 30.12 on 09/05/11

36
Montgomery 3 Well Well Depth: 270 feet Local Aquifer: Eutaw Formation Current water level: 30.12 ft. below land surface (9-5-2011) Record low: 30.77 ft. below land surface Period of Record : August, 1952 to Present
 Record low: ft. below land surface Period of Record : August, 1952 to Present.")
37
Questions?? Annual Data Reports http://wdr.water.usgs.gov/ Alabama WSC Web Address http://al.water.usgs.gov Richard Moreland USGS Alabama Water Science Center rsmore@usgs.gov

Similar presentations


: National Overview of Cleanup Strategies in the United States William J. Linn, PG Florida Department.>")


