Download presentation
Presentation is loading. Please wait.

1
Analysis of data from Real time experiments J.M.K. Mulema Department of Molecular and Cell Biology University of Cape Town

2
Quantifying RNA; Northern blotting, In situ hybridization, RNAse protection assays, Microarray, RT-PCR. Real time PCR –Data collected throughout the PCR process as it occurs. –Amplification and detection combined into a single step. –Reactions characterized by the point in time where the target amplification is first detected. –Cycle threshold (C t ), the time at which fluorescent intensity is greater than background fluorescence. –Greater starting target DNA, faster significant increase in fluorescent, lower C t –Requires much less RNA template Introduction
, the time at which fluorescent intensity is greater than background fluorescence. –Greater starting target DNA, faster significant increase in fluorescent, lower C t –Requires much less RNA template Introduction.")
3
One step Vs Two step One step cDNA synthesis to PCR amplification is performed in a single tube. Minimizes experimental variation because both enzymatic reactions occur in a single tube Uses RNA starting template. Prone to rapid degradation if not handled well. Not suitable in situations where the same sample is assayed on several occasions over a period of time. Less sensitive than two step protocols. Two step Reverse transcription and PCR occur in separate tubes Allows several different real time PCR assays on dilutions of a single cDNA. Reactions from subsequent assays have the same amount of template to those assayed earlier. Date from two step is quite reproducible. Allow for increased DNA contamination. Design the target PCR product to span introns

4
Genome sequenced A rapid life cycle Prolific seed production Cultivation in restricted space Easily transformed Botrytis cinerea (anamorph) Botryotinia fuckeliana (teleomorph) Ubiquitous Chemical control Host range Identify genes that play a role in resistance
 Botryotinia fuckeliana (teleomorph) Ubiquitous Chemical control Host range Identify genes that play a role in resistance")
5
Arabidopsis leaves infected with B. cinerea Extracted RNA from first three replicates (untreated, 12 hrs pi and 24 hrs pi) Made overnight cDNA synthesis Used Superscript III reverse transcriptase in a 20µl reaction. Diluted the synthesized cDNA 1 in 10 Designed primers to amplify products ranging from 70-150 bp Amplification optimized with a conventional PCR before real time. 1.At3g51660 (Macrophage migratory) 2.At4g30270 (MERI-5 protein) 3.At2g47190 (Myb family transcription) 4.At5g39610 (No Apical Meristem) 5.At5g06860 (PGIP1) 6.At4g24340 (Phosphorylase) 7.At5g07010 (Sulfotransferase) 8.At1g22400 (UDP-glucoronosyl) 9.At1g62300 (WRKY) 10.At3g04720 (Hevein-like protein) 11.At3g28930 (avrRpt2-induced protein) 12.At3g50480 (Broad spectrum) 13.At2g24180 (CYP 450) 14.At3g04220 (Disease resistance protein) 15.At1g52200 (Expressed protein) 16.At2g39030 (GCN5-related acetyltransferase) 17.At4g16260 (Glycosyl hydrolase) 18.At4g15610 (Integral membrane protein) 19.At4g33150 (lysine-ketoglutarate) 1.At4g10340 (Chlorophyll A-B) 2.At1g72610 (Germin-like protein) 3.At1g12900 (GAPHD) 4.At5g38430 (RUBSCO) 5.At1g20340 (Plastocyanin) 1.At5g25760 (Ubiquitin-conjugating enzyme) 2.At5g06600 (Ubiquitin-specific protease) 3.At1g04820 (Tubulin alpha 2-alpha 4) 4.At5g44200 (Nuclear cap-binding protein)
 Made overnight cDNA synthesis Used Superscript III reverse transcriptase in a 20µl reaction. Diluted the synthesized cDNA 1 in 10 Designed primers to amplify products ranging from bp Amplification optimized with a conventional PCR before real time. 1.At3g51660 (Macrophage migratory) 2.At4g30270 (MERI-5 protein) 3.At2g47190 (Myb family transcription) 4.At5g39610 (No Apical Meristem) 5.At5g06860 (PGIP1) 6.At4g24340 (Phosphorylase) 7.At5g07010 (Sulfotransferase) 8.At1g22400 (UDP-glucoronosyl) 9.At1g62300 (WRKY) 10.At3g04720 (Hevein-like protein) 11.At3g28930 (avrRpt2-induced protein) 12.At3g50480 (Broad spectrum) 13.At2g24180 (CYP 450) 14.At3g04220 (Disease resistance protein) 15.At1g52200 (Expressed protein) 16.At2g39030 (GCN5-related acetyltransferase) 17.At4g16260 (Glycosyl hydrolase) 18.At4g15610 (Integral membrane protein) 19.At4g33150 (lysine-ketoglutarate) 1.At4g10340 (Chlorophyll A-B) 2.At1g72610 (Germin-like protein) 3.At1g12900 (GAPHD) 4.At5g38430 (RUBSCO) 5.At1g20340 (Plastocyanin) 1.At5g25760 (Ubiquitin-conjugating enzyme) 2.At5g06600 (Ubiquitin-specific protease) 3.At1g04820 (Tubulin alpha 2-alpha 4) 4.At5g44200 (Nuclear cap-binding protein).")
6
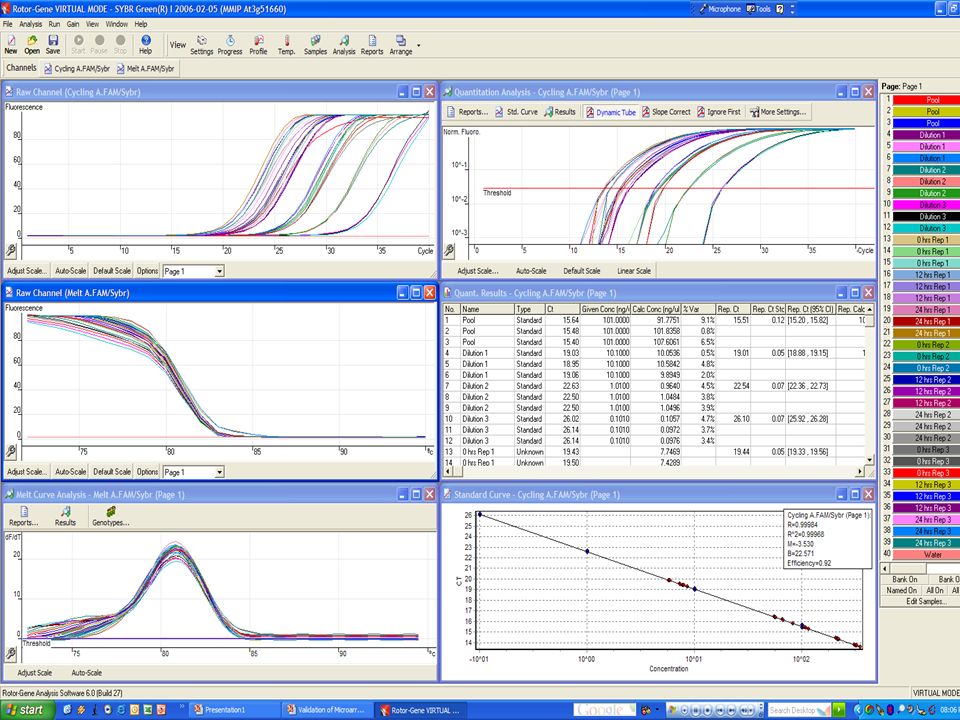
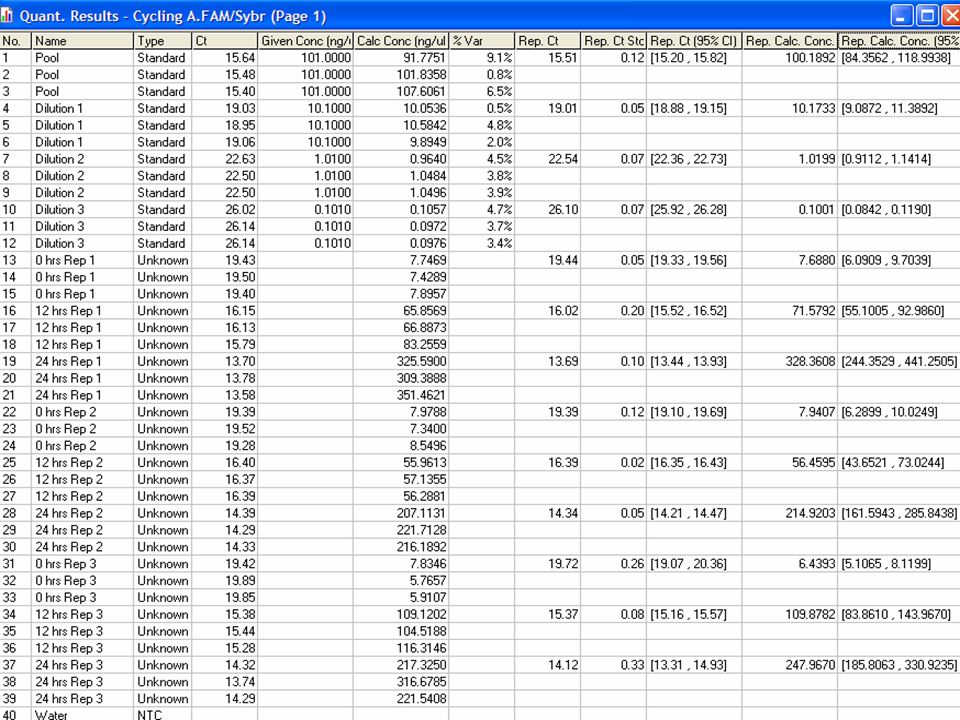
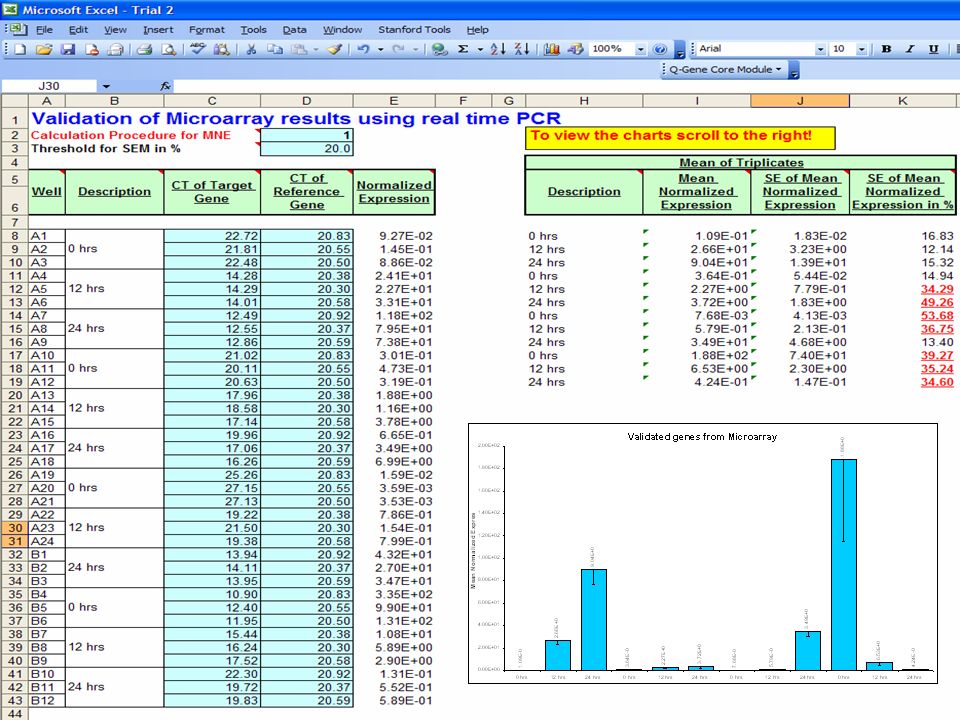
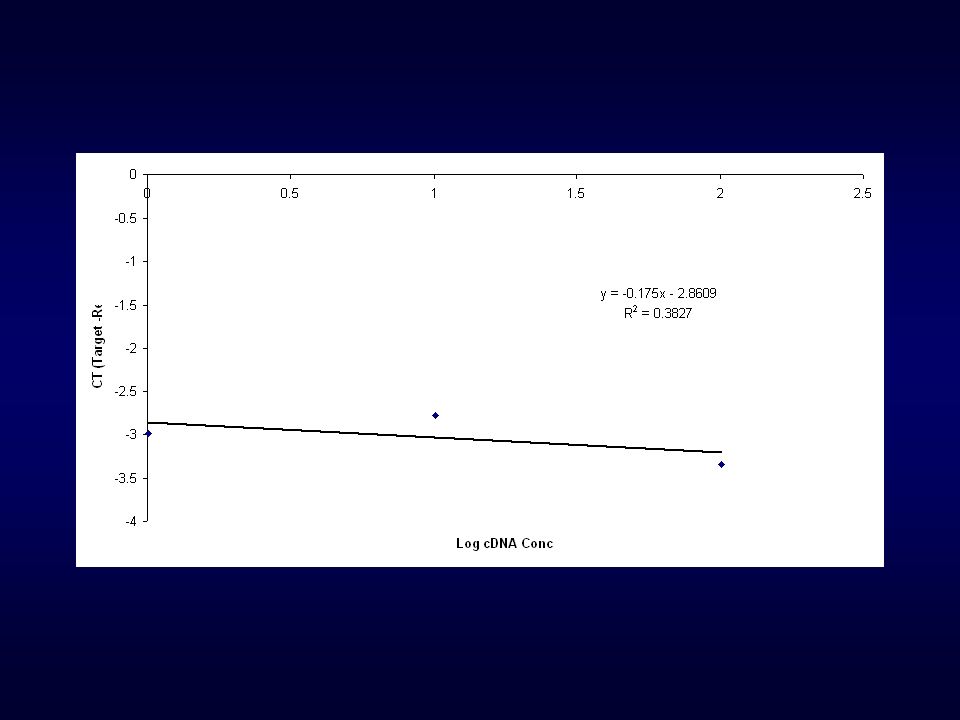
Absolute/Relative quantification Used serial diluted standards of known concentration to generate a standard curve. Standard curve is a linear relationship between the c t and the initial amount amounts of RNA or cDNA. This allows the determination of the concentration of unknowns based on their c t values Assumes that all standards and samples have equal amplification efficiencies. The concentrations of serial dilutions should encompass all samples and stay within the range that can be quantified Rep 1 0 hrs 12 hrs pi 24 hrs pi Rep 2 0 hrs 12 hrs pi 24 hrs pi Rep 3 0 hrs 12 hrs pi 24 hrs pi Pooled sample Dilution 1 (10 -1 ) Dilution 2 (10 -2 ) Dilution 3 (10 -3 ) Generating a standard curve Carry out runs in triplicates Source: Celtic Diagnostic
 Dilution 2 (10 -2 ) Dilution 3 (10 -3 ) Generating a standard curve Carry out runs in triplicates Source: Celtic Diagnostic.")
9
Gene0hrs R112hrs R124hrs R10hrs R212hrs R224hrs R20hrs R312hrs R324hrs R3 At3g2893011.75681.5393224.7475.113333.1119388.92178.627785.026106.6237 At3g5048064.3495158.3122179.238154.56870.2542186.290948.3419101.5222109.3803 At2g2418013.745855.4771309.414513.575533.9872292.906214.534977.8196141.6806 At3g0422029.351393.8687359.301512.865429.3513355.577812.2984168.3563156.9873 At1g5220018.0219111.6761158.496315.46356.2404242.549114.948210.0839168.0951 At2g390300.344359.346305.03080.330332.7631644.43880.233958.1566447.241 At4g162600.298213.2753365.52190.09093.1700330.41730.092212.0322363.5908 At3g047204.16122.9246372.90410.989410.1421316.15881.268922.79361.511 At4g156102.484842.4467395.19672.70327.3786302.08362.843257.5879260.4722 At4g331502.638548.3277269.87115.0124105.9577137.73784.088845.0527294.8066 At3g516607.68871.5792328.36087.940756.4595214.92036.4393109.8782247.967 At4g3027012.304599.6367197.852922.842565.073185.006416.0316175.1437319.8013 At2g471902.606543.7507325.68232.161343.8846315.75551.986152.0448333.4451 At5g396103.2338135.7344293.708710.2306123.9325909.36522.451212.3385463.2975 At5g0686010.424162.6886171.857131.371339.1112355.650327.1353112.4979310.3416 At4g2434021.491427.9686277.43959.14519.2327436.608113.6352.4527301.7165 At5g070100.278278.6687261.23670.510378.1067250.23660.326692.4533203.6362 At1g6230019.456758.0412334.38713.639742.2785530.47717.7916156.3018174.7055 At1g2240017.306640.4971454.785111.057912.2543632.012410.099115.3882250.8585 Upregulated genes

10
Gene0hrs R112hrs R124hrs R10hrs R212hrs R224hrs R20hrs R312hrs R324hrs R3 At1g20340309.612973.88739.5136237.823167.48559.9133307.866243.042430.1606 At1g72610399.334952.48580.3119255.934829.8570.8784360.05650.7713.6052 At1g12900484.789132.2451.8623236.42122.19023.5271256.494811.888510.5508 At5g38430419.797226.37330.4168.472316.15441.9259221.16127.41691.8047 At4g10340204.971973.58332.8063266.356584.44297.0391194.797180.953818.1863 Down regulated genes Gene0hrs R112hrs R124hrs R10hrs R212hrs R224hrs R20hrs R312hrs R324hrs R3 At5g44200121.2694103.310767.5263123.0522107.114665.1304121.7226112.7576102.7511 At5g25760127.6356183.0081118.7417160.7317195.4594184.7387166.7819156.2693154.9688 At1g04820157.1404180.763134.8381166.0978102.6774112.9576189.3141153.438834.0457 At5g0660064.3015104.257794.201169.82385.3205177.122253.189761.023374.8282 Reference genes (Relative Conc) Gene0hrs R112hrs R124hrs R10hrs R212hrs R224hrs R20hrs R312hrs R324hrs R3 At5g4420020.1620.421.0520.1420.3521.120.1620.2720.41 At5g2576020.8320.3820.9220.5520.320.3720.520.5820.59 At1g0482015.5715.3717.7215.4916.1816.0415.315.617.76 At5g0660018.1917.3817.5518.0517.7116.518.518.2717.93 Reference genes (Ct values)
 Gene0hrs R112hrs R124hrs R10hrs R212hrs R224hrs R20hrs R312hrs R324hrs R3 At5g At5g At1g At5g Reference genes (Ct values)")
11
Absolute quantification –Uses serially diluted standards of known concentration to generate a standard curve. –PCR standards Fragment of double stranded DNA Single stranded DNA Complementary RNA bearing the target sequence Relative quantification –Changes in gene expression are an external standard or calibrator Two standard curve method Comparative C t (Delta Delta C t ) method Pfaffl method – Relative expression software tool (REST) Types of real-time quantification
 method Pfaffl method – Relative expression software tool (REST) Types of real-time quantification.")
12
ReplicateGOIHKGGOI/HKGRelative values 0 hrs Rep 113.7458127.63560.1076956591.000 12 hrs Rep 155.4771183.00810.3031401342.815 24 hrs Rep 1309.4145118.74172.6057779224.196 0 hrs Rep 213.5755160.73170.0844606261.000 12 hrs Rep 233.9872195.45940.1738836812.059 24 hrs Rep 2292.9062184.73871.58551619118.772 0 hrs Rep 314.5349166.78190.0871491451.000 12 hrs Rep 377.8196156.26930.4979839295.714 24 hrs Rep 3141.6806154.96880.91425241710.491 Calculation of relative values (At2g24180)
")
14
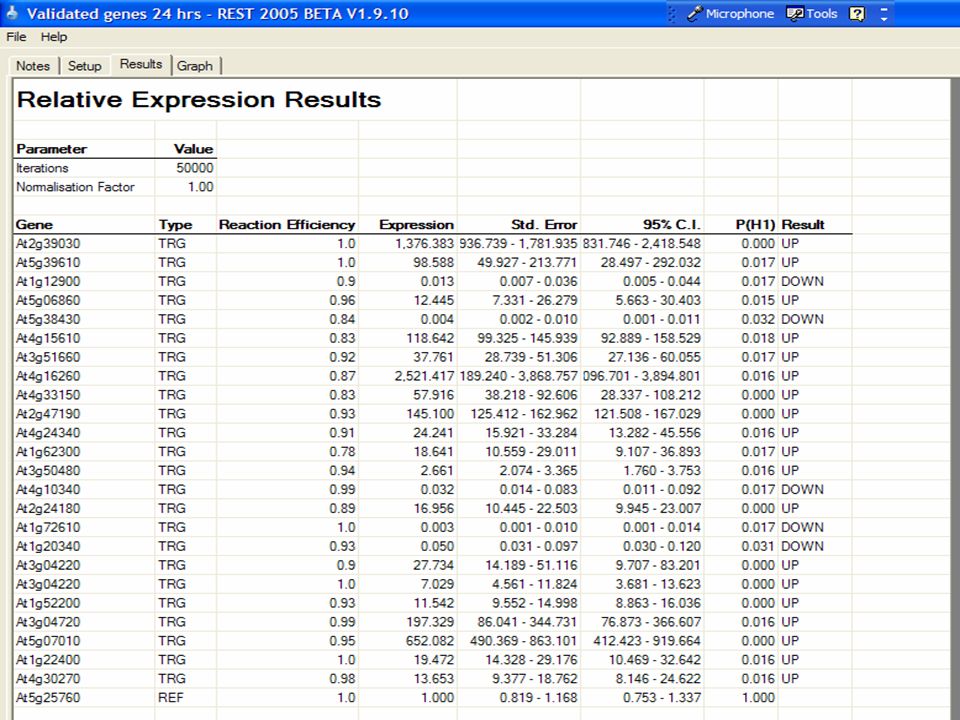
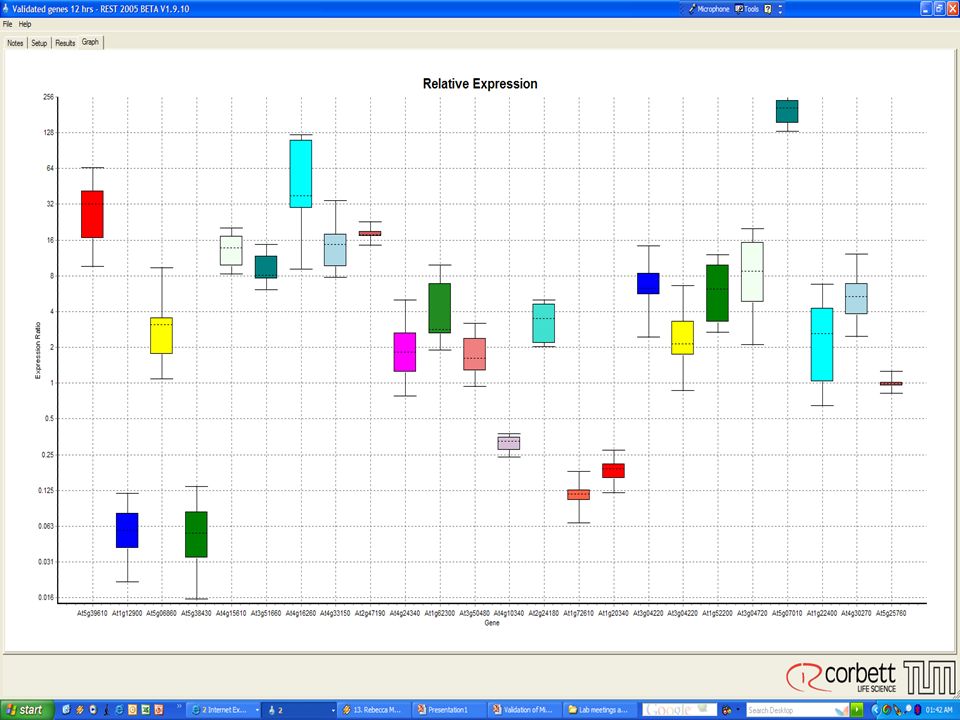
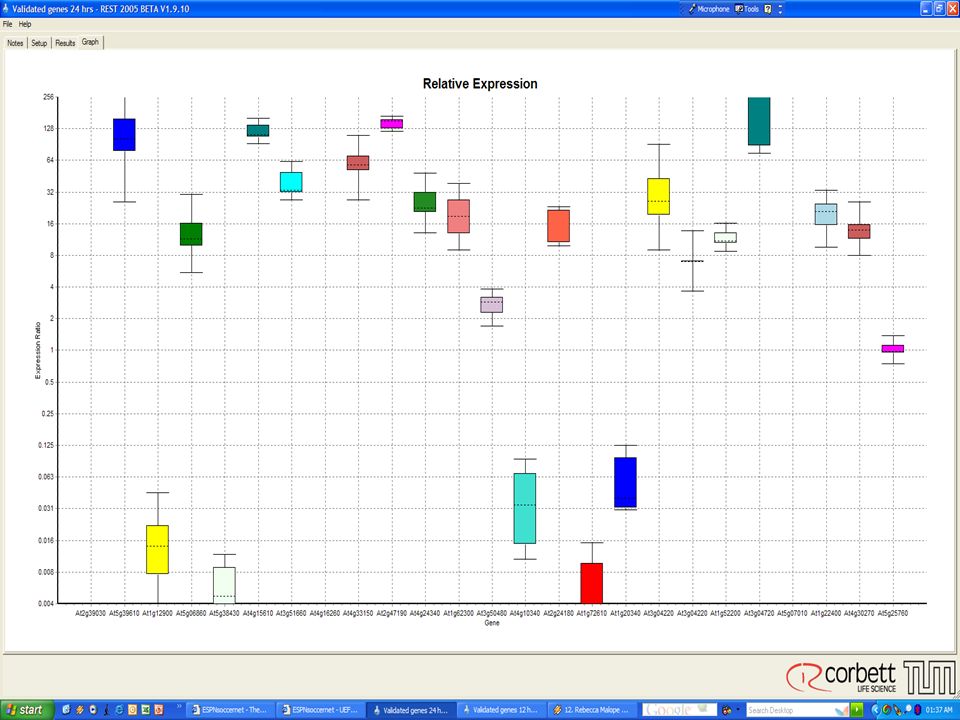
Relative expression software tool (REST) Purpose is to determine if there is a significant difference between samples and controls taking into account issues of reaction efficiency and reference gene normalization. Randomization are used in Rest. The alternate hypothesis P(H1) is based on the assumption that the difference between sample and control groups is due only to chance. REST performs 50,000 random reallocations of samples and controls between the groups and counts the number of times the relative expression of the randomly assigned group is greater than the sample data Concentration = efficiency avg(Controls) – avg(Samples) Expression = goiConcentration ÷ refConcentration Expression = GEOMEAN(goiConcentration ÷ refConc1, goiConcentration ÷ refConc2, …) Calculate a normalization factor equal to the geometric mean REST performs its calculations based on CP and efficiency values determined by standard curve or kinetic techniques.
 is based on the assumption that the difference between sample and control groups is due only to chance. REST performs 50,000 random reallocations of samples and controls between the groups and counts the number of times the relative expression of the randomly assigned group is greater than the sample data Concentration = efficiency avg(Controls) – avg(Samples) Expression = goiConcentration ÷ refConcentration Expression = GEOMEAN(goiConcentration ÷ refConc1, goiConcentration ÷ refConc2, …) Calculate a normalization factor equal to the geometric mean REST performs its calculations based on CP and efficiency values determined by standard curve or kinetic techniques..")
19
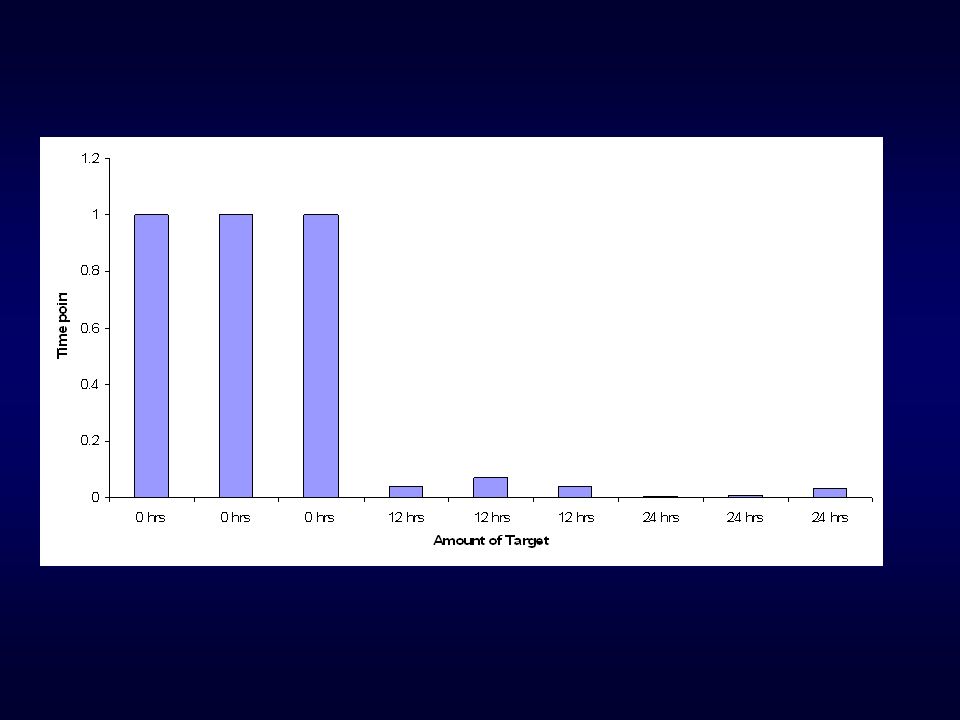
Delta Delta Ct method X n = X o x (1 + E x ) n X T = X o x (1 + E x ) CT,X =K X R T = R o x (1 + E R ) CT,R =K R Dividing X T by R T gives the expression X T = X o x (1 + E x ) CT,X =K X R T = R o x (1 + E R ) CT,R =K R Assuming equal amplification efficiencies E X =E R = E Xo Ro x (1 + E) CT,X-CT,R = X N x (1 + E) Δ CT = X Ncb x (1 + E) Δ CT,cb = X N,q x (1 + E) Δ CT,q = (1 + E) - ΔΔ CT Calibration Amount of the target normalized to an endogenous reference and relative to the calibrator is given by Amount of target = 2 -ΔΔCT Assumption: The amplification efficiency of the target and reference are approximately equal
 n X T = X o x (1 + E x ) CT,X =K X R T = R o x (1 + E R ) CT,R =K R Dividing X T by R T gives the expression X T = X o x (1 + E x ) CT,X =K X R T = R o x (1 + E R ) CT,R =K R Assuming equal amplification efficiencies E X =E R = E Xo Ro x (1 + E) CT,X-CT,R = X N x (1 + E) Δ CT = X Ncb x (1 + E) Δ CT,cb = X N,q x (1 + E) Δ CT,q = (1 + E) - ΔΔ CT Calibration Amount of the target normalized to an endogenous reference and relative to the calibrator is given by Amount of target = 2 -ΔΔCT Assumption: The amplification efficiency of the target and reference are approximately equal")
21
TimeGAPDHUBCΔCT-ΔΔCTAmount of target 0 hrs15.1620.83-5.671 0 hrs16.2820.55-4.271 0 hrs16.1520.5-4.351 12 hrs19.3820.384.670.04 12 hrs19.9620.3-0.343.930.07 12 hrs20.9320.580.354.70.04 24 hrs23.8220.922.98.570.003 24 hrs22.8220.372.456.720.009 24 hrs21.1220.590.534.880.033

23
Real Time PCR is a powerful technique that gives quantitative answers difficult to obtain with end point PCR, however, all steps need to be controlled from sampling to PCR including manipulations like extraction and reverse transcription Conclusion

Similar presentations


 of beta-globin an individual has?>")

 Isolate total RNA Isolate mRNA from total RNA (poly.>")

 MCB7300.>")

 Polymerase Chain Reaction (PCR) Microarray analysis Link to Gene Therapy.>")

 Analysis of DNA (Sequencing) Chemical Synthesis.>")


 Isolate total RNA Isolate mRNA from total RNA (poly.>")
 Analysis of DNA (Sequencing) Chemical Synthesis of DNA.>")


