Download presentation
Presentation is loading. Please wait.

1
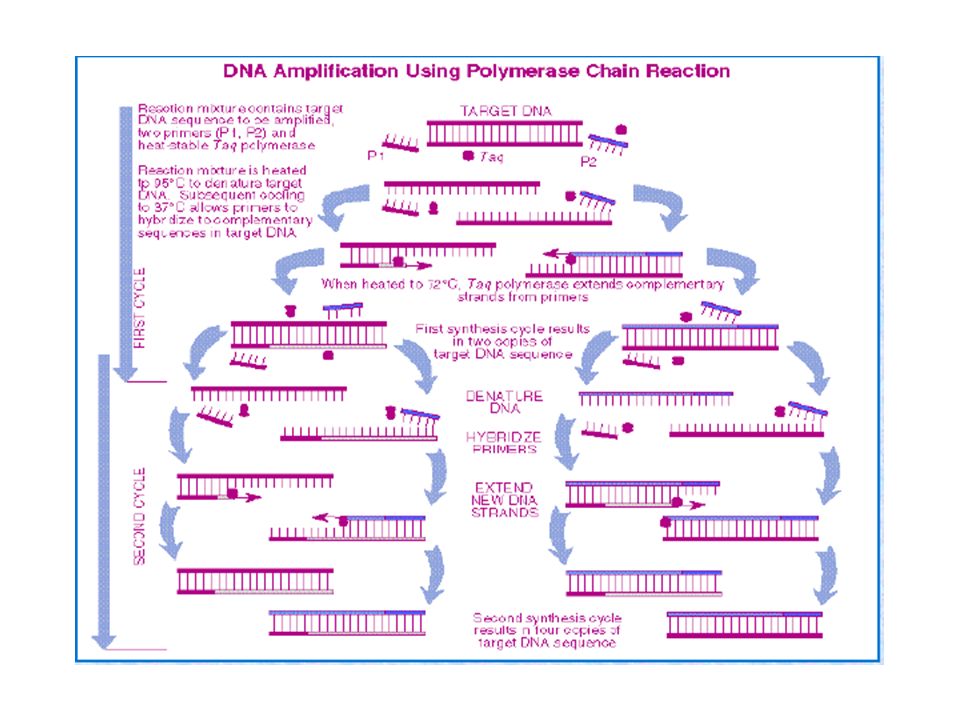
Real time RT-PCR Quantitating Gene Expression

4
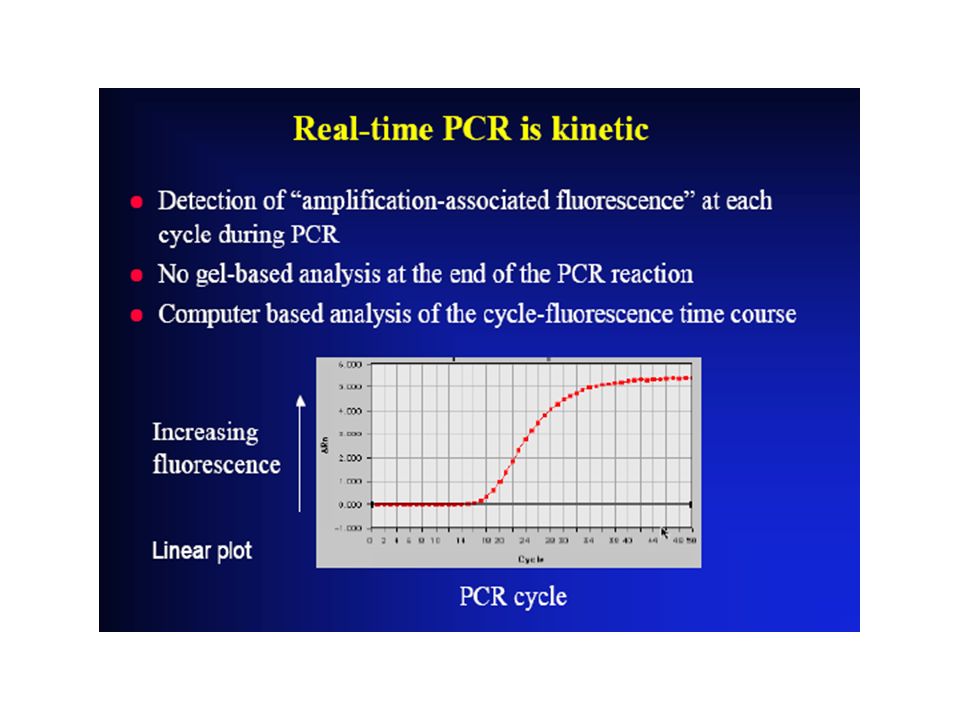
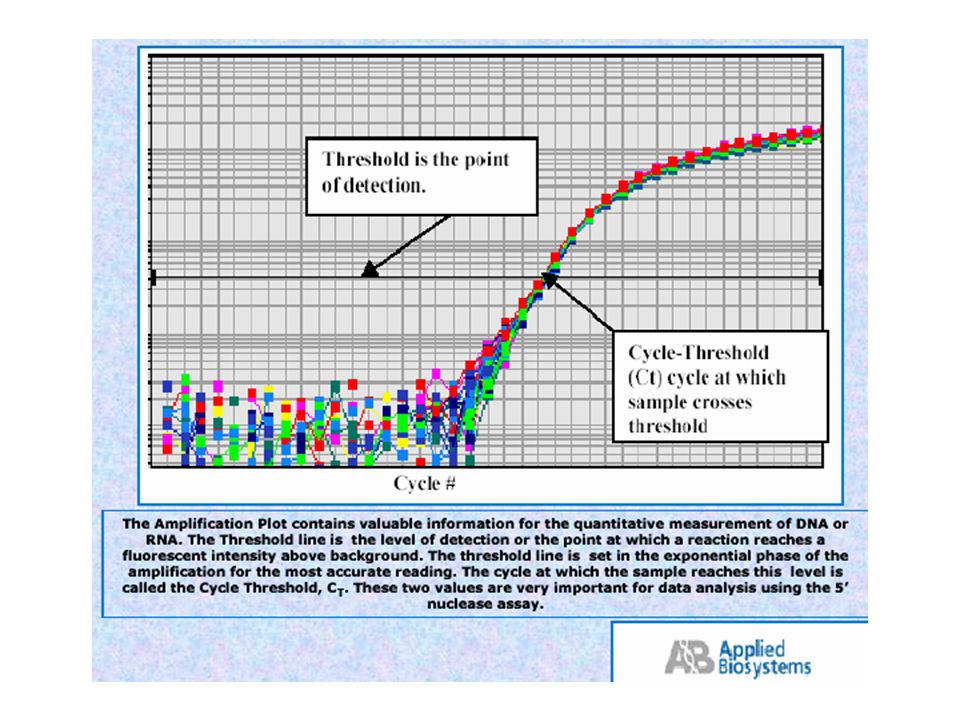
Real-time PCR monitors the fluorescence emitted during the reaction as an indicator of amplicon production at each PCR cycle (in real time) as opposed to the endpoint detection
 as opposed to the endpoint detection")
7
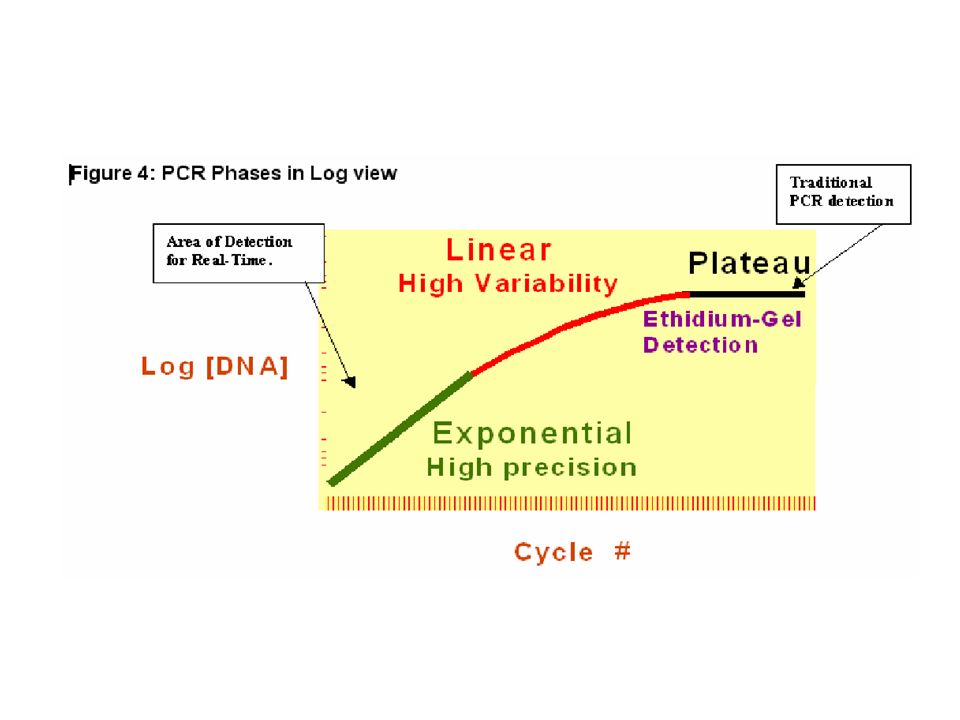
Based on the detection and quantitation of a fluorescent reporter * The first significant increase in the amount of PCR product (CT - threshold cycle) correlates to the initial amount of target template Real-time Principles
 correlates to the initial amount of target template Real-time Principles")
10
Amplification Plots Gestl 082709b.mxp

12
Amplification Plots Gestl 082709b.mxp

13
Real-Time Principles Three general methods for the quantitative assays: 1. Hydrolysis probes (TaqMan, Beacons, Scorpions) 2. Hybridization probes (Light Cycler) 3. DNA-binding agents (SYBR Green)
 2. Hybridization probes (Light Cycler) 3. DNA-binding agents (SYBR Green).")
15
Multiplexing: TaqMan: Yes, different dyes for each target (FAM, TET, VIC and JOE) SYBR Green: No Cost: TaqMan: More expensive when doing multiple genes SYBR green: Less expensive Specificity: TaqMan: More specific SYBR green: Less specific Advantages/Disadvantages
 SYBR Green: No Cost: TaqMan: More expensive when doing multiple genes SYBR green: Less expensive Specificity: TaqMan: More specific SYBR green: Less specific Advantages/Disadvantages")
16
Threshold Cycle Threshold cycle or the CT value is the cycle at which a significant increase in ∆Rn is first detected Parameter used for quantitation CT value of 40 or more means no amplification and cannot be included in the calculations

18
Amplification Plots Gestl 082709b.mxp

19
Amplification Plots Gestl 082709b.mxp

20
Standard Curve Gestl 082709b.mxp

21
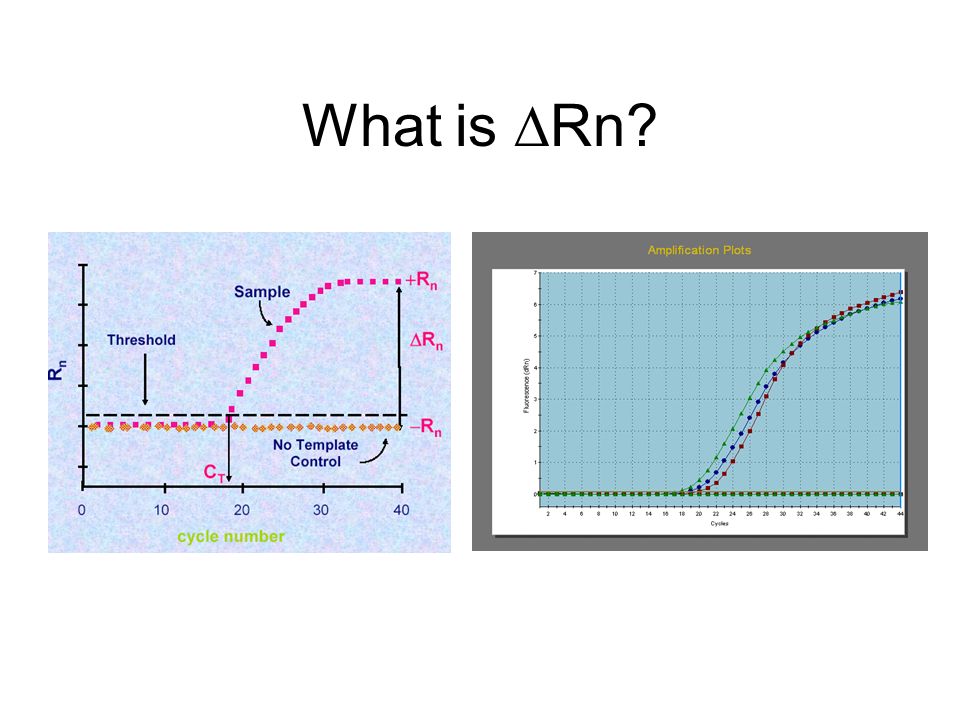
* Rn+ is the Rn value of a reaction containing all components (the sample of interest); Rn- is the Rn value detected in NTC (baseline value) * ∆Rn is the difference between Rn+ and Rn-. It is an indicator of the magnitude of the signal generated by the PCR * ∆Rn is plotted against cycle numbers to produce the amplification curves and gives the CT value What is ∆Rn?

23
Control Amplification Plots Gestl 061009.mxp Pol delta 2 No RT No TC No PC

24
Amplification Plots of Pol beta No RT Controls Gestl 061009.mxp

25
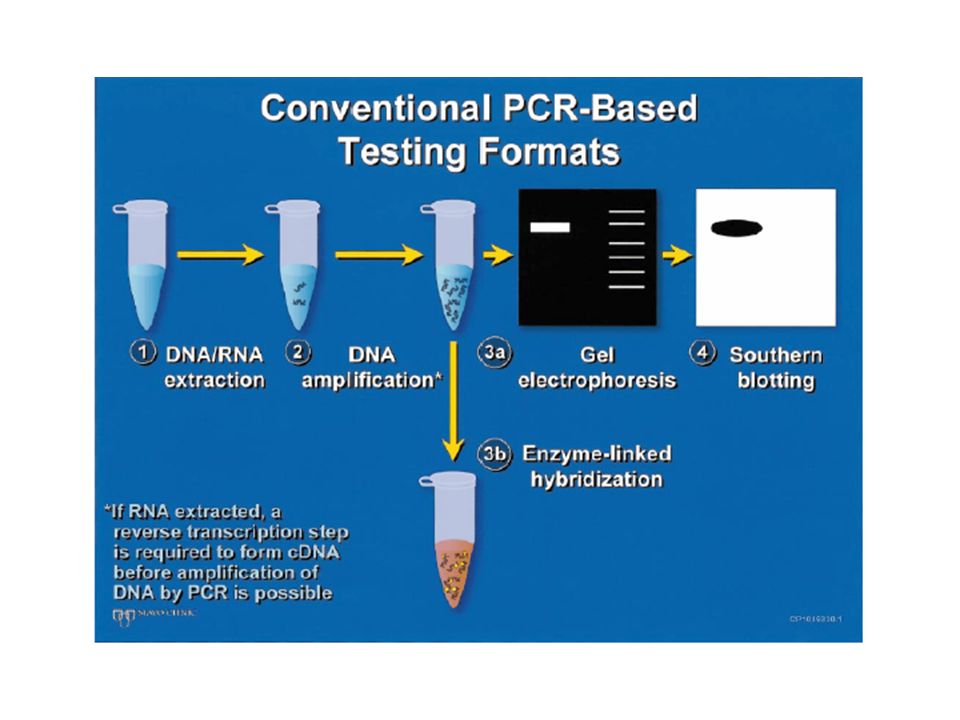
One-Step vs. Two Step Reactions One-step real-time RT-PCR performs reverse transcription and PCR in a single buffer system and in one tube Two-step RT-PCR, performs the reactions separately in different tubes

26
Endogenous/Internal Control (Normalization) Usually an abundantly and constantly expressed housekeeping gene Most commonly used ones are the least reliable ones Best to run a validity test for the selected endogenous control * Combination may/should be used
 Usually an abundantly and constantly expressed housekeeping gene Most commonly used ones are the least reliable ones Best to run a validity test for the selected endogenous control * Combination may/should be used")
27
Absolute Quantification -Determine the actual number of molecules in the reaction -Comparison to a Standard -Each Standard is unique

28
Dissociation Curve of Pol delta 2 Gestl 061009.mxp

29
Primer Concentration of 6-day Samples Gestl 061009.mxp Pol delta 2 300 – 300 nM

30
Problems & Solutions Problems: -Multiple peaks in Dissociation Curves -Product in No Template control -Product in No RT Control Solution: -Design new primers

31
Standard Curve Gestl 082709b.mxp

32
Amplification Plots Gestl 082709b.mxp

Similar presentations


>")


 MCB7300.>")


