Download presentation
Presentation is loading. Please wait.

1
Human-Computer Interaction Lecture 2: Visual representation

2
TYPOGRAPHY AND TEXT

8
MAPS AND GRAPHS

18
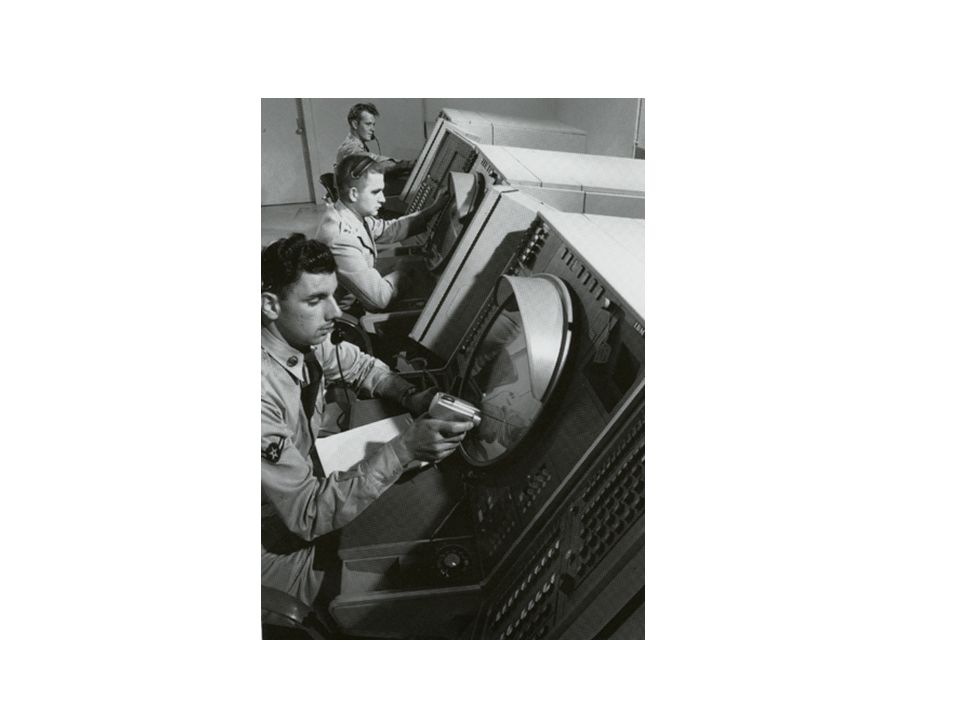
SCHEMATIC DRAWINGS

27
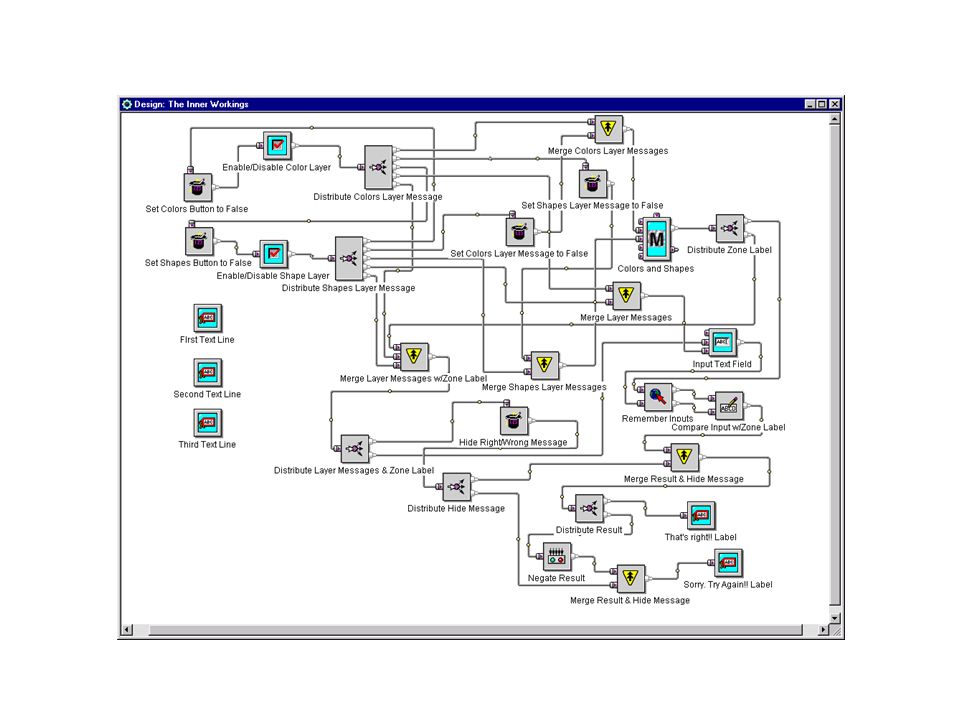
NODE-AND-LINK DIAGRAMS

32
http://xkcd.com/730/ xkcd: circuit diagram

35
ICONS AND SYMBOLS

41
VISUAL METAPHOR

51
PICTURES

70
UNIFIED THEORIES OF VISUAL REPRESENTATION

71
Graphic ResourcesCorrespondenceDesign Uses Marks Shape Orientation Size Texture Saturation Colour Line Literal (visual imitation of physical features) Mapping (quantity, relative scale) Conventional (arbitrary) Mark position, identify category (shape, texture colour) Indicate direction (orientation, line) Express magnitude (saturation, size, length) Simple symbols and colour codes Symbols Geometric elements Letter forms Logos and icons Picture elements Connective elements Topological (linking) Depictive (pictorial conventions) Figurative (metonym, visual puns) Connotative (professional and cultural association) Acquired (specialist literacies) Texts and symbolic calculi Diagram elements Branding Visual rhetoric Definition of regions Regions Alignment grids Borders and frames Area fills White space Gestalt integration Containment Separation Framing (composition, photography) Layering Identifying shared membership Segregating or nesting multiple surface conventions in panels Accommodating labels, captions or legends SurfacesThe plane Material object on which the marks are imposed (paper, stone) Mounting, orientation and display context Display medium Literal (map) Euclidean (scale and angle) Metrical (quantitative axes) Juxtaposed or ordered (regions, catalogues) Image-schematic Embodied/situated Typographic layouts Graphs and charts Relational diagrams Visual interfaces Secondary notations Signs and displays
 Mapping (quantity, relative scale) Conventional (arbitrary) Mark position, identify category (shape, texture colour) Indicate direction (orientation, line) Express magnitude (saturation, size, length) Simple symbols and colour codes Symbols Geometric elements Letter forms Logos and icons Picture elements Connective elements Topological (linking) Depictive (pictorial conventions) Figurative (metonym, visual puns) Connotative (professional and cultural association) Acquired (specialist literacies) Texts and symbolic calculi Diagram elements Branding Visual rhetoric Definition of regions Regions Alignment grids Borders and frames Area fills White space Gestalt integration Containment Separation Framing (composition, photography) Layering Identifying shared membership Segregating or nesting multiple surface conventions in panels Accommodating labels, captions or legends SurfacesThe plane Material object on which the marks are imposed (paper, stone) Mounting, orientation and display context Display medium Literal (map) Euclidean (scale and angle) Metrical (quantitative axes) Juxtaposed or ordered (regions, catalogues) Image-schematic Embodied/situated Typographic layouts Graphs and charts Relational diagrams Visual interfaces Secondary notations Signs and displays")
72
ANALYSIS EXAMPLES

75
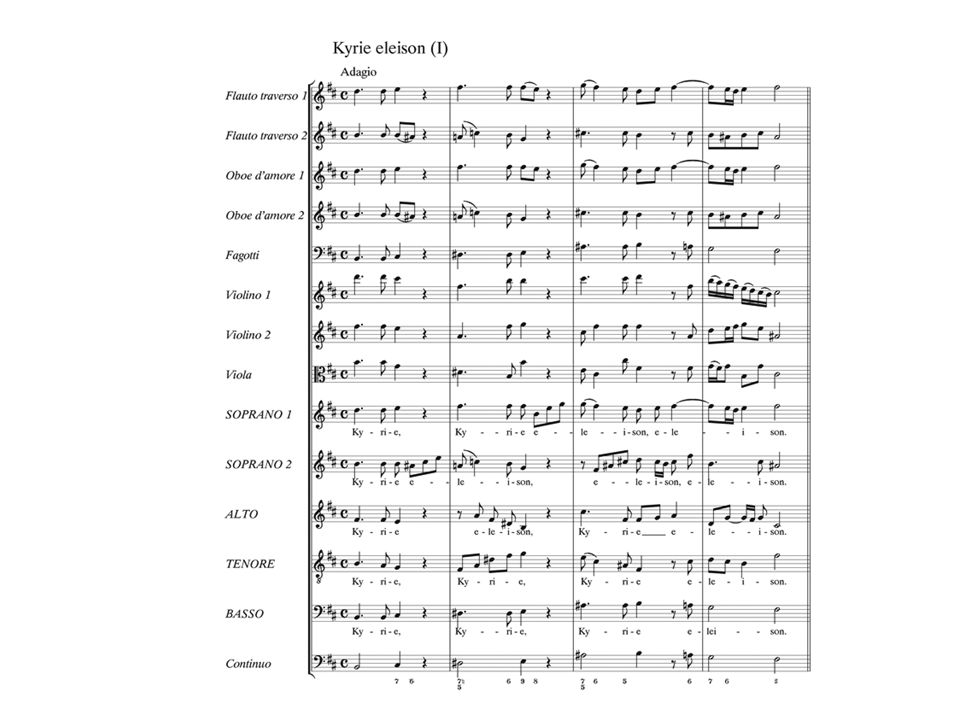
Graphic ResourcesCorrespondenceDesign Uses MarksShapeConventional (arbitrary) Mark position identify category (shape) Symbols Geometric elements Letter forms Connective elements Topological (linking) Acquired (specialist literacies) Texts Definition of regions Regions Alignment grids White space Containment Separation Segregating and nesting multiple surface conventions in panels Accommodating labels SurfacesMaterial object on which the marks are imposed (paper) Metrical (quantitative axes) Juxtaposed and ordered (regions) Musical score
 Mark position identify category (shape) Symbols Geometric elements Letter forms Connective elements Topological (linking) Acquired (specialist literacies) Texts Definition of regions Regions Alignment grids White space Containment Separation Segregating and nesting multiple surface conventions in panels Accommodating labels SurfacesMaterial object on which the marks are imposed (paper) Metrical (quantitative axes) Juxtaposed and ordered (regions) Musical score")
92
Graphic ResourcesCorrespondenceDesign Uses Marks Size Colour Mapping (quantity, relative scale) Mark position identify category (colour) Express magnitude (size) Symbols Geometric elements Connective elements Topological (linking) Diagram elements Visual rhetoric RegionsAlignment grids Containment Separation Framing (composition) Segregating or nesting multiple surface conventions in panels Accommodating labels, captions or legends SurfacesDisplay medium (web browser)Metrical (quantitative axes) Image-schematic? Graphs and charts

93
WORKED EXAMPLE

94
Visit Guardian data blog Browse “Data A-Z” Propose new visualisation

Similar presentations


 DEADLINE ONE: 14th Nov- 2013 CW1 (Structure and Skeleton) DEADLINE TWO: 28-Nov-2013.>")


