Download presentation
Presentation is loading. Please wait.

2
SOLID

3
Crystalline solids (1) Atoms and molecules are arranged in a regular 3 dimensional array Solids have very definite geometric shape Basic unit: unit cell e.g. metals, diamond, salt, sugar

4
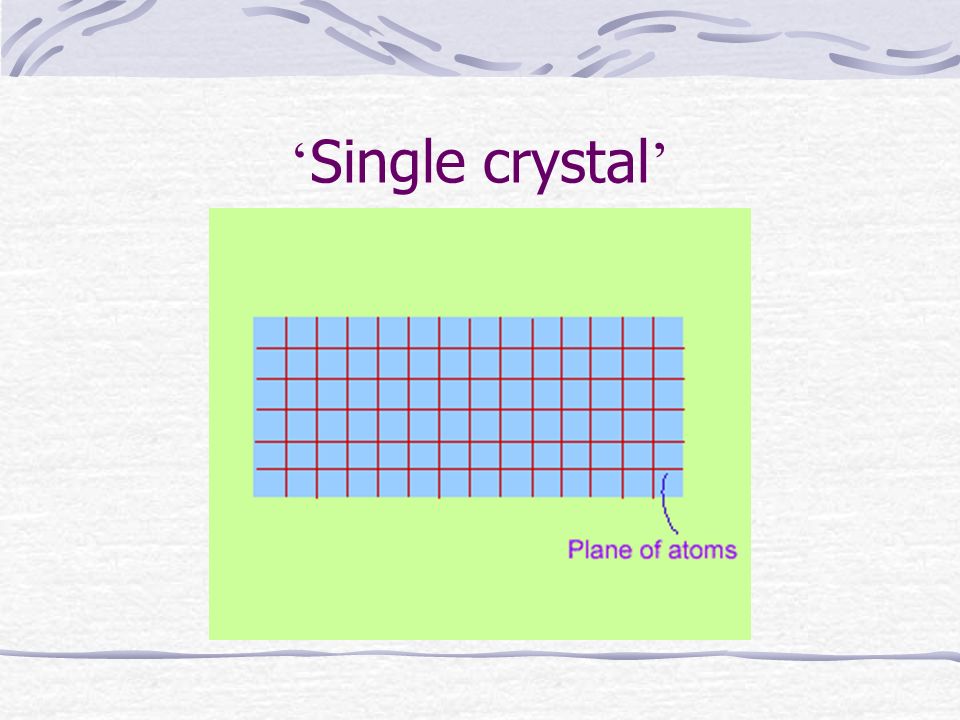
Remarks: Crystalline structure is energetically stable Crystals have definite melting point Equivalent planes of atoms are all parallel in a ‘ single crystal ’ Polycrystalline samples consist of tiny crystals (grains) packed together and orientated randomly Crystalline solids (2)
 packed together and orientated randomly Crystalline solids (2)")
5
Amorphous solids The particles are assembled in a more disordered way e.g. plastics, glass, wax, chalk Remarks: No definite melting point Becomes softer and more mobile when heated Regarded as liquids with very high viscosity

6
Mechanical properties of solids (1) Strength The force a material can withstand before breaking If a material can withstand a large force, it is said to be very strong, otherwise, it is said to be weak
 Strength The force a material can withstand before breaking If a material can withstand a large force, it is said to be very strong, otherwise, it is said to be weak")
7
Stiffness The opposition set up to being distorted by having its shape or size changed A stiff material is very rigid, i.e. it only extends slightly when stretched A material which is not stiff is said to be soft Strength and stiffness are independent properties Mechanical properties of solids (2)
.")
8
Ductility the ability of a material to be hammered, pressed, bent or stretched into useful shapes A ductile substance is one that can be permanently strained e.g. metals A material is said to be brittle if it breaks immediately after exceeding the elastic limit e.g. glass, concrete figure Mechanical properties of solids (3)
.")
9
Toughness it relates to how readily a material will crack Mechanical properties of solids (4)
")
10
Stress-strain behaviour (1) Searle apparatus Searle apparatus can be used to investigate the extension of a wire when it is subjected to tension Stress it is the force acting on unit cross-section area Mathematical form: Unit: Nm -2 or Pa Further reading
 Searle apparatus Searle apparatus can be used to investigate the extension of a wire when it is subjected to tension Stress it is the force acting on unit cross-section area Mathematical form: Unit: Nm -2 or Pa Further reading")
11
Strain it is the extension of unit length Mathematical form: It has no unit Stress-strain behaviour (2) Further reading
 Further reading")
12
Elastic material it returns to its original size and shape when the deforming force is removed if a material has no tendency to return to its original size or shape on removal of the deforming force, it is said to be plastic when the applied load is not too large, a graph of stress versus strain gives a straight line passing through the origin graph Stress-strain behaviour (3)
")
13
Stress-strain behaviour (4) Mathematical form: E is called the Young modulus of the material Unit: Nm -2 or Pa
 Mathematical form: E is called the Young modulus of the material Unit: Nm -2 or Pa")
14
Notes: The value of Young modulus depends on the nature of the material and not on the dimensions of the sample large E a large stress is required to produce a small strain The proportionality between stress and strain is called Hooke ’ s law Stress-strain behaviour (5)
")
15
Young modulus of some materials: Stress-strain behaviour (6) MaterialE/10 10 Pa Aluminium6.9 Copper12.4 Glass7 Iron19.7 Steel20.6 Lead1.79 Tin4.69 Polytheneabout 0.5 Rubberabout 0.005
 MaterialE/10 10 Pa Aluminium6.9 Copper12.4 Glass7 Iron19.7 Steel20.6 Lead1.79 Tin4.69 Polytheneabout 0.5 Rubberabout 0.005")
16
Behaviour of larger stress Force-deformation curve Stress-strain curve Region OP: Hooke ’ s law is obeyed and P is the proportional limit Region PL: Hooke ’ s law is not obeyed but the deformation is still elastic and L is the elastic limit Note: in some materials, points P and L overlap with each other Stress-strain behaviour (7)
")
17
Beyond L, plastic deformation occurs and permanent deformation results At Y, a sudden remarkable increase in extension occurs and Y is the yield point. The material is undergoing plastic deformation Stress at M is the maximum stress the material can withstand without breaking and is called the breaking stress or the strength of the material The material eventually breaks at B Stress-strain behaviour (8) figure
 figure.")
18
Determination of Young modulus (1) Experimental setup Procedure Test wire should be thin and long main scale is carried by the reference wire and the vernier is carried by the test wire The two wires, P and Q, should be made of the same material and suspended from the same support
 Experimental setup Procedure Test wire should be thin and long main scale is carried by the reference wire and the vernier is carried by the test wire The two wires, P and Q, should be made of the same material and suspended from the same support")
19
Both wires should be free of ‘ kinks ’ The diameter of the test wire must be found by a micrometer screw gauge at several places The readings on the vernier are also taken when the load is gradually removed in steps A graph of extension against load is plotted and the gradient is measuredgraph Determination of Young modulus (2)
")
20
Equation: Determination of Young modulus (3)
")
21
Various stress-strain graphs Comparison of stress-strain graphs of a) Strong and weak materials Strong and weak materials b) Stiff and soft materials Stiff and soft materials c) Ductile and brittle materials Ductile and brittle materials
 Strong and weak materials Strong and weak materials b) Stiff and soft materials Stiff and soft materials c) Ductile and brittle materials Ductile and brittle materials")
22
Energy of deformation (1) Work in stretching and compressing an object is stored as strain energy Within elastic limit, strain energy can be recovered completely when the stress is removed Strain energy Strain energy =
 Work in stretching and compressing an object is stored as strain energy Within elastic limit, strain energy can be recovered completely when the stress is removed Strain energy Strain energy =")
23
Strain energy per unit volume Energy of deformation (2)
")
24
Intermolecular force and potential energy (1) The molecules exert net repulsive force at very small separations otherwise all matters would collapse The intermolecular forces must be negligible to account for the free movement of molecules in gaseous state
 The molecules exert net repulsive force at very small separations otherwise all matters would collapse The intermolecular forces must be negligible to account for the free movement of molecules in gaseous state")
25
Kinetic theory: molecules are in continual motion at all temperatures above absolute zero, therefore they possess k.e. Molecules exert forces on each other, therefore they possess p.e. The relative magnitude of the kinetic and potential energies determines whether a substance exists in the solid, the liquid or the gaseous state Intermolecular force and potential energy (2)
.")
26
Forces between molecules Electromagnetic in origin When two molecules approach each other, the charges on each are distorted slightly resulting in attractive intermolecular force When the molecules become so close that the electron clouds begin to overlap, the intermolecular force becomes repulsive Intermolecular force and potential energy (3)
")
27
Model for a solid Atoms are more or less locked in position Potential energy- separation curve P.E. increases when the solid is compressed (r decreases) or stretched (r increases) P.E. = 0 when the atoms are infinitely apart
 or stretched (r increases) P.E. = 0 when the atoms are infinitely apart.")
28
Interatomic force-separation curve (1) Interatomic force is given by Force-separation curve
 Interatomic force is given by Force-separation curve")
29
Remarks Molecules in a solid seem to be in equilibrium on the average It is hard to push molecules in a solid closer together. Therefore as they come closer together the repelling forces must increase. It is also hard to pull the molecules of a solid further apart. So as they move further apart the attracting forces must also increase Interatomic force-separation curve (2)
.")
30
A metal rod can be broken by pulling on its ends. However, it cannot be broken by pushing its ends inwards. The repelling forces must, therefore, continue to increase as the molecules come closer together, but the attracting forces must reach a limit Interatomic force-separation curve (3)
.")
31
Characteristics about the F(r) curve (1) Sign convention: F is positive for repulsion At r = r o, F = 0. Molecules are at equilibrium separation Steeper slope for r r o more difficult to compress When r < r o, the graph continues to rise steeply without limit a solid cannot be broken by compression

32
When r > r o, the curve shows a maximum value for the attractive force. Hence a solid can be broken by stretching When r is larger than several molecular diameters, F(r) becomes virtually zero Characteristics about the F(r) curve (2)
 becomes virtually zero Characteristics about the F(r) curve (2).")
33
Intermolecular force is a short-range force, F(r) is related to high powers of r F(r) = a/r m - b/r n The first term represents the repulsive component where the second term represents the attractive component Characteristics about the F(r) curve (3)
 is related to high powers of r F(r) = a/r m - b/r n The first term represents the repulsive component where the second term represents the attractive component Characteristics about the F(r) curve (3)")
34
Characteristics of U(r) curve (1) Due to the existence of intermolecular force, a molecule would possess different potential energies at different distances from its neighbour. The molecular potential U(r) is also a function of rU(r) Negative slope represents repulsive intermolecular force
 is also a function of rU(r) Negative slope represents repulsive intermolecular force.")
35
At r o, U is a minimum most stable position -E o = bonding or binding energy which is the minimum energy required to separate the molecules to infinity Point of inflexion: the separation having the maximum attractive force r 1 represents the maximum molecular separation before the solid breaks F 1 represents the breaking force Characteristics of U(r) curve (2) figure
 curve (2) figure")
36
Interatomic bonds (1) Ionic (electrostatic) bond Formed between atoms of elements at opposite sides of the periodic table, e.g. sodium & chlorine A sodium atom has a loosely held outer electron which is readily accepted by a chlorine atom and two oppositely charged ions are formed The two ions are then bonded by the electrostatic attraction between their unlike charges The ions tend to pack closely togetherpack closely

37
Covalent bond Bonding electron sharing occurs between two or more atoms Highly directional e.g. carbon atoms in diamond Interatomic bonds (2)
.")
38
Metallic bond Metal atoms have one or two loosely held outer electrons that are readily lost These free electrons are shared by all atoms The strong attraction between the ions and electrons constitutes the metallic bond Close packing arrangement Interatomic bonds (3)
")
39
Van der Waals bond Weak Exists in all atoms and molecules Arises due to the formation of a weak electric `dipole ’ giving rise to an attractive force between opposite ends of such dipoles in neighbouring atomsdipole Interatomic bonds (4)
")
40
Microscopic interpretations of macroscopic phenomena (1) Elasticity & Hooke ’ s law Atoms have minimum P.E. at the equilibrium position (P.E.-separation curve)(P.E.-separation curve When slightly displaced, atoms tend to move back to the equilibrium position at which the atoms attains the most stable state This explains the elastic property of matter
(P.E.-separation curve When slightly displaced, atoms tend to move back to the equilibrium position at which the atoms attains the most stable state This explains the elastic property of matter.")
41
For sufficiently small displacements from the equilibrium point r o, the F-r graph is linearF-r graph Therefore the force required is directly proportional to the desired extension or compression (Hooke ’ s law) Microscopic interpretations of macroscopic phenomena (2)
 Microscopic interpretations of macroscopic phenomena (2)")
42
Young modulus Imagine the atoms to be joined by springs each with a certain force constant katoms If a solid consists of N atoms on each side, with separation r o between atoms Microscopic interpretations of macroscopic phenomena (3)
")
43
Thermal expansion The PE curve is steeper for compression and flatter for stretchingPE curve At absolute zero, the atom is essentially stationary at r o When temperature increases, the mean separation between atoms will increase resulting in expansion Microscopic interpretations of macroscopic phenomena (4)
")
44
Definite shapes for solids At low temperatures the kinetic energy of the molecules is low compared with their potential energy The molecules of solids can merely vibrate about fixed positions and are therefore locked into a geometrically ordered array Therefore, a solid has both a fixed volume and a fixed shape Microscopic interpretations of macroscopic phenomena (5)
")
45
The latent heat of sublimation of a solid Consider a solid in which each atom has n nearest neighbours One mole of solid contains N A atoms (where N A is the Avogadro constant) and each atom is involved in n bonds The total energy required to separate the atoms in one mole of solid is Microscopic interpretations of macroscopic phenomena (6)
 and each atom is involved in n bonds The total energy required to separate the atoms in one mole of solid is Microscopic interpretations of macroscopic phenomena (6)")
46
The latent heat of sublimation of one mole of solid at 0 K is Microscopic interpretations of macroscopic phenomena (7)
")
47
Effect of temperature and time on mechanical properties (1) The effect of temperature With increasing temperature, a solid softens and its strength and stiffness decreases By suitable heating and cooling, a ductile piece of steel can be changed into a brittle piece. Re-heating and slow cooling can reverse the effect

48
The effect of time (Fatigue and creep) If a material is repeatedly stressed and unstressed, it becomes weaker and the material may fracture even though the maximum stress applied in any of the cycles does not exceed the breaking stress The failure of a material in this way is called fatigue Effect of temperature and time on mechanical properties (2)
 If a material is repeatedly stressed and unstressed, it becomes weaker and the material may fracture even though the maximum stress applied in any of the cycles does not exceed the breaking stress The failure of a material in this way is called fatigue Effect of temperature and time on mechanical properties (2)")
49
Creep is the gradual increase in strain when a material is subjected to stress for a long time (creep curve)creep curve It occurs even when the stress is constant It is most marked at elevated temperatures The turbine blades in jet engines are particularly susceptible to creep Soft metals, e.g. lead, and most plastics, show considerable creep even at room temperature Effect of temperature and time on mechanical properties (3)
.")
50
Theory of plastic deformation (1) Ductility of metals: due to slipping of the crystal planes In an ideal crystal all atoms are arranged in a perfectly regular lattice. To make one layer of atoms to slip over the other would require a very large stress because this would involve the breakage of a large number of bonds simultaneously

51
In a real metal, the force required to cause plastic deformation is much less than the expected value This is due to imperfections formed during manufacture such as missing atoms, extra or foreign atoms Those misplaced atoms are called dislocations Theory of plastic deformation (2)
")
52
When plastic deformation occurs, the crystal planes slip by the movement of dislocationsmovement of dislocations The movement of dislocation requires a much smaller force because only one bond is broken at a time Theory of plastic deformation (3)
")
53
Elastic hysteresis of rubber Stress-stain curve Stress-stain curve of a rubber The curve during unloading does not coincide with the curve during loading The extension during unloading is always greater than that during loading with a given stretching force The effect is known as hysteresis The sample returns to its original length when the load is completely removed

54
Properties of rubber (1) When rubber is stretched it becomes warmer. When the stress is released its temperature falls but it remains a little warmer than it previously was The net increase in the heat content per unit volume of the sample during the stretching-relaxation cycle is equal to the area of the hysteresis loophysteresis loop

55
Low stiffness It consists of long chain-like molecules with a repetitive unit of (C 5 H 8 ) n The elasticity of rubber is caused by the coiling of the molecules It does not obey Hooke ’ s law Properties of rubber (2)
 n The elasticity of rubber is caused by the coiling of the molecules It does not obey Hooke ’ s law Properties of rubber (2)")
56
From the figure, the sample stretches easily at first, but has become very stiff (steep slope) by the time the extension corresponding to the point A has been reachedfigure At A the extension is such that the long- chain molecules of the rubber have become fully straightened out Properties of rubber (3)
 by the time the extension corresponding to the point A has been reachedfigure At A the extension is such that the long- chain molecules of the rubber have become fully straightened out Properties of rubber (3)")
57
Heating a stretched rubber band causes it to contract: The higher temperature produces increased lateral bombardment of the long chain molecules causing them to kink and so shorten The stress/strain ratio increases with increasing temperature Properties of rubber (4)
")
58
Shear modulus Shear stressShear stress: the stress which changes the shape of a body Shear strainShear strain: the distortion resulted from shear stress Shear modulus (modulus of rigidity): Unit: Nm -2 or Pascal
: Unit: Nm -2 or Pascal")
60
‘ Single crystal ’

61
Polycrystalline sample

62
Ductile & brittle failures

63
Searle apparatus

64
Stress

65
Strain

66
Stress-strain graph (within proportional region)
")
67
Force-deformation curve Further reading

68
Stress-strain curve (1) Further reading
 Further reading")
69
Stress-strain curve (2)
")
70
Experimental set up

71
Extension Vs load graph

72
Strong and weak materials

73
Stiff and soft materials

74
Ductile and brittle materials

75
Strain energy W 1 = F 1 e 1 = area of shaded strip Strain energy = area OAB =

76
P.E.- separation curve r o = separation of atoms at equilibrium position E o = minimum P.E. attained |E o | = bonding energy

77
Interatomic force-separation curve At r o, F = 0 r < r o, F is repulsive r > r o, F is attractive

78
F(r) curve
 curve")
79
U(r) curve
 curve")
80
Closely-packed ions

81
Close packing arrangement

82
Dipole

83
Microscopic view of Hooke ’ s law

84
Atoms joined by springs

85
Thermal expansion

86
Creep curve

87
Movement of dislocations Bond BC is broken and is replaced by the bond CA The process is repeated and the dislocation moves from left to right through the crystal

88
Hysteresis loop

89
Shear stress and strain

Similar presentations


 Spring 2008 Dr. Konstantinos A. Sierros.>")


