Download presentation
Presentation is loading. Please wait.

1
Economic Impacts of Salinity in the Central Valley
Sacramento Regional Water Quality Control Board State Water Resources Control Board

2
Josué Medellin-Azuara Nancy Lee Gerald Horner
Richard Howitt Resource Economist, University of California, Davis Jonathan Kaplan Economist, California State University, Sacramento Doug Larson Duncan MacEwan Graduate Assistant, University of California, Davis Josué Medellin-Azuara Post Doctoral Researcher, University of California, Davis Nancy Lee Consulting Economist, Amherst Gerald Horner Economist, State Water Resources Control Board

3
Direct Economic Effects Non-market Economic Effects
Objective Economic Impacts of Salinity Accumulations in the Central Valley to 2030 Geographic Scope Major Central Valley Watersheds State Economic Scope General Equilibrium Direct Economic Effects Major Sectors Non-market Economic Effects

4
Estimate the Economic Effects of Salinity in the Central Valley to 2030
Assuming: Current Policy Parameters Environmental Development-Water and Land Use Economic International Existing Hydrogeology No Specific Constituent Analysis One Year Project

6
Central Valley Regional Water Quality Control Board

22
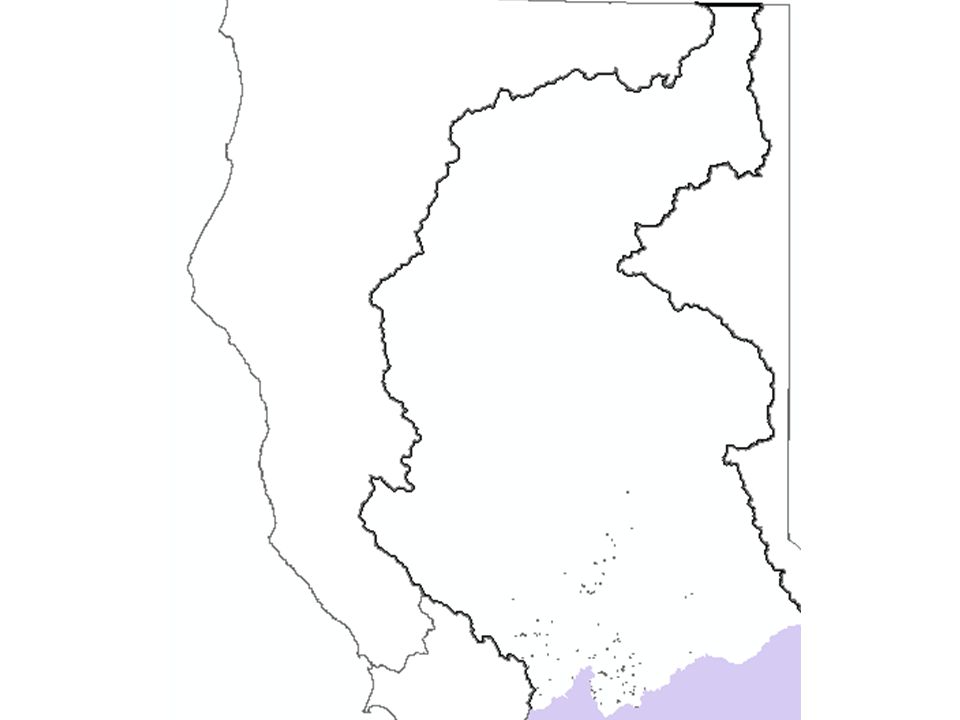
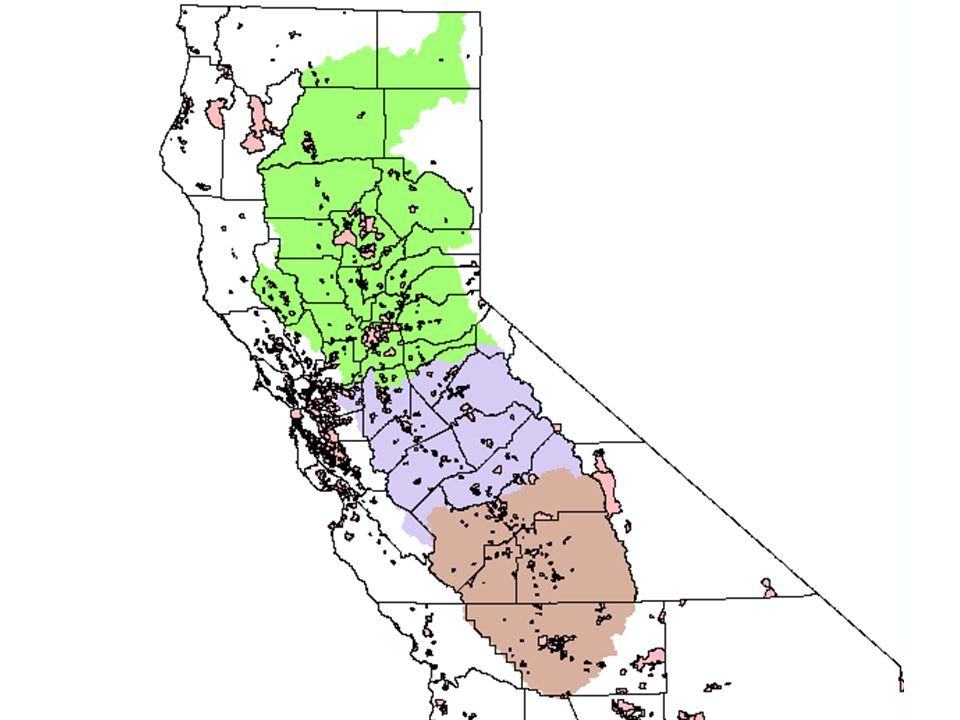
Sacramento River Basin San Joaquin River Basin
Tulare Lake Basin

23
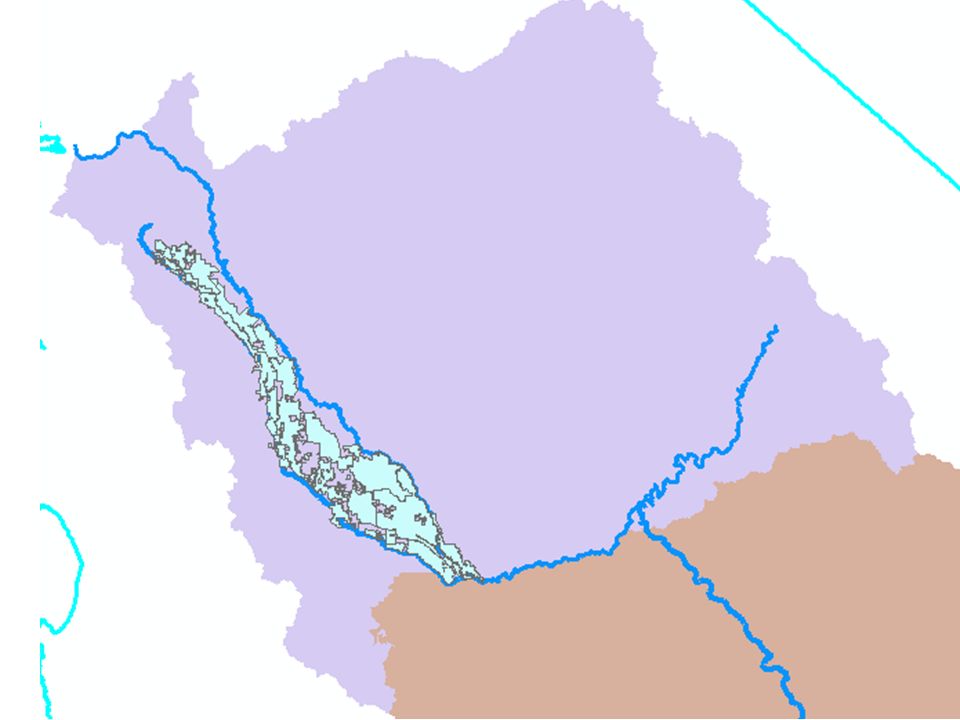
Friant Kern Canal

25
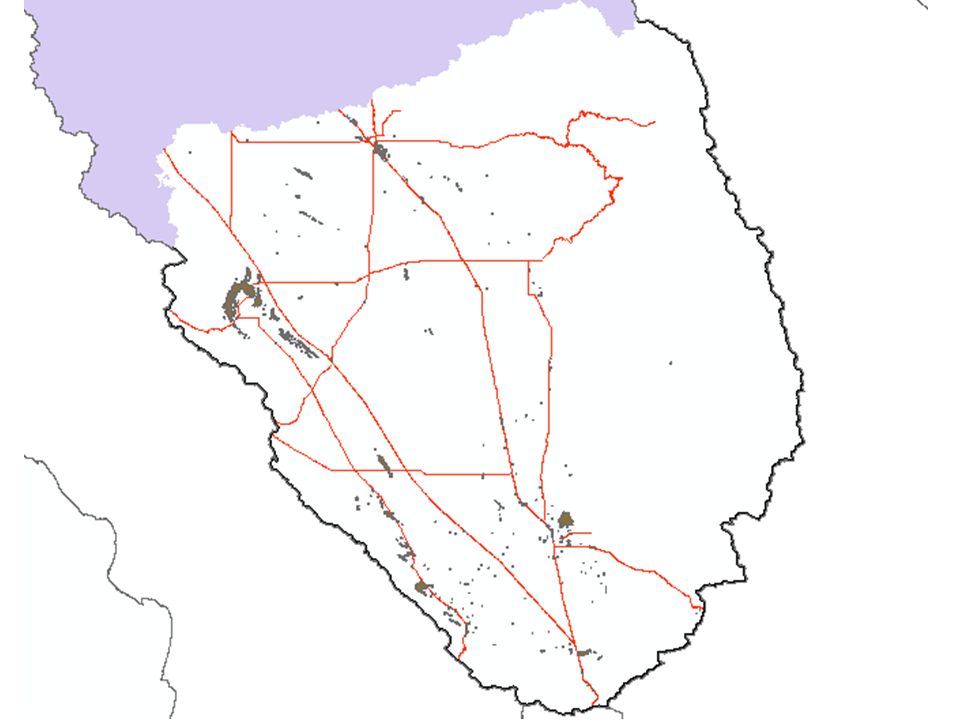
Delta-Mendota Canal

39
Sacramento Basin REMI Model County Configuration

53
Relative change in the shallow groundwater table (0. 46 - 0
Relative change in the shallow groundwater table ( % /pa-- Shoups 2004).
.")
54
Saline Affected Areas (DWR 2001)
")
56
Central Valley Production Model (19 Cells)
")
57
Baseline Annual Animal Numbers by Basin
Dairy Hog Cattle Broiler Layer Sacramento River 36,014 6,270 51,228 130,690 21,347 San Joaquin River 623,896 5,138 67,246 4,156,572 8,618,585 Tulare 843,750 8,290 49,005 14,005,610 13,257 Total 1,503,660 19,698 167,479 18,292,871 8,653,189

60
Total Economic Impacts
Output Gross Regional Product Income Employment Population Labor Force

61
California:

64
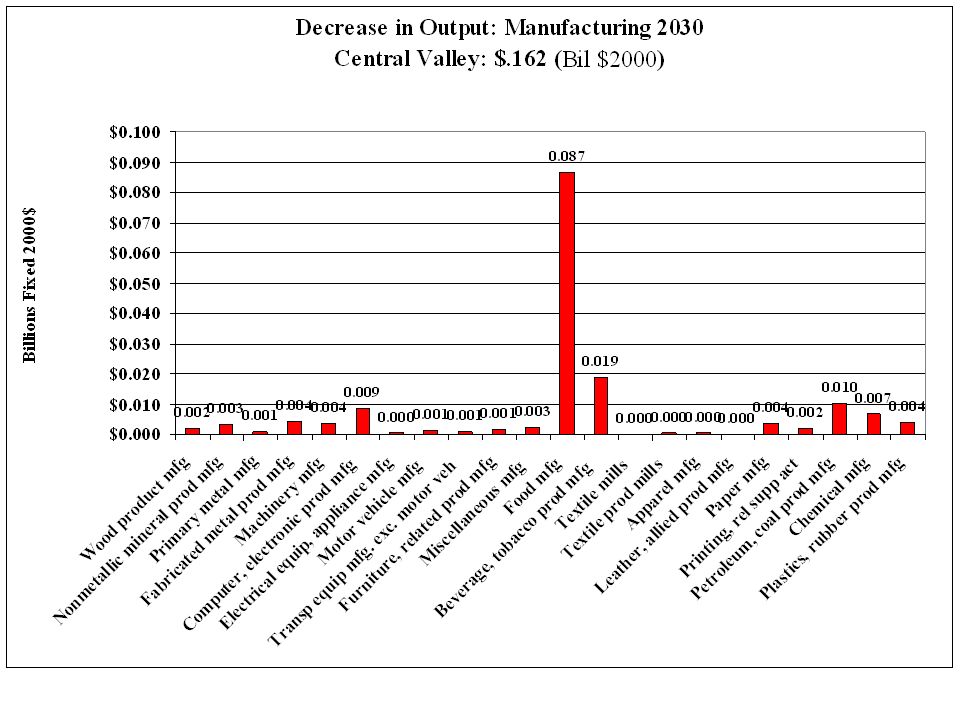
Decrease in Manufacturing Output: 2030 (Bil 2000$)
Area Basin Region State Sacramento $0.030 ----- San Joaquin $0.069 Tulare $0.063 Total Central Valley $0.162 Rest of California $0.203 California $0.365

65
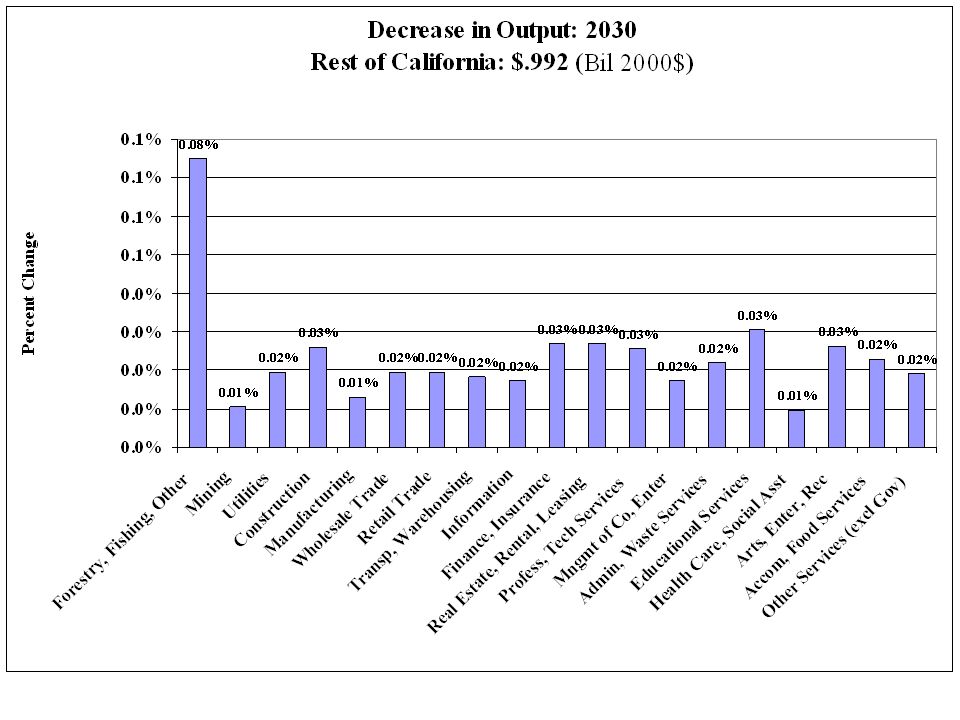
Rest of California

70
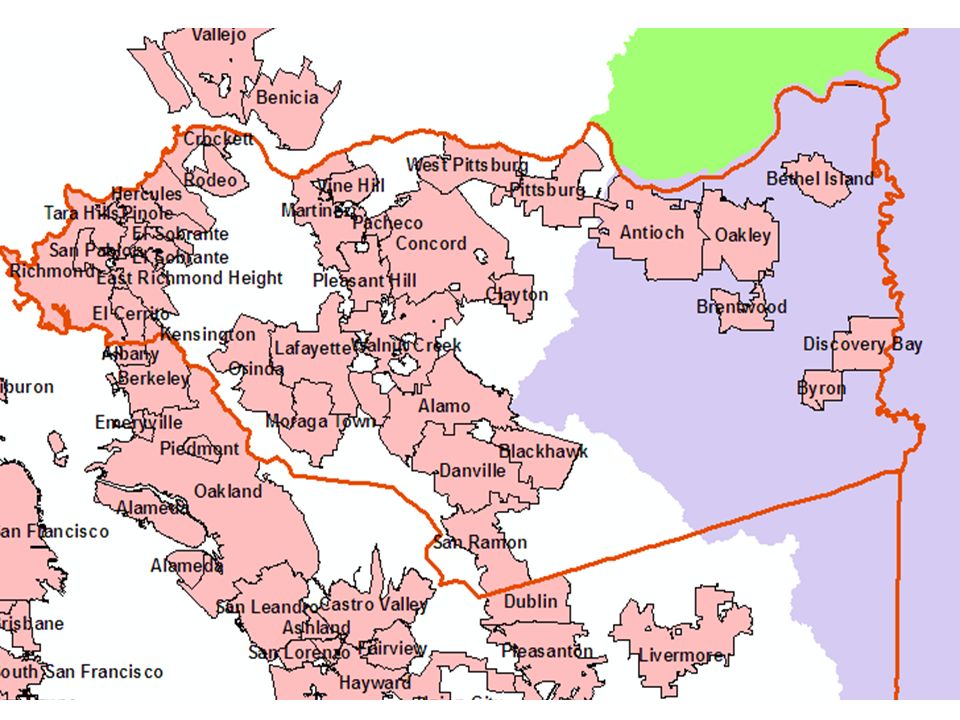
Central Valley

75
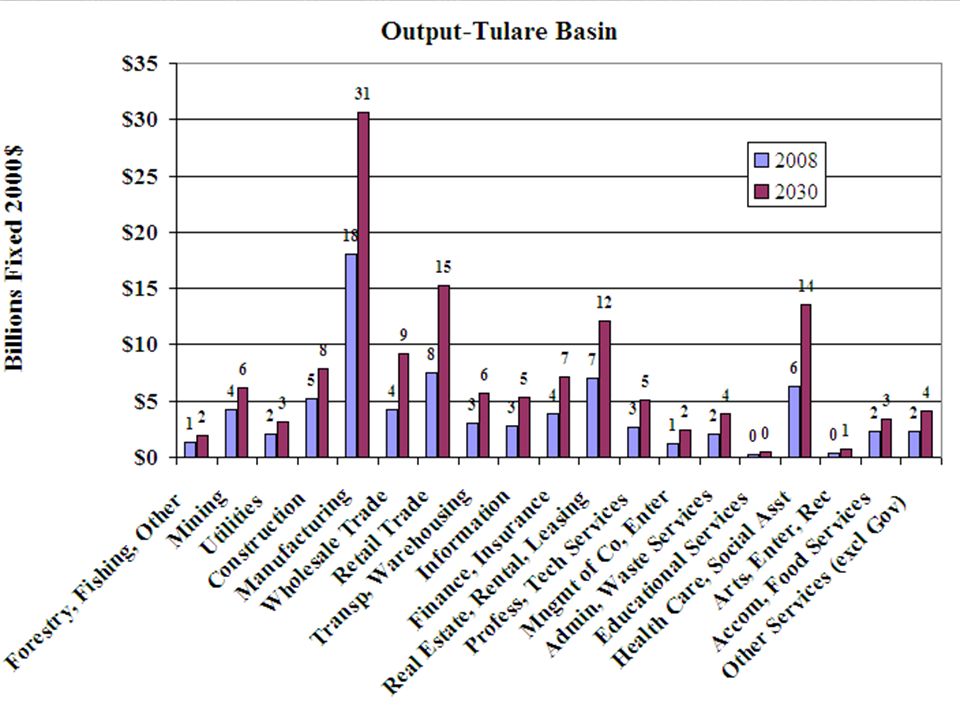
Tulare Lake Basin

80
San Joaquin River Basin

85
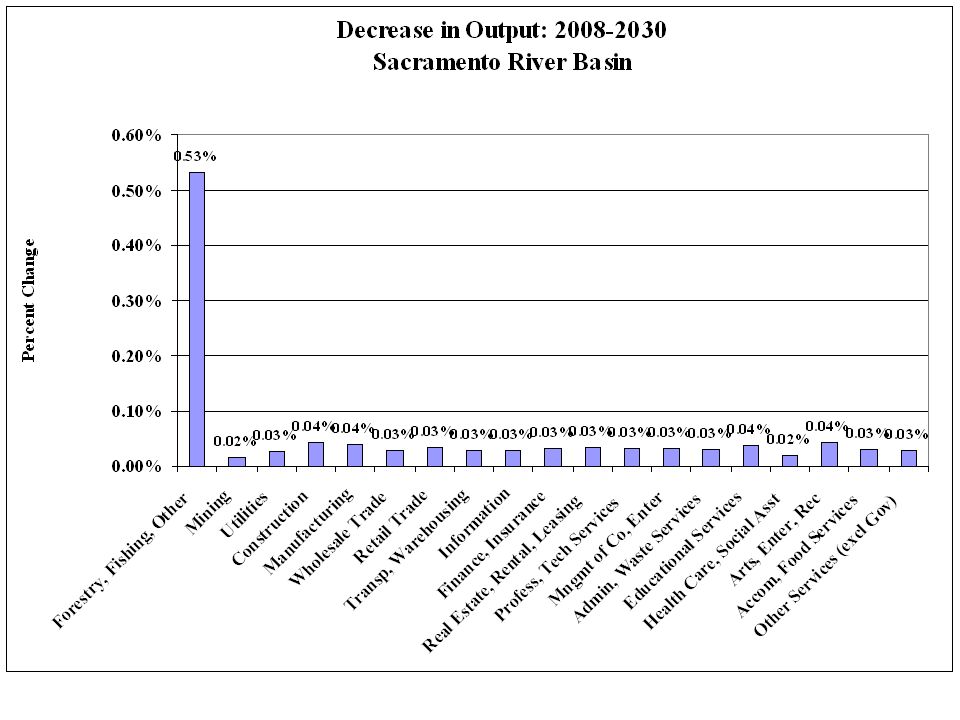
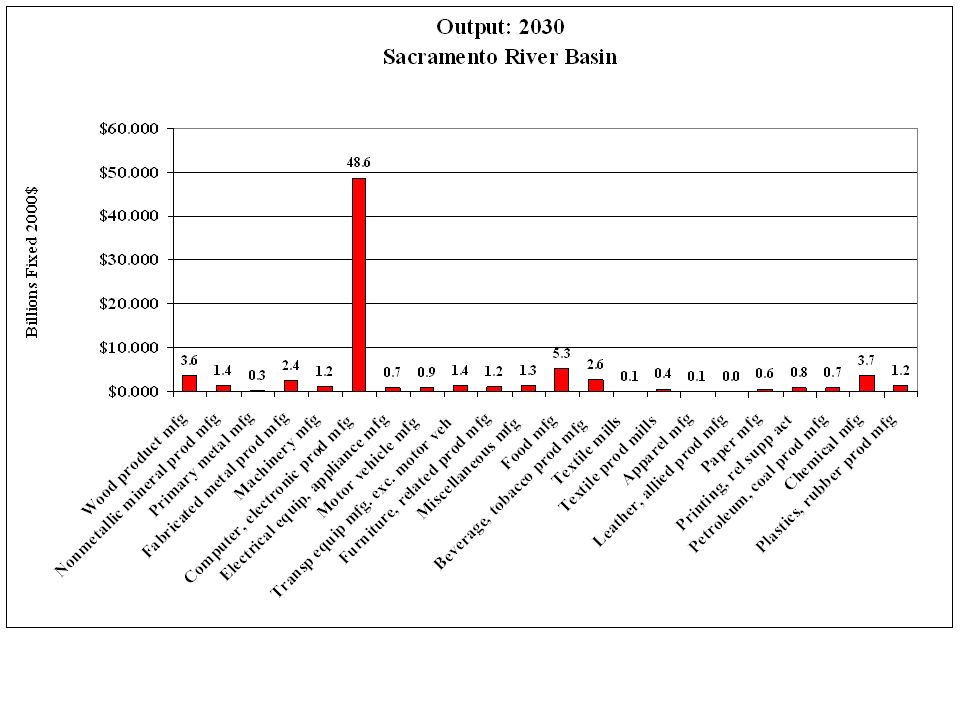
Sacramento River Basin

Similar presentations


 Irrigated Lands Regulatory Program (ILRP) Sierra Water Workgroup Summit June 11-13, 2013 Kings Beach, CA Presented.>")


 David Groves (RAND)>")