Download presentation
Presentation is loading. Please wait.

1
Trying to Use Databases for Science Jim Gray Microsoft Research http://research.microsoft.com/~gray

2
The World Wide Telescope Idea Data Mining the Sloan Digital Sky Survey Spherical Geometry in SQL

3
Computational Science Traditional Empirical Science –Scientist gathers data by direct observation –Scientist analyzes data Computational Science –Data captured by instruments Or data generated by simulator –Processed by software –Placed in a database / files –Scientist analyzes database / files

4
World Wide Telescope Virtual Observatory http://www.astro.caltech.edu/nvoconf/ http://www.voforum.org/ http://www.astro.caltech.edu/nvoconf/ http://www.voforum.org/ Premise: Most data is (or could be online) So, the Internet is the worlds best telescope: –It has data on every part of the sky –In every measured spectral band: optical, x-ray, radio.. –As deep as the best instruments (2 years ago). –It is up when you are up. The seeing is always great (no working at night, no clouds no moons no..). –Its a smart telescope: links objects and data to literature on them.
. –It is up when you are up. The seeing is always great (no working at night, no clouds no moons no..). –Its a smart telescope: links objects and data to literature on them..")
5
Whats needed? (not drawn to scale) Science Data & Questions Scientists Database To store data Execute Queries Plumbers Data Mining Algorithms Miners Question & Answer Visualization Tools
 Science Data & Questions Scientists Database To store data Execute Queries Plumbers Data Mining Algorithms Miners Question & Answer Visualization Tools.")
6
SkyServer SkyServer.SDSS.org SkyServer.SDSS.org Like the TerraServer, but looking the other way: a picture of ¼ of the universe Pixels + Data Mining Astronomers get about 400 attributes for each object Get Spectrograms for 1% of the objects

7
Why Astronomy Data? There is lots of it –High dimensional –Spatial –temporal Great sandbox for data mining algorithms –Can share cross company –University researchers Great way to teach both Astronomy and Computational Science Want to federate many instruments

8
Why Astronomy Data? It has no commercial value –No privacy concerns –Can freely share results with others –Great for experimenting with algorithms It is real and well documented –High-dimensional data (with confidence intervals) –Spatial data –Temporal data Many different instruments from many different places and many different times Federation is a goal The questions are interesting –How did the universe form? There is a lot of it (petabytes) IRAS 100 ROSAT ~keV DSS Optical 2MASS 2 IRAS 25 NVSS 20cm WENSS 92cm GB 6cm
 –Spatial data –Temporal data Many different instruments from many different places and many different times Federation is a goal The questions are interesting –How did the universe form. There is a lot of it (petabytes) IRAS 100 ROSAT ~keV DSS Optical 2MASS 2 IRAS 25 NVSS 20cm WENSS 92cm GB 6cm.")
9
Federation Data Federations of Web Services Massive datasets live near their owners: –Near the instruments software pipeline –Near the applications –Near data knowledge and curation –Super Computer centers become Super Data Centers Each Archive publishes a web service –Schema: documents the data –Methods on objects (queries) Scientists get personalized extracts Uniform access to multiple Archives –A common global schema
 Scientists get personalized extracts Uniform access to multiple Archives –A common global schema")
10
SkyQuery ( http://skyquery.net/) http://skyquery.net/ Distributed Query tool using a set of web services Feasibility study, built in 6 weeks from scratch –Tanu Malik (JHU CS grad student) –Tamas Budavari (JHU astro postdoc) –With help from Szalay, Thakar, Gray Implemented in C# and.NET Allows queries like: SELECT o.objId, o.r, o.type, t.objId FROM SDSS:PhotoPrimary o, TWOMASS:PhotoPrimary t WHERE XMATCH(o,t)<3.5 AND AREA(181.3,-0.76,6.5) AND o.type=3 and (o.I - t.m_j)>2
 –Tamas Budavari (JHU astro postdoc) –With help from Szalay, Thakar, Gray Implemented in C# and.NET Allows queries like: SELECT o.objId, o.r, o.type, t.objId FROM SDSS:PhotoPrimary o, TWOMASS:PhotoPrimary t WHERE XMATCH(o,t)<3.5 AND AREA(181.3,-0.76,6.5) AND o.type=3 and (o.I - t.m_j)>2")
11
Architecture Image cutout SkyNode SDSS SkyNode 2Mass SkyNode First SkyQuery Web Page

12
Show Cutout Web Service

13
The World Wide Telescope Idea Data Mining the Sloan Digital Sky Survey Spherical Geometry in SQL

14
Working Cross-Culture How to design the database: Scenario Design Astronomers proposed 20 questions Typical of things they want to do Each would require a week of programming in tcl / C++/ FTP Goal, make it easy to answer questions DB and tools design motivated by this goal –Implemented utility procedures –JHU Built Query GUI for Linux /Mac/.. clients

15
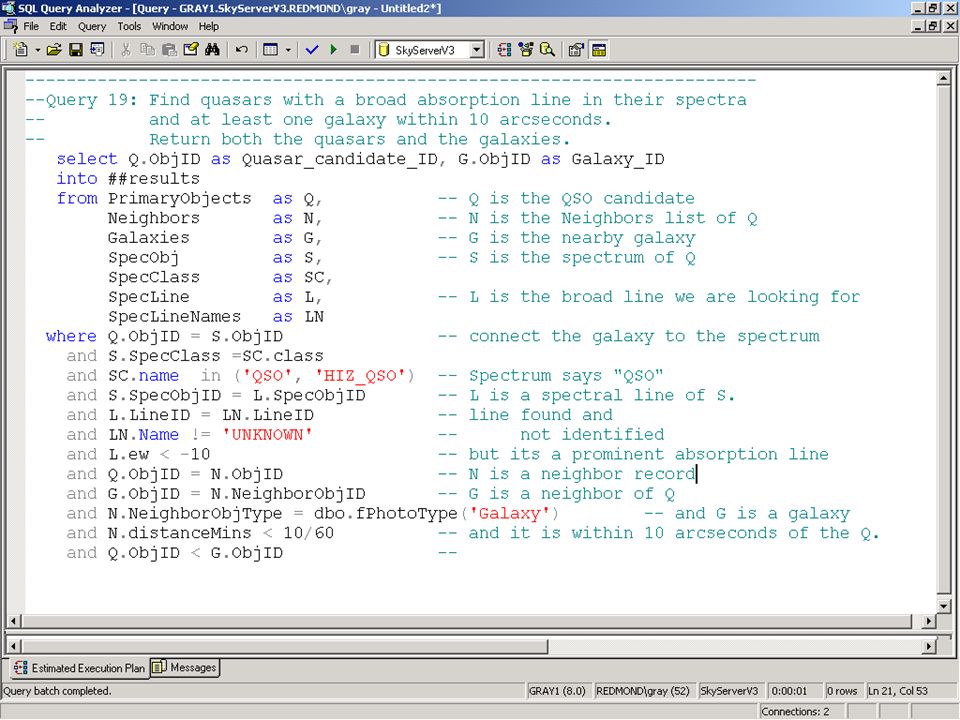
The 20 Queries Q11: Find all elliptical galaxies with spectra that have an anomalous emission line. Q12: Create a grided count of galaxies with u-g>1 and r<21.5 over 60<declination<70, and 200<right ascension<210, on a grid of 2, and create a map of masks over the same grid. Q13: Create a count of galaxies for each of the HTM triangles which satisfy a certain color cut, like 0.7u-0.5g-0.2i<1.25 && r<21.75, output it in a form adequate for visualization. Q14: Find stars with multiple measurements and have magnitude variations >0.1. Scan for stars that have a secondary object (observed at a different time) and compare their magnitudes. Q15: Provide a list of moving objects consistent with an asteroid. Q16: Find all objects similar to the colors of a quasar at 5.5<redshift<6.5. Q17: Find binary stars where at least one of them has the colors of a white dwarf. Q18: Find all objects within 30 arcseconds of one another that have very similar colors: that is where the color ratios u-g, g-r, r-I are less than 0.05m. Q19: Find quasars with a broad absorption line in their spectra and at least one galaxy within 10 arcseconds. Return both the quasars and the galaxies. Q20: For each galaxy in the BCG data set (brightest color galaxy), in 160<right ascension<170, -25<declination<35 count of galaxies within 30"of it that have a photoz within 0.05 of that galaxy. Q1: Find all galaxies without unsaturated pixels within 1' of a given point of ra=75.327, dec=21.023 Q2: Find all galaxies with blue surface brightness between and 23 and 25 mag per square arcseconds, and - 10<super galactic latitude (sgb) <10, and declination less than zero. Q3: Find all galaxies brighter than magnitude 22, where the local extinction is >0.75. Q4: Find galaxies with an isophotal surface brightness (SB) larger than 24 in the red band, with an ellipticity>0.5, and with the major axis of the ellipse having a declination of between 30 and 60arc seconds. Q5: Find all galaxies with a deVaucouleours profile (r ¼ falloff of intensity on disk) and the photometric colors consistent with an elliptical galaxy. The deVaucouleours profile Q6: Find galaxies that are blended with a star, output the deblended galaxy magnitudes. Q7: Provide a list of star-like objects that are 1% rare. Q8: Find all objects with unclassified spectra. Q9: Find quasars with a line width >2000 km/s and 2.5<redshift<2.7. Q10: Find galaxies with spectra that have an equivalent width in Ha >40Å (Ha is the main hydrogen spectral line.) Also some good queries at: http://www.sdss.jhu.edu/ScienceArchive/sxqt/sxQT/Example_Queries.html http://www.sdss.jhu.edu/ScienceArchive/sxqt/sxQT/Example_Queries.html
 and compare their magnitudes. Q15: Provide a list of moving objects consistent with an asteroid. Q16: Find all objects similar to the colors of a quasar at 5.5<redshift<6.5. Q17: Find binary stars where at least one of them has the colors of a white dwarf. Q18: Find all objects within 30 arcseconds of one another that have very similar colors: that is where the color ratios u-g, g-r, r-I are less than 0.05m. Q19: Find quasars with a broad absorption line in their spectra and at least one galaxy within 10 arcseconds. Return both the quasars and the galaxies. Q20: For each galaxy in the BCG data set (brightest color galaxy), in 160<right ascension<170, -25<declination<35 count of galaxies within 30 of it that have a photoz within 0.05 of that galaxy. Q1: Find all galaxies without unsaturated pixels within 1 of a given point of ra=75.327, dec= Q2: Find all galaxies with blue surface brightness between and 23 and 25 mag per square arcseconds, and - 10<super galactic latitude (sgb) <10, and declination less than zero. Q3: Find all galaxies brighter than magnitude 22, where the local extinction is >0.75. Q4: Find galaxies with an isophotal surface brightness (SB) larger than 24 in the red band, with an ellipticity>0.5, and with the major axis of the ellipse having a declination of between 30 and 60arc seconds. Q5: Find all galaxies with a deVaucouleours profile (r ¼ falloff of intensity on disk) and the photometric colors consistent with an elliptical galaxy. The deVaucouleours profile Q6: Find galaxies that are blended with a star, output the deblended galaxy magnitudes. Q7: Provide a list of star-like objects that are 1% rare. Q8: Find all objects with unclassified spectra. Q9: Find quasars with a line width >2000 km/s and 2.5<redshift<2.7. Q10: Find galaxies with spectra that have an equivalent width in Ha >40Å (Ha is the main hydrogen spectral line.) Also some good queries at:")
16
Two kinds of SDSS data in an SQL DB (objects and images all in DB) 100M Photo Objects ~ 400 attributes 400K Spectra with ~30 lines/ spectrum
 100M Photo Objects ~ 400 attributes 400K Spectra with ~30 lines/ spectrum")
17
An easy one: Q7: Provide a list of star-like objects that are 1% rare. Found 14,681 buckets, first 140 buckets have 99% time 104 seconds Disk bound, reads 3 disks at 68 MBps. Selectcast((u-g) as int) as ug, cast((g-r) as int) as gr, cast((r-i) as int) as ri, cast((i-z) as int) as iz, count(*) as Population from stars group bycast((u-g) as int), cast((g-r) as int), cast((r-i) as int), cast((i-z) as int) order by count(*)
 as int) as ug, cast((g-r) as int) as gr, cast((r-i) as int) as ri, cast((i-z) as int) as iz, count(*) as Population from stars group bycast((u-g) as int), cast((g-r) as int), cast((r-i) as int), cast((i-z) as int) order by count(*).")
18
An easy one Q15: Provide a list of moving objects consistent with an asteroid. Sounds hard but there are 5 pictures of the object at 5 different times (colors) and so can compute velocity. Image pipeline computes velocity. Computing it from the 5 color x,y would also be fast Finds 285 objects in 3 minutes, 140MBps. selectobjId, -- return object ID sqrt(power(rowv,2)+power(colv,2)) as velocity fromphotoObj -- check each object. where (power(rowv,2) + power(colv, 2)) -- square of velocity between 50 and 1000 -- huge values =error
 and so can compute velocity. Image pipeline computes velocity. Computing it from the 5 color x,y would also be fast Finds 285 objects in 3 minutes, 140MBps. selectobjId, -- return object ID sqrt(power(rowv,2)+power(colv,2)) as velocity fromphotoObj -- check each object. where (power(rowv,2) + power(colv, 2)) -- square of velocity between 50 and huge values =error.")
19
Q15: Fast Moving Objects Find near earth asteroids: SELECT r.objID as rId, g.objId as gId, r.run, r.camcol, r.field as field, g.field as gField, r.ra as ra_r, r.dec as dec_r, g.ra as ra_g, g.dec as dec_g, sqrt( power(r.cx -g.cx,2)+ power(r.cy-g.cy,2)+power(r.cz-g.cz,2) )*(10800/PI()) as distance FROM PhotoObj r, PhotoObj g WHERE r.run = g.run and r.camcol=g.camcol and abs(g.field-r.field)<2 -- the match criteria -- the red selection criteria and ((power(r.q_r,2) + power(r.u_r,2)) > 0.111111 ) and r.fiberMag_r between 6 and 22 and r.fiberMag_r < r.fiberMag_g and r.fiberMag_r < r.fiberMag_i and r.parentID=0 and r.fiberMag_r < r.fiberMag_u and r.fiberMag_r < r.fiberMag_z and r.isoA_r/r.isoB_r > 1.5 and r.isoA_r>2.0 -- the green selection criteria and ((power(g.q_g,2) + power(g.u_g,2)) > 0.111111 ) and g.fiberMag_g between 6 and 22 and g.fiberMag_g < g.fiberMag_r and g.fiberMag_g < g.fiberMag_i and g.fiberMag_g < g.fiberMag_u and g.fiberMag_g < g.fiberMag_z and g.parentID=0 and g.isoA_g/g.isoB_g > 1.5 and g.isoA_g > 2.0 -- the matchup of the pair and sqrt(power(r.cx -g.cx,2)+ power(r.cy-g.cy,2)+power(r.cz-g.cz,2))*(10800/PI())< 4.0 and abs(r.fiberMag_r-g.fiberMag_g)< 2.0 Finds 3 objects in 11 minutes –(or 27 seconds with an index) Ugly, but consider the alternatives (c programs an files and…) –
+ power(r.cy-g.cy,2)+power(r.cz-g.cz,2) )*(10800/PI()) as distance FROM PhotoObj r, PhotoObj g WHERE r.run = g.run and r.camcol=g.camcol and abs(g.field-r.field)<2 -- the match criteria -- the red selection criteria and ((power(r.q_r,2) + power(r.u_r,2)) > ) and r.fiberMag_r between 6 and 22 and r.fiberMag_r < r.fiberMag_g and r.fiberMag_r < r.fiberMag_i and r.parentID=0 and r.fiberMag_r < r.fiberMag_u and r.fiberMag_r < r.fiberMag_z and r.isoA_r/r.isoB_r > 1.5 and r.isoA_r> the green selection criteria and ((power(g.q_g,2) + power(g.u_g,2)) > ) and g.fiberMag_g between 6 and 22 and g.fiberMag_g < g.fiberMag_r and g.fiberMag_g < g.fiberMag_i and g.fiberMag_g < g.fiberMag_u and g.fiberMag_g < g.fiberMag_z and g.parentID=0 and g.isoA_g/g.isoB_g > 1.5 and g.isoA_g > the matchup of the pair and sqrt(power(r.cx -g.cx,2)+ power(r.cy-g.cy,2)+power(r.cz-g.cz,2))*(10800/PI())< 4.0 and abs(r.fiberMag_r-g.fiberMag_g)< 2.0 Finds 3 objects in 11 minutes –(or 27 seconds with an index) Ugly, but consider the alternatives (c programs an files and…) –")
21
A Hard One Q14: Find stars with multiple measurements that have magnitude variations >0.1. This should work, but SQL Server does not allow table values to be piped to table- valued functions. select S.object_ID, S1.object_ID-- return stars that from StarsS,-- S is a star getNearbyObjEq(s.ra, s.dec, 0.017) as N -- N within 1 arcsec (3 pixels) of S. Stars S1-- N == S1 (S1 gets the colors) where S.Object_ID < N.Object_ID-- S1 different from S == N and N.Type = dbo.PhotoType('Star')-- S1 is a star (an optimization) and N.object_ID = S1.Object_ID-- N == S1 and ( abs(S.u-S1.u) > 0.1 -- one of the colors is different. or abs(S.g-S1.g) > 0.1 or abs(S.r-S1.r) > 0.1 or abs(S.i-S1.i) > 0.1 or abs(S.z-S1.z) > 0.1 ) order by S.object_ID, S1.object_ID-- group the answer by parent star. Returns a table of nearby objects
 as N -- N within 1 arcsec (3 pixels) of S. Stars S1-- N == S1 (S1 gets the colors) where S.Object_ID < N.Object_ID-- S1 different from S == N and N.Type = dbo.PhotoType( Star )-- S1 is a star (an optimization) and N.object_ID = S1.Object_ID-- N == S1 and ( abs(S.u-S1.u) > one of the colors is different. or abs(S.g-S1.g) > 0.1 or abs(S.r-S1.r) > 0.1 or abs(S.i-S1.i) > 0.1 or abs(S.z-S1.z) > 0.1 ) order by S.object_ID, S1.object_ID-- group the answer by parent star. Returns a table of nearby objects.")
22
A Hard one: Second Try: Q14 Find stars with multiple measurements that have magnitude variations >0.1. ------------------------------------------------------------------------------- -- Table-valued function that returns the binary stars within a certain radius -- of another (in arc-minutes) (typically 5 arc seconds). -- Returns the ID pairs and the distance between them (in arcseconds). create function BinaryStars(@MaxDistanceArcMins float) returns @BinaryCandidatesTable table( S1_object_ID bigint not null, -- Star #1 S2_object_ID bigint not null, -- Star #2 distance_arcSec float) -- distance between them as begin declare @star_ID bigint, @binary_ID bigint;-- Star's ID and binary ID declare @ra float, @dec float;-- Star's position declare @u float, @g float, @r float, @i float,@z float; -- Star's colors ----------------Open a cursor over stars and get position and colors declare star_cursor cursor for select object_ID, ra, [dec], u, g, r, i, z from Stars; open star_cursor; while (1=1)-- for each star begin -- get its attribues fetch next from star_cursor into @star_ID, @ra, @dec, @u, @g, @r, @i, @z; if (@@fetch_status = -1) break;-- end if no more stars insert into @BinaryCandidatesTable -- insert its binaries select @star_ID, S1.object_ID, -- return stars pairs sqrt(N.DotProd)/PI()*10800 -- and distance in arc-seconds from getNearbyObjEq(@ra, @dec, -- Find objects nearby S. @MaxDistanceArcMins) as N, -- call them N. Stars as S1-- S1 gets N's color values where @star_ID < N.Object_ID-- S1 different from S and N.objType = dbo.PhotoType('Star')-- S1 is a star and N.object_ID = S1.object_ID-- join stars to get colors of S1==N and (abs(@u-S1.u) > 0.1 -- one of the colors is different. or abs(@g-S1.g) > 0.1 or abs(@r-S1.r) > 0.1 or abs(@i-S1.i) > 0.1 or abs(@z-S1.z) > 0.1 ) end;-- end of loop over all stars -------------- Looped over all stars, close cursor and exit. close star_cursor;-- deallocate star_cursor; return;-- return table end-- end of BinaryStars GO select * from dbo.BinaryStars(.05) Write a program with a cursor, ran for 2 days
 (typically 5 arc seconds). -- Returns the ID pairs and the distance between them (in arcseconds). create function float) table( S1_object_ID bigint not null, -- Star #1 S2_object_ID bigint not null, -- Star #2 distance_arcSec float) -- distance between them as begin bigint;-- Star s ID and binary ID float;-- Star s position float; -- Star s colors Open a cursor over stars and get position and colors declare star_cursor cursor for select object_ID, ra, [dec], u, g, r, i, z from Stars; open star_cursor; while (1=1)-- for each star begin -- get its attribues fetch next from if = -1) break;-- end if no more stars insert -- insert its binaries S1.object_ID, -- return stars pairs sqrt(N.DotProd)/PI()* and distance in arc-seconds -- Find objects nearby as N, -- call them N. Stars as S1-- S1 gets N s color values < N.Object_ID-- S1 different from S and N.objType = dbo.PhotoType( Star )-- S1 is a star and N.object_ID = S1.object_ID-- join stars to get colors of S1==N and > one of the colors is different. or > 0.1 or > 0.1 or > 0.1 or > 0.1 ) end;-- end of loop over all stars Looped over all stars, close cursor and exit. close star_cursor;-- deallocate star_cursor; return;-- return table end-- end of BinaryStars GO select * from dbo.BinaryStars(.05) Write a program with a cursor, ran for 2 days.")
23
A Hard one: Third Try Q14: Find stars with multiple measurements that have magnitude variations >0.1. Use pre-computed neighbors table. Ran in 17 minutes, found 31k pairs. ================================================================================== -- Plan 2: Use the precomputed neighbors table select top 100 S.object_ID, S1.object_ID,-- return star pairs and distance str(N.Distance_mins * 60,6,1) as DistArcSec from Stars S,-- S is a star Neighbors N,-- N within 3 arcsec (10 pixels) of S. Stars S1-- S1 == N has the color attibutes where S.Object_ID = N.Object_ID-- connect S and N. and S.Object_ID < N.Neighbor_Object_ID-- S1 different from S and N.Neighbor_objType = dbo.PhotoType('Star')-- S1 is a star (an optimization) and N.Distance_mins <.05-- the 3 arcsecond test and N.Neighbor_object_ID = S1.Object_ID-- N == S1 and ( abs(S.u-S1.u) > 0.1 -- one of the colors is different. or abs(S.g-S1.g) > 0.1 or abs(S.r-S1.r) > 0.1 or abs(S.i-S1.i) > 0.1 or abs(S.z-S1.z) > 0.1 ) -- Found 31,355 pairs (out of 4.4 m stars) in 17 min 14 sec.
 as DistArcSec from Stars S,-- S is a star Neighbors N,-- N within 3 arcsec (10 pixels) of S. Stars S1-- S1 == N has the color attibutes where S.Object_ID = N.Object_ID-- connect S and N. and S.Object_ID < N.Neighbor_Object_ID-- S1 different from S and N.Neighbor_objType = dbo.PhotoType( Star )-- S1 is a star (an optimization) and N.Distance_mins <.05-- the 3 arcsecond test and N.Neighbor_object_ID = S1.Object_ID-- N == S1 and ( abs(S.u-S1.u) > one of the colors is different. or abs(S.g-S1.g) > 0.1 or abs(S.r-S1.r) > 0.1 or abs(S.i-S1.i) > 0.1 or abs(S.z-S1.z) > 0.1 ) -- Found 31,355 pairs (out of 4.4 m stars) in 17 min 14 sec..")
24
The Pain of Going Outside SQL (its fortunate that all the queries are single statements) Count parent objects 503 seconds for 14.7 M objects in 33.3 GB 66 MBps IO bound (30% of one cpu) 100 k records/cpu sec Use a cursor No cpu parallelism CPU bound 6 MBps, 2.7 k rps 5,450 seconds (10x slower) select count(*) from sxPhotoObj where nChild > 0 declare @count int; declare @sum int; set @sum = 0; declare PhotoCursor cursor for select nChild from sxPhotoObj; open PhotoCursor; while (1=1) begin fetch next from PhotoCursor into @count; if (@@fetch_status = -1) break; set @sum = @sum + @count; end close PhotoCursor; deallocate PhotoCursor; print 'Sum is: '+cast(@sum as varchar(12))
 Count parent objects 503 seconds for 14.7 M objects in 33.3 GB 66 MBps IO bound (30% of one cpu) 100 k records/cpu sec Use a cursor No cpu parallelism CPU bound 6 MBps, 2.7 k rps 5,450 seconds (10x slower) select count(*) from sxPhotoObj where nChild > 0 int; int; = 0; declare PhotoCursor cursor for select nChild from sxPhotoObj; open PhotoCursor; while (1=1) begin fetch next from PhotoCursor if = -1) break; end close PhotoCursor; deallocate PhotoCursor; print Sum is: as varchar(12))")
27
Q15: Fast Moving Objects Find near earth asteroids: Finds 3 objects in 11 minutes –(or 52 seconds with an index) Ugly, but consider the alternatives (c programs and files and time…) – SELECT r.objID as rId, g.objId as gId, dbo.fGetUrlEq(g.ra, g.dec) as url FROM PhotoObj r, PhotoObj g WHERE r.run = g.run and r.camcol=g.camcol and abs(g.field-r.field)<2 -- nearby -- the red selection criteria and ((power(r.q_r,2) + power(r.u_r,2)) > 0.111111 ) and r.fiberMag_r between 6 and 22 and r.fiberMag_r < r.fiberMag_g and r.fiberMag_r < r.fiberMag_i and r.parentID=0 and r.fiberMag_r < r.fiberMag_u and r.fiberMag_r < r.fiberMag_z and r.isoA_r/r.isoB_r > 1.5 and r.isoA_r>2.0 -- the green selection criteria and ((power(g.q_g,2) + power(g.u_g,2)) > 0.111111 ) and g.fiberMag_g between 6 and 22 and g.fiberMag_g < g.fiberMag_r and g.fiberMag_g < g.fiberMag_i and g.fiberMag_g < g.fiberMag_u and g.fiberMag_g < g.fiberMag_z and g.parentID=0 and g.isoA_g/g.isoB_g > 1.5 and g.isoA_g > 2.0 -- the matchup of the pair and sqrt(power(r.cx -g.cx,2)+ power(r.cy-g.cy,2)+power(r.cz-g.cz,2))*(10800/PI())< 4.0 and abs(r.fiberMag_r-g.fiberMag_g)< 2.0
 Ugly, but consider the alternatives (c programs and files and time…) – SELECT r.objID as rId, g.objId as gId, dbo.fGetUrlEq(g.ra, g.dec) as url FROM PhotoObj r, PhotoObj g WHERE r.run = g.run and r.camcol=g.camcol and abs(g.field-r.field)<2 -- nearby -- the red selection criteria and ((power(r.q_r,2) + power(r.u_r,2)) > ) and r.fiberMag_r between 6 and 22 and r.fiberMag_r < r.fiberMag_g and r.fiberMag_r < r.fiberMag_i and r.parentID=0 and r.fiberMag_r < r.fiberMag_u and r.fiberMag_r < r.fiberMag_z and r.isoA_r/r.isoB_r > 1.5 and r.isoA_r> the green selection criteria and ((power(g.q_g,2) + power(g.u_g,2)) > ) and g.fiberMag_g between 6 and 22 and g.fiberMag_g < g.fiberMag_r and g.fiberMag_g < g.fiberMag_i and g.fiberMag_g < g.fiberMag_u and g.fiberMag_g < g.fiberMag_z and g.parentID=0 and g.isoA_g/g.isoB_g > 1.5 and g.isoA_g > the matchup of the pair and sqrt(power(r.cx -g.cx,2)+ power(r.cy-g.cy,2)+power(r.cz-g.cz,2))*(10800/PI())< 4.0 and abs(r.fiberMag_r-g.fiberMag_g)< 2.0")
28
Performance (on current SDSS data) Run times: on 15k$ HP Server (2 cpu, 1 GB, 8 disk) Some take 10 minutes Some take 1 minute Median ~ 22 sec. Ghz processors are fast! –(10 mips/IO, 200 ins/byte) –2.5 m rec/s/cpu ~1,000 IO/cpu sec ~ 64 MB IO/cpu sec
 –2.5 m rec/s/cpu ~1,000 IO/cpu sec ~ 64 MB IO/cpu sec.")
29
The World Wide Telescope Idea Data Mining the Sloan Digital Sky Survey Spherical Geometry in SQL

30
Spherical Geometry Astronomy has redshifts (3D), but often works with celestial sphere (2D) Distance ~ arc angle Extended SQL to have neighbor functions –GetNearestObject() returns a table with one row –GetNearbyObjects() returns a table
, but often works with celestial sphere (2D) Distance ~ arc angle Extended SQL to have neighbor functions –GetNearestObject() returns a table with one row –GetNearbyObjects() returns a table")
31
2,2 2,1 2,0 2,3 2,3,0 2,3,1 2,3,22,3,3 2,2 2,1 2,0 2,32,2 2,1 2,0 2,3 2,3,0 2,3,1 2,3,22,3,3 2,3,0 2,3,1 2,3,22,3,3 2 Hierarchical Triangular Mesh (HTM) Szalay, Kunszt, Brunner http://www.sdss.jhu.edu/htmhttp://www.sdss.jhu.edu/htm Every object has a 20-deep Mesh ID Given an area routine returns set of covering triangles Each triangle implies range query: htmID in triangle iff htmID in [traingle.min…triangle.max) Reject false positives with careful geometry test Very fast: 10,000 triangles / second / cpu
 Szalay, Kunszt, Brunner Every object has a 20-deep Mesh ID Given an area routine returns set of covering triangles Each triangle implies range query: htmID in triangle iff htmID in [traingle.min…triangle.max) Reject false positives with careful geometry test Very fast: 10,000 triangles / second / cpu")
32
Using Hierarchical Triangular Mesh select * from photoObj as p, fHtmCover(x,y,z,r) as n where p.htmID between n.start and n.end and (2*asin(sqrt(power(x-cx,2)+power(y-cy,2)+power(z-cz,2))/2)) < radians(r) This is packaged as: –fGetNearbyObjects(x,y,z,r) This is the geometry test
 as n where p.htmID between n.start and n.end and (2*asin(sqrt(power(x-cx,2)+power(y-cy,2)+power(z-cz,2))/2)) < radians(r) This is packaged as: –fGetNearbyObjects(x,y,z,r) This is the geometry test")
33
+convex1 +convex2 -convex3 l Spherical Areas SphericalArea = { ± ConvexArea} ConvexArea = {± SphericalEdge} = {PlaneSphereIntersect} Plane = normal unit vector v (vx,vy,vz) length l. Point p= (x,y,z) on the unit sphere is inside the edge if (xyz)(vx,vy,vz)> l. A point is inside a convex area if it is inside each of the edges. Non-convex areas are convex area unions. Swiss-cheese areas (holes in them) are positive and negative convex areas actually, just negative lengths.
 on the unit sphere is inside the edge if (xyz)(vx,vy,vz)> l. A point is inside a convex area if it is inside each of the edges. Non-convex areas are convex area unions. Swiss-cheese areas (holes in them) are positive and negative convex areas actually, just negative lengths..")
34
Areas as Tables --- An area is a set of convexes that have a set of edges. create table Area ( AreaIDinteger,-- the unique identifier of the area ConvexIDinteger, -- the unique identifier of a convex EdgeIDinteger,-- unique id of the edge of an edge x float,-- the xyz vector of the edge (v) y float,-- z float,-- l float,-- the vector length. primary key (AreaID, ConvexID, EdgeID) )
 y float,-- z float,-- l float,-- the vector length. primary key (AreaID, ConvexID, EdgeID) ).")
35
Point in Convex declare @aID int-- area ID is a parameter select * -- return all points from Points p -- where not exists ( -- where there is no edge select EdgeID -- select edges from Area a-- in the area where AreaID = @aID -- where the point and (p.cx*a.x + p.cy*a.y + p.cz*a.z) < a.l) –- is outside the edge )
 < a.l) –- is outside the edge )")
36
Point in Polygon (union of convexes) select * -- return all points from Points p -- in the area where exists (-- Where there is a convex select ConvexID -- there is a convex from area a-- in the area where AreaID = @aID -- where the count of points and (p.cx*a.x + p.cy*a.y + p.cz*a.z) < a.l -- group by all ConvexID -- outside an edge of the convex having count(*) = 0 -- is zero (no outside points) )
 select * -- return all points from Points p -- in the area where exists (-- Where there is a convex select ConvexID -- there is a convex from area a-- in the area where AreaID -- where the count of points and (p.cx*a.x + p.cy*a.y + p.cz*a.z) < a.l -- group by all ConvexID -- outside an edge of the convex having count(*) = 0 -- is zero (no outside points) )")
37
A harder problem: compute the materialized view: (object, neighborObject, distance) for all distance less than 30 asec Using nearby function: 1 cpu day/ 1 Mobj Using set operators: 1 cpu day/ 100 Mobj An interesting algorithm: –hint: break into horizontal zones 30asec high –Join 3 pairs of zones. –Worry about wrap-around on the sphere

38
So what? SQL is a functional programming language, perhaps the most popular one. Set problems are easy in set-oriented languages. We (I) have not been thinking in sets (since I left the math department). This set-oriented approach is faster than the HTM function because it is inside the DB and it is batched
 have not been thinking in sets (since I left the math department). This set-oriented approach is faster than the HTM function because it is inside the DB and it is batched.")
39
The World Wide Telescope Idea Data Mining the Sloan Digital Sky Survey Spherical Geometry in SQL

40
Call to Action If you do data visualization: we need you (and we know it). If you do databases: here is some data you can practice on. If you do distributed systems: here is a federation you can practice on. If you do data mining here is a dataset to test your algorithms. If you do astronomy educational outreach here is a tool for you.

41
http://SkyServer.SDSS.org/ http://research.microsoft.com/pubs http://SkyServer.SDSS.org/ http://research.microsoft.com/pubs SkyServer references http://SkyServer.SDSS.org/ http://research.microsoft.com/pubs / http://SkyServer.SDSS.org/ http://research.microsoft.com/pubs / Data Mining the SDSS SkyServer Database Jim Gray; Peter Kunszt; Donald Slutz; Alex Szalay; Ani Thakar; Jan Vandenberg; Chris Stoughton Jan. 2002 40 p. An earlier paper described the Sloan Digital Sky Surveys (SDSS) data management needs [Szalay1] by defining twenty database queries and twelve data visualization tasks that a good data management system should support. We built a database and interfaces to support both the query load and also a website for ad-hoc access. This paper reports on the database design, describes the data loading pipeline, and reports on the query implementation and performance. The queries typically translated to a single SQL statement. Most queries run in less than 20 seconds, allowing scientists to interactively explore the database. This paper is an in-depth tour of those queries. Readers should first have studied the companion overview paper The SDSS SkyServer – Public Access to the Sloan Digital Sky Server Data [Szalay2]. SDSS SkyServer–Public Access to Sloan Digital Sky Server Data Jim Gray; Alexander Szalay; Ani Thakar; Peter Z. Zunszt; Tanu Malik; Jordan Raddick; Christopher Stoughton; Jan Vandenberg November 2001 11 p.: Word 1.46 Mbytes PDF 456 Kbytes WordPDF The SkyServer provides Internet access to the public Sloan Digital Sky Survey (SDSS) data for both astronomers and for science education. This paper describes the SkyServer goals and architecture. It also describes our experience operating the SkyServer on the Internet. The SDSS data is public and well-documented so it makes a good test platform for research on database algorithms and performance. The World-Wide Telescope Jim Gray; Alexander Szalay August 2001 6 p.: Word 684 Kbytes PDF 84 KbytesWordPDF All astronomy data and literature will soon be online and accessible via the Internet. The community is building the Virtual Observatory, an organization of this worldwide data into a coherent whole that can be accessed by anyone, in any form, from anywhere. The resulting system will dramatically improve our ability to do multi-spectral and temporal studies that integrate data from multiple instruments. The virtual observatory data also provides a wonderful base for teaching astronomy, scientific discovery, and computational science. Designing and Mining Multi-Terabyte Astronomy Archives Robert J. Brunner; Jim Gray; Peter Kunszt; Donald Slutz; Alexander S. Szalay; Ani Thakar June 1999 8 p.: Word (448 Kybtes) PDF (391 Kbytes)WordPDF The next-generation astronomy digital archives will cover most of the sky at fine resolution in many wavelengths, from X-rays, through ultraviolet, optical, and infrared. The archives will be stored at diverse geographical locations. One of the first of these projects, the Sloan Digital Sky Survey (SDSS) is creating a 5-wavelength catalog over 10,000 square degrees of the sky (see http://www.sdss.org/). The 200 million objects in the multi-terabyte database will have mostly numerical attributes in a 100+ dimensional space. Points in this space have highly correlated distributions.http://www.sdss.org/ The archive will enable astronomers to explore the data interactively. Data access will be aided by multidimensional spatial and attribute indices. The data will be partitioned in many ways. Small tag objects consisting of the most popular attributes will accelerate frequent searches. Splitting the data among multiple servers will allow parallel, scalable I/O and parallel data analysis. Hashing techniques will allow efficient clustering, and pair-wise comparison algorithms that should parallelize nicely. Randomly sampled subsets will allow de-bugging otherwise large queries at the desktop. Central servers will operate a data pump to support sweep searches touching most of the data. The anticipated queries will re-quire special operators related to angular distances and complex similarity tests of object properties, like shapes, colors, velocity vectors, or temporal behaviors. These issues pose interesting data management challenges.
 data management needs [Szalay1] by defining twenty database queries and twelve data visualization tasks that a good data management system should support. We built a database and interfaces to support both the query load and also a website for ad-hoc access. This paper reports on the database design, describes the data loading pipeline, and reports on the query implementation and performance. The queries typically translated to a single SQL statement. Most queries run in less than 20 seconds, allowing scientists to interactively explore the database. This paper is an in-depth tour of those queries. Readers should first have studied the companion overview paper The SDSS SkyServer – Public Access to the Sloan Digital Sky Server Data [Szalay2]. SDSS SkyServer–Public Access to Sloan Digital Sky Server Data Jim Gray; Alexander Szalay; Ani Thakar; Peter Z. Zunszt; Tanu Malik; Jordan Raddick; Christopher Stoughton; Jan Vandenberg November p.: Word 1.46 Mbytes PDF 456 Kbytes WordPDF The SkyServer provides Internet access to the public Sloan Digital Sky Survey (SDSS) data for both astronomers and for science education. This paper describes the SkyServer goals and architecture. It also describes our experience operating the SkyServer on the Internet. The SDSS data is public and well-documented so it makes a good test platform for research on database algorithms and performance. The World-Wide Telescope Jim Gray; Alexander Szalay August p.: Word 684 Kbytes PDF 84 KbytesWordPDF All astronomy data and literature will soon be online and accessible via the Internet. The community is building the Virtual Observatory, an organization of this worldwide data into a coherent whole that can be accessed by anyone, in any form, from anywhere. The resulting system will dramatically improve our ability to do multi-spectral and temporal studies that integrate data from multiple instruments. The virtual observatory data also provides a wonderful base for teaching astronomy, scientific discovery, and computational science. Designing and Mining Multi-Terabyte Astronomy Archives Robert J. Brunner; Jim Gray; Peter Kunszt; Donald Slutz; Alexander S. Szalay; Ani Thakar June p.: Word (448 Kybtes) PDF (391 Kbytes)WordPDF The next-generation astronomy digital archives will cover most of the sky at fine resolution in many wavelengths, from X-rays, through ultraviolet, optical, and infrared. The archives will be stored at diverse geographical locations. One of the first of these projects, the Sloan Digital Sky Survey (SDSS) is creating a 5-wavelength catalog over 10,000 square degrees of the sky (see The 200 million objects in the multi-terabyte database will have mostly numerical attributes in a 100+ dimensional space. Points in this space have highly correlated distributions. The archive will enable astronomers to explore the data interactively. Data access will be aided by multidimensional spatial and attribute indices. The data will be partitioned in many ways. Small tag objects consisting of the most popular attributes will accelerate frequent searches. Splitting the data among multiple servers will allow parallel, scalable I/O and parallel data analysis. Hashing techniques will allow efficient clustering, and pair-wise comparison algorithms that should parallelize nicely. Randomly sampled subsets will allow de-bugging otherwise large queries at the desktop. Central servers will operate a data pump to support sweep searches touching most of the data. The anticipated queries will re-quire special operators related to angular distances and complex similarity tests of object properties, like shapes, colors, velocity vectors, or temporal behaviors. These issues pose interesting data management challenges..")
Similar presentations


>")
