Download presentation
Presentation is loading. Please wait.

1
Air Quality Impact Analysis 1.Establish a relationship between emissions and air quality. AQ past = a EM past + b 2.A change in emissions results in an air quality impact. AQ future = a EM future + b 3.However, for some pollutants, air quality is a complicated function of meteorology and chemistry.

2
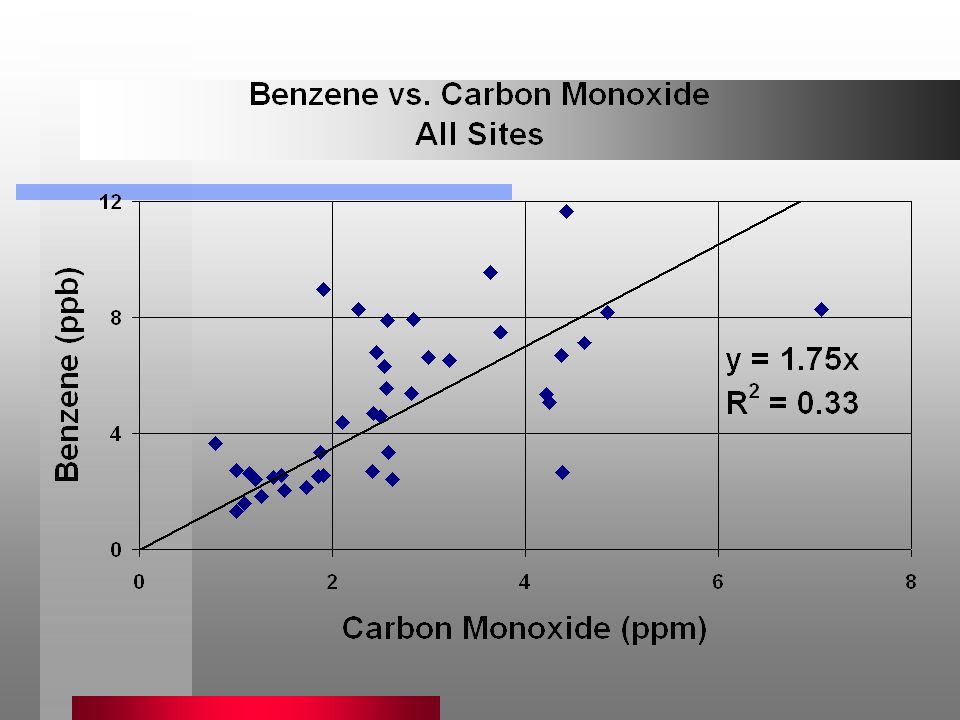
Case 1: No Chemistry, Widespread Source Use Linear Rollback Pollutants –CO –Diesel particulate matter –Benzene - reacts very slowly

3
Case 2: No Chemistry, Variety of Sources Use Chemical Mass Balance Model –Trace metals identify source contributions for organic carbon and elemental carbon Use Meteorological Analyses –Identify source areas for dust, organic carbon, and elemental carbon

4
Bakersfield PM Sources 0% 20% 40% 60% 80% 100% Fraction (%) Unexplained Nitrate Sulfate Construction Primary Crude Oil Vegetative Burning Primary MV Geological PM 10 PM 2.5 PM 10 Annual24-Hour
 Unexplained Nitrate Sulfate Construction Primary Crude Oil Vegetative Burning Primary MV Geological PM 10 PM 2.5 PM 10 Annual24-Hour")
5
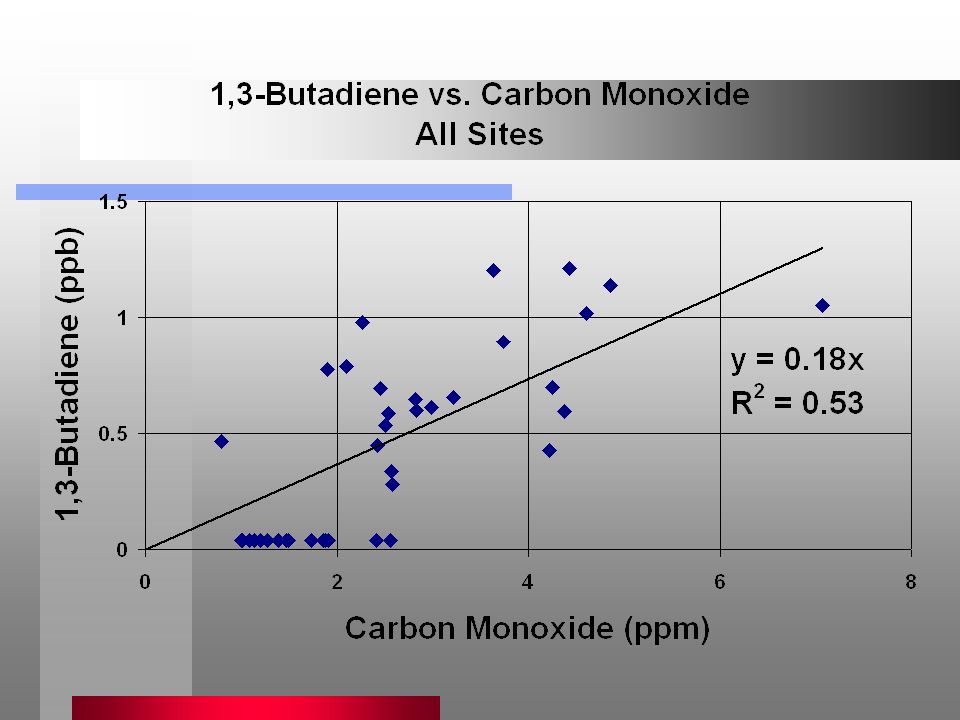
Case 3: Linear Chemistry, Single Precursor Verify Linear Rollback –Trace metals identify source contributions –Meteorological analyses identify source areas Pollutants –Nitrates - correlate to NO X, assume sufficient NH 3 –Sulfates - correlate to SO X, assume sufficient oxidant –Secondary organic carbon - estimate with conversion factors for aromatics and high- weight alkanes –1,3-Butadiene -check for loss rate proportional to O 3 –HCHO, CH 3 CHO - compare to O 3 for chemical formation estimate –NO 2 - correlate to NO X

6
California NO 2 and NO X

7
Trends for Los Angeles Annual Top30 Mean

8
Trends for Bakersfield Annual Top30 Mean

9
Case 4: Complex Chemistry, Several Precursors PM2.5 –Includes combustion and chemical formation products –PM2.5 nitrates + sulfates + OC + EC + SOC PM10 –Includes fine and coarse particles –PM10 PM2.5 + dust Observation-Based Techniques for O 3 –Extent of reaction –Ratio of O 3 to NO X –NO X concentration

10
Preparatory Tasks Data Quality Review –Site visits –Graphical analysis –Statistical analysis Emission Inventory Reconciliation –Ambient ratio analysis –VOC speciation evaluation

11
Project Overview A Study on Changes in Specifications for Gasoline and Diesel Fuels in Thailand Daedalus LLC/ERM Siam

12
Task 4 - Air Quality Analysis Air Toxics PM10 and PM2.5 Ozone Carbon Monoxide Nitrogen Dioxide

13
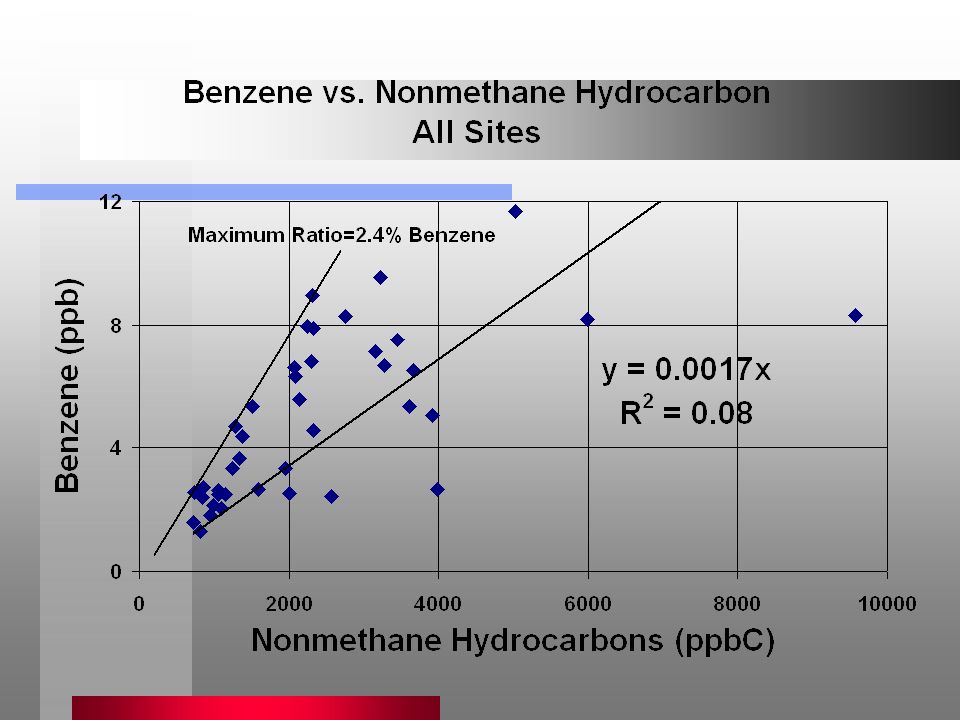
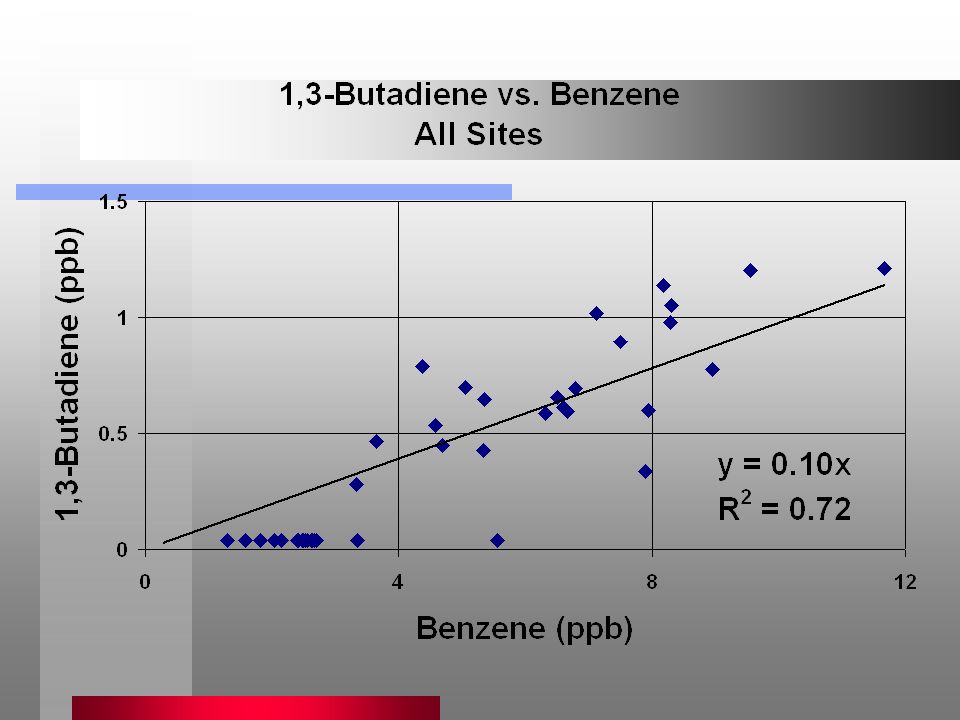
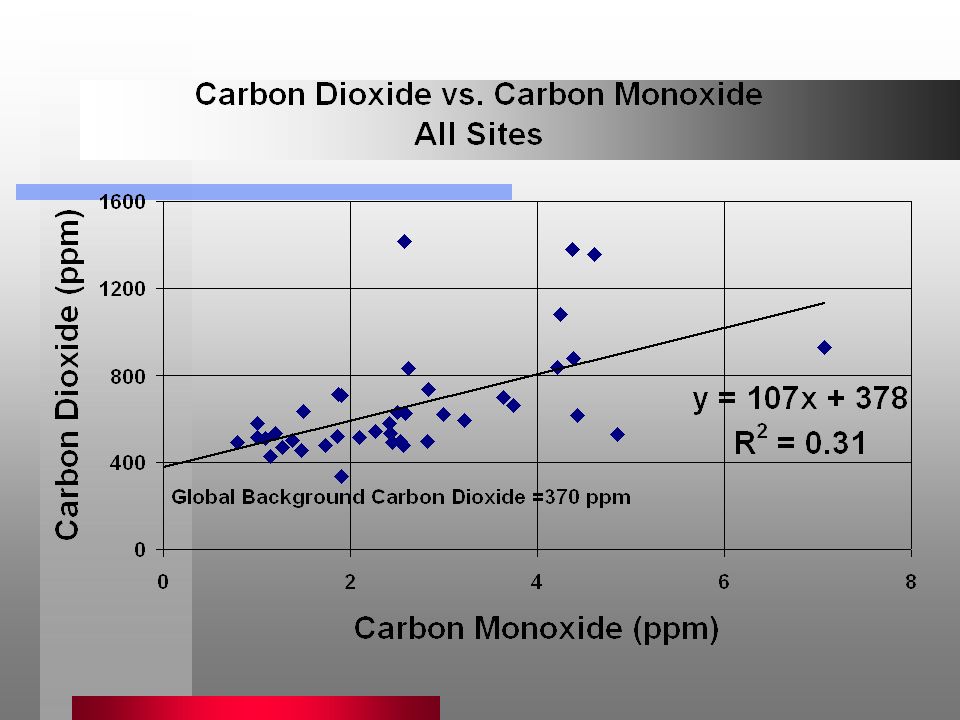
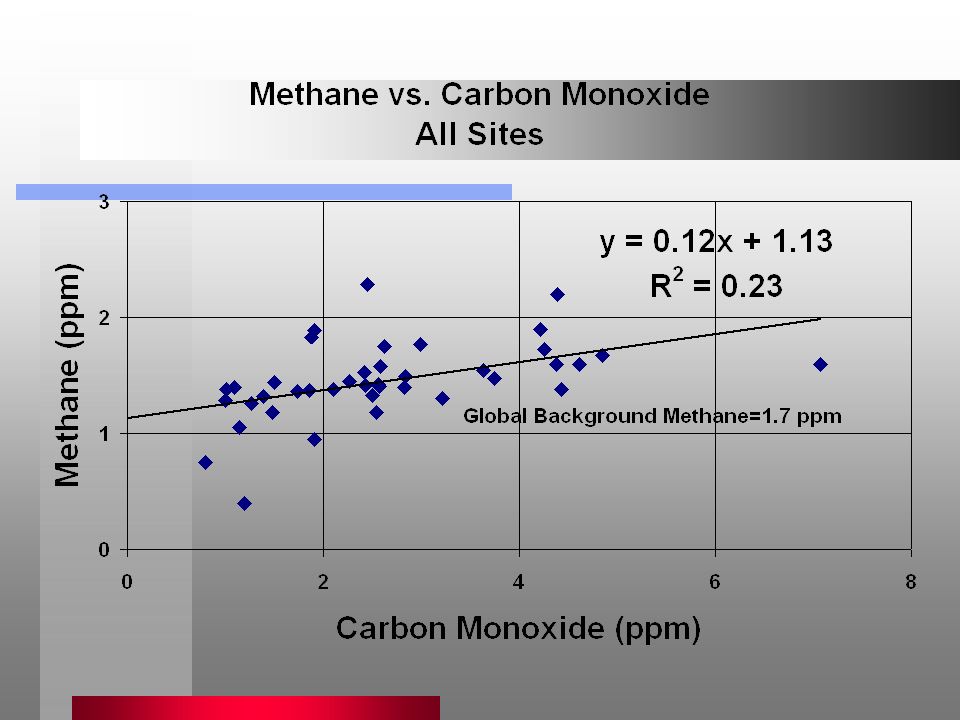
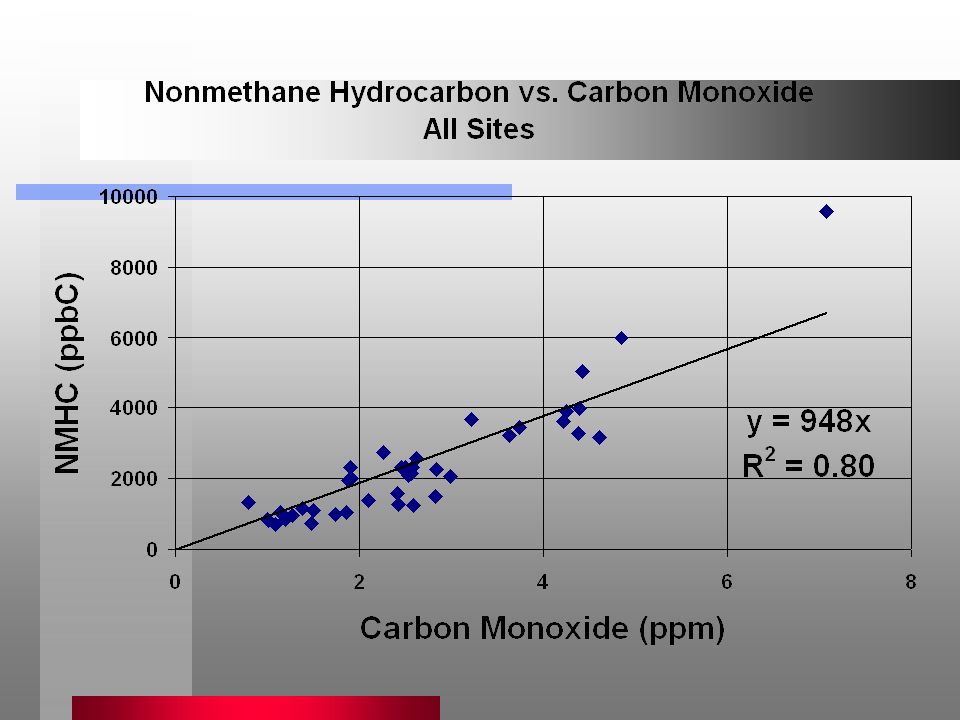
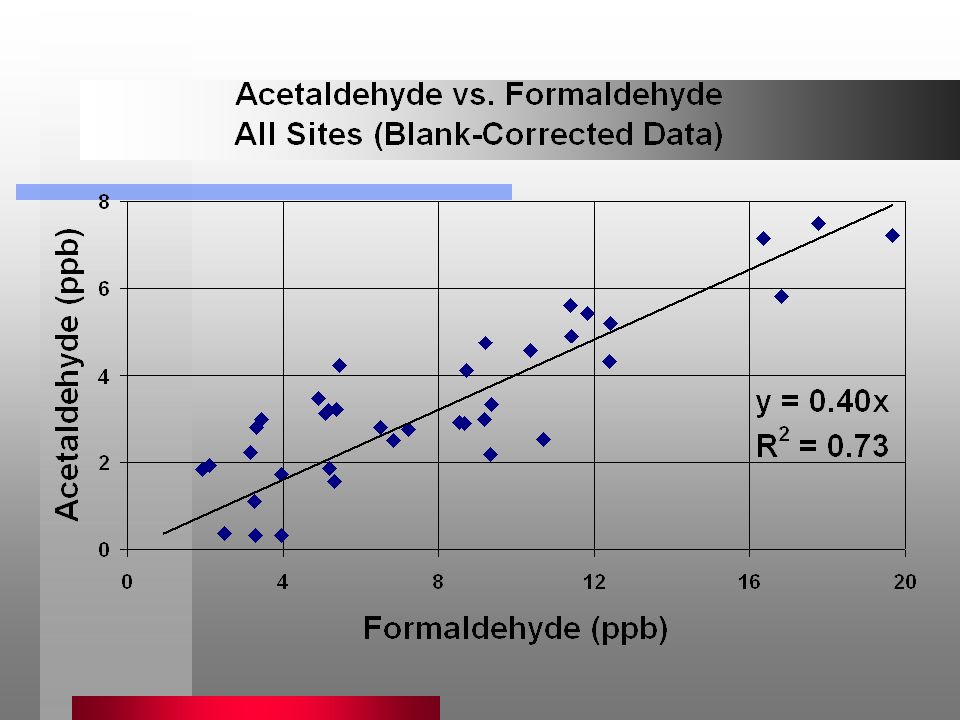
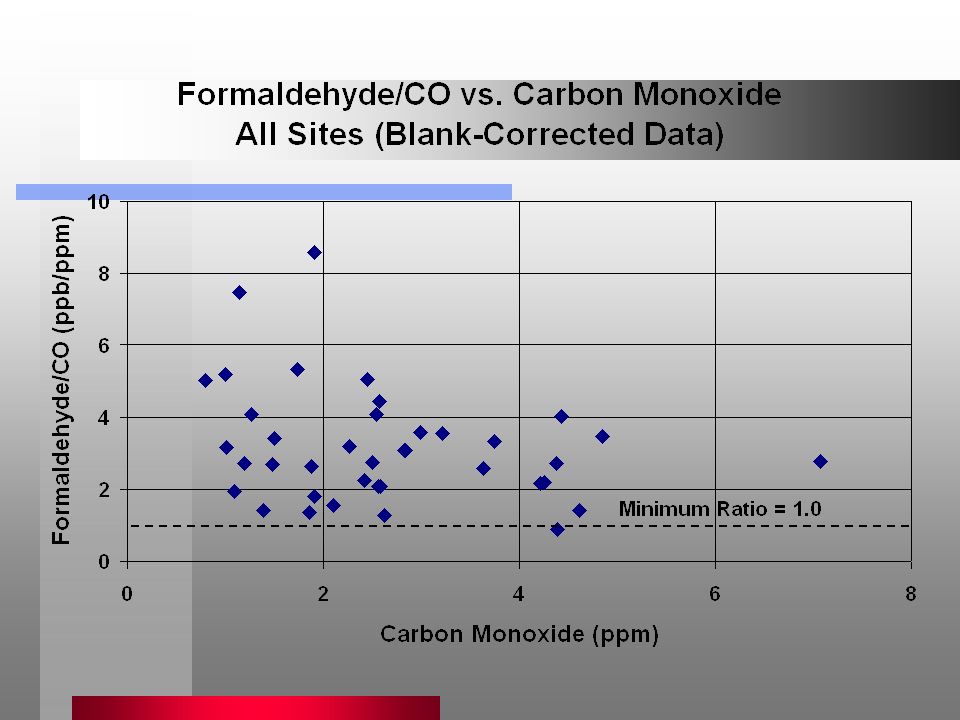
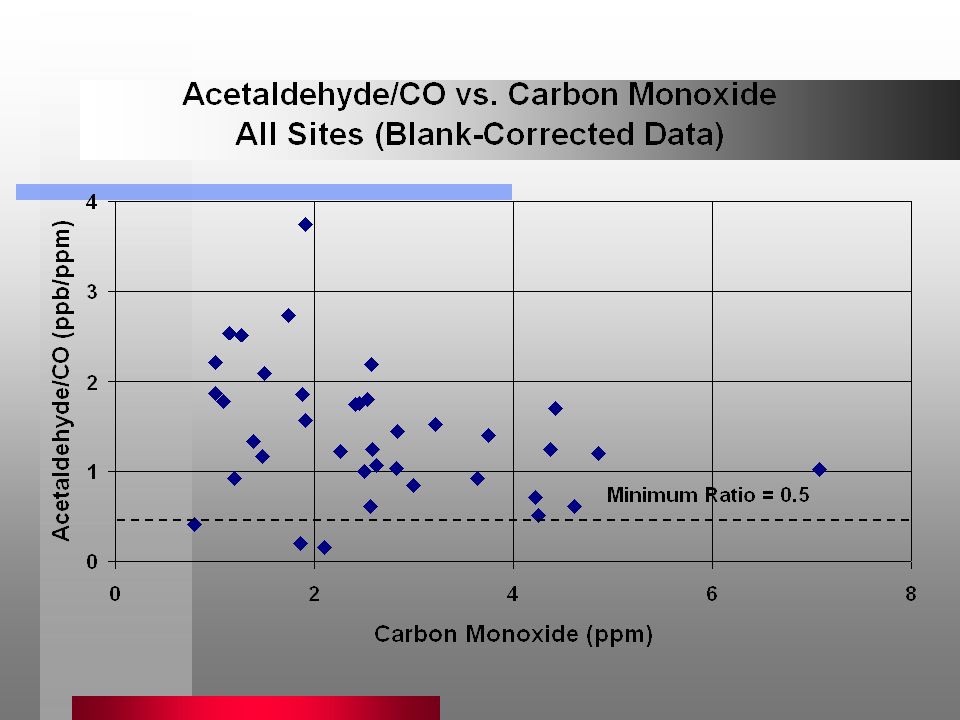
Task 4 - Air Toxics (Methods) PTT Data Collection –3 sites, 40 samples –December 1999 and January 2000 –benzene, 1,3-butadiene –formaldehyde, acetaldehyde –CO, CO 2, CH 4, TNMHC Correlate air toxics with CO Estimate diesel PM from PM10
 PTT Data Collection –3 sites, 40 samples –December 1999 and January 2000 –benzene, 1,3-butadiene –formaldehyde, acetaldehyde –CO, CO 2, CH 4, TNMHC Correlate air toxics with CO Estimate diesel PM from PM10")
14
Task 4 - Air Toxics (Methods) Calculate 1998 concentrations –PCD 1997-98 CO and PM10 data –Sites with 75% data capture Estimate 2005 and 2010 levels –Project mobile source NMHC emissions –Project diesel PM10 emissions Calculate cancer risk –California unit risk factors
 Calculate 1998 concentrations –PCD CO and PM10 data –Sites with 75% data capture Estimate 2005 and 2010 levels –Project mobile source NMHC emissions –Project diesel PM10 emissions Calculate cancer risk –California unit risk factors")
25
Task 4 - Annual Concentrations

26
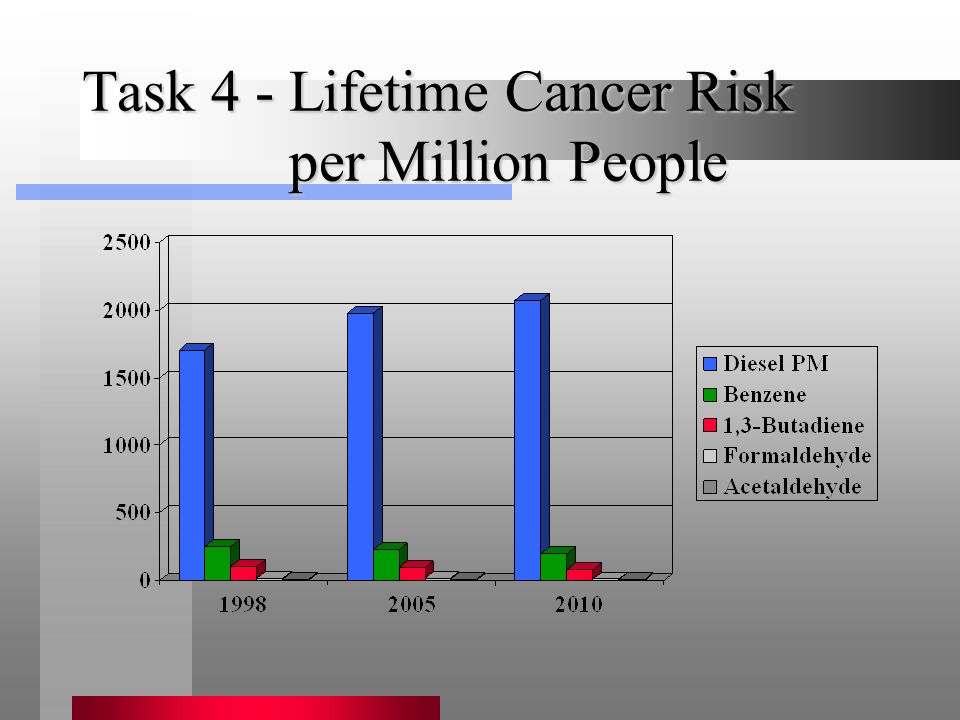
Task 4 - Lifetime Cancer Risk per Million People

28
Task 4 - Air Toxics (Remaining) Obtain PCD data –Compare to PTT CO, CH 4, and NMHC data as a quality check –Determine if air toxics correlate better with NO X and PM10 –Include secondary formation of aldehydes Discuss analysis with PTT and PCD –Character of Nonsi site –Resolve 1,3-butadiene issues
 Obtain PCD data –Compare to PTT CO, CH 4, and NMHC data as a quality check –Determine if air toxics correlate better with NO X and PM10 –Include secondary formation of aldehydes Discuss analysis with PTT and PCD –Character of Nonsi site –Resolve 1,3-butadiene issues")
29
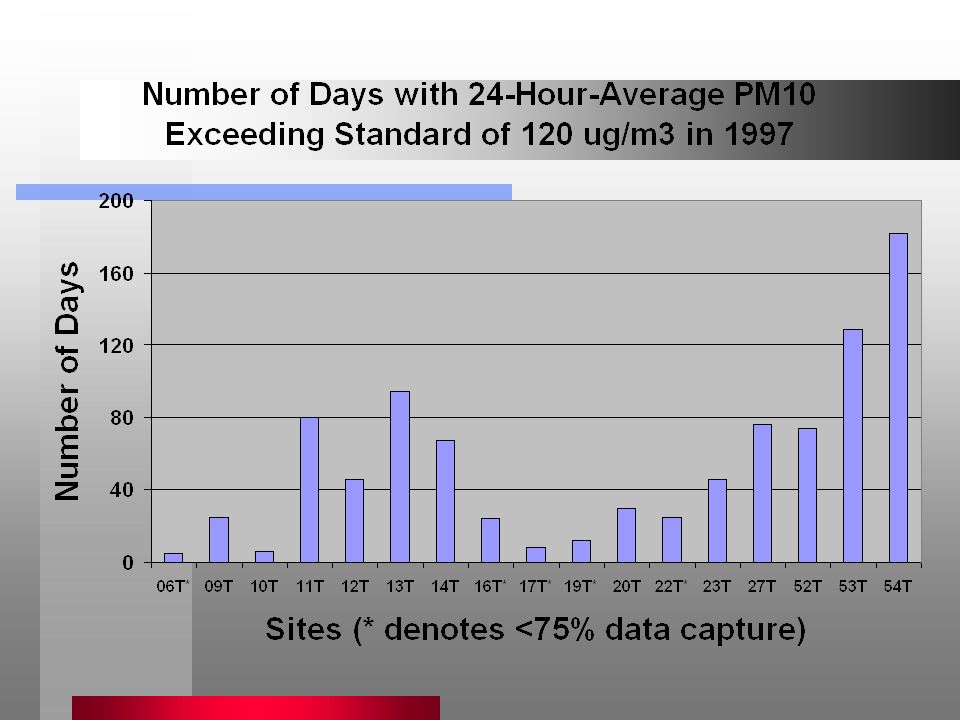
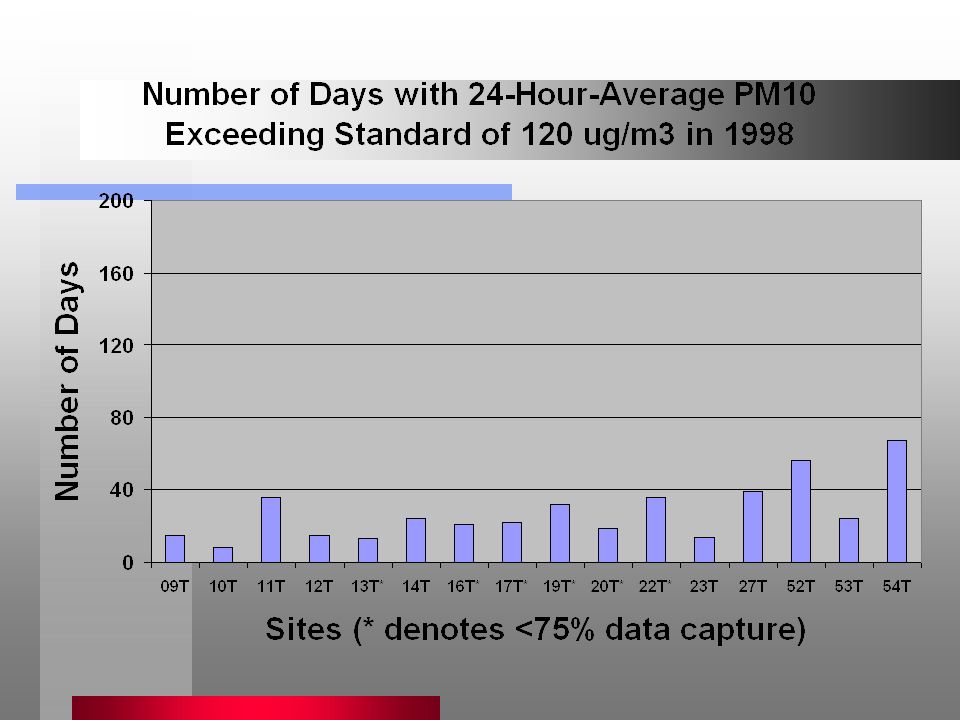
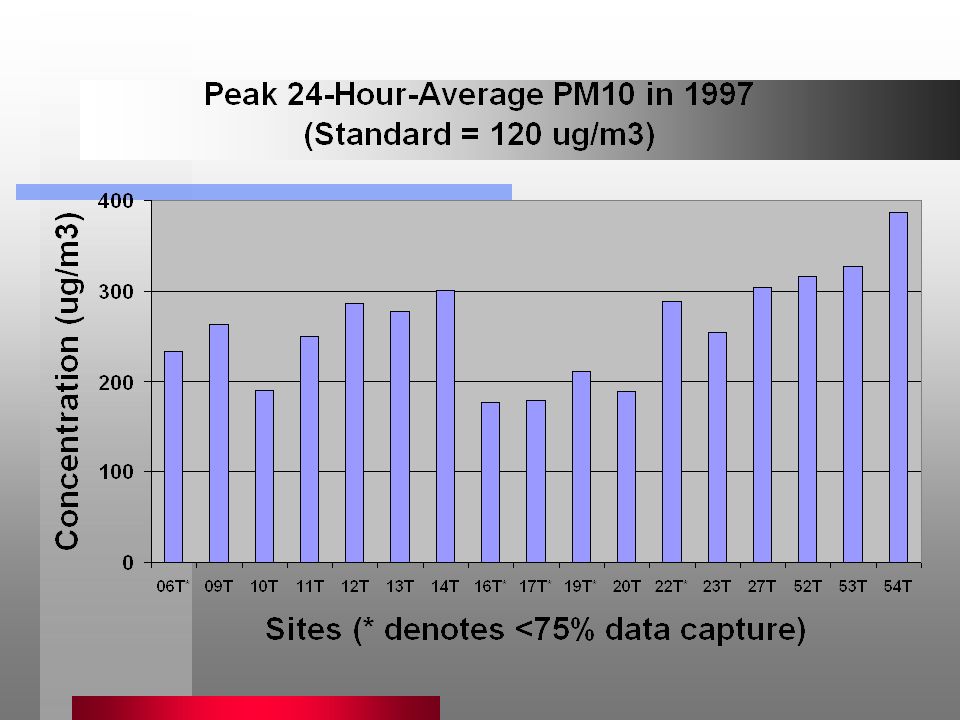
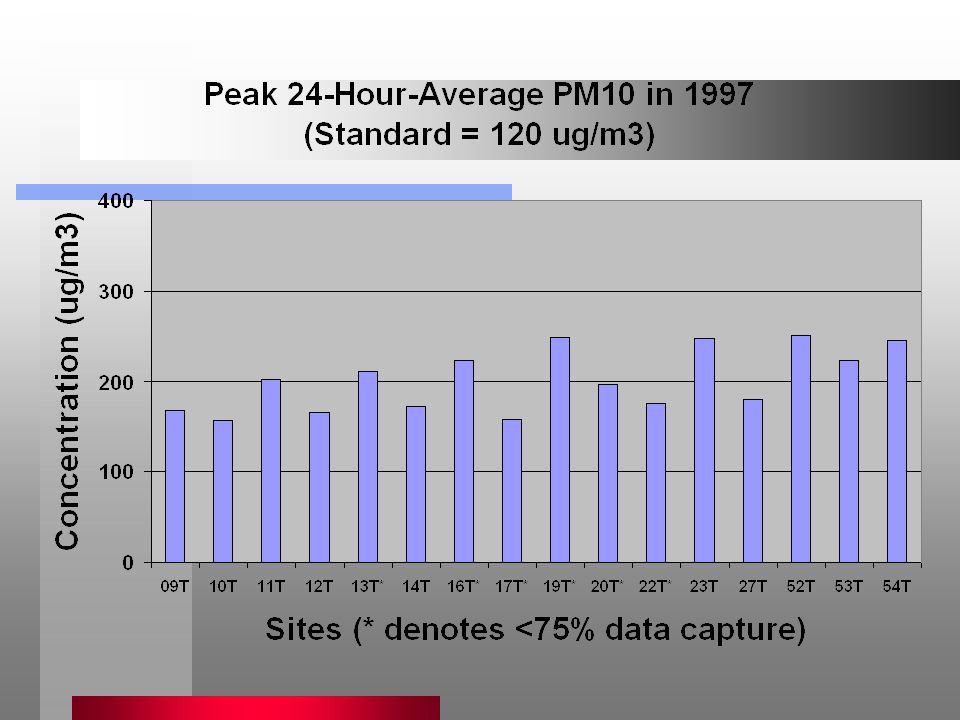
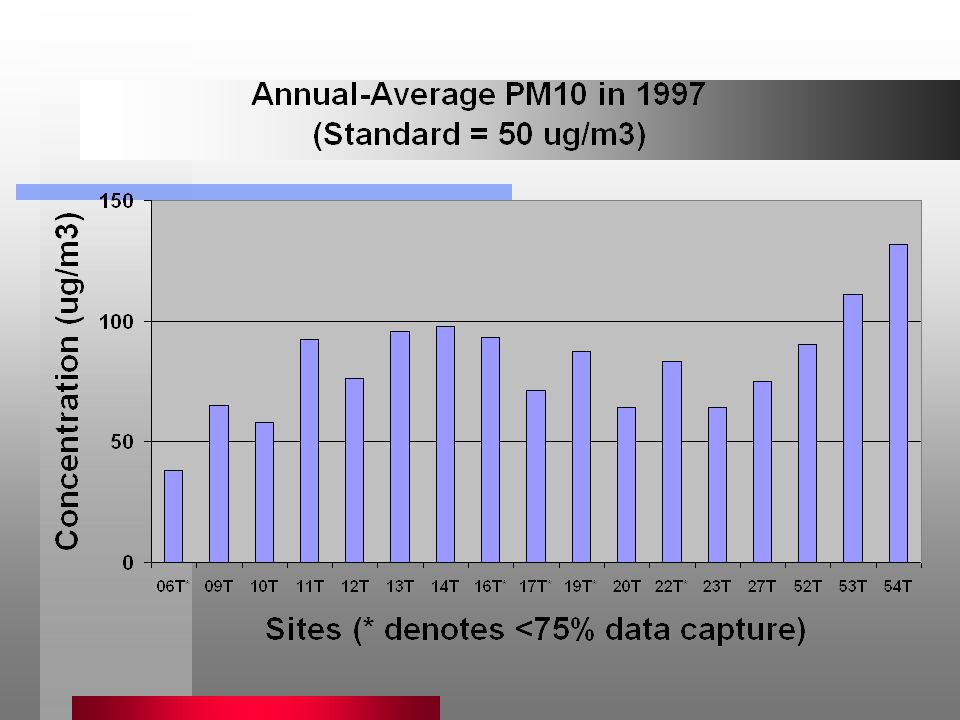
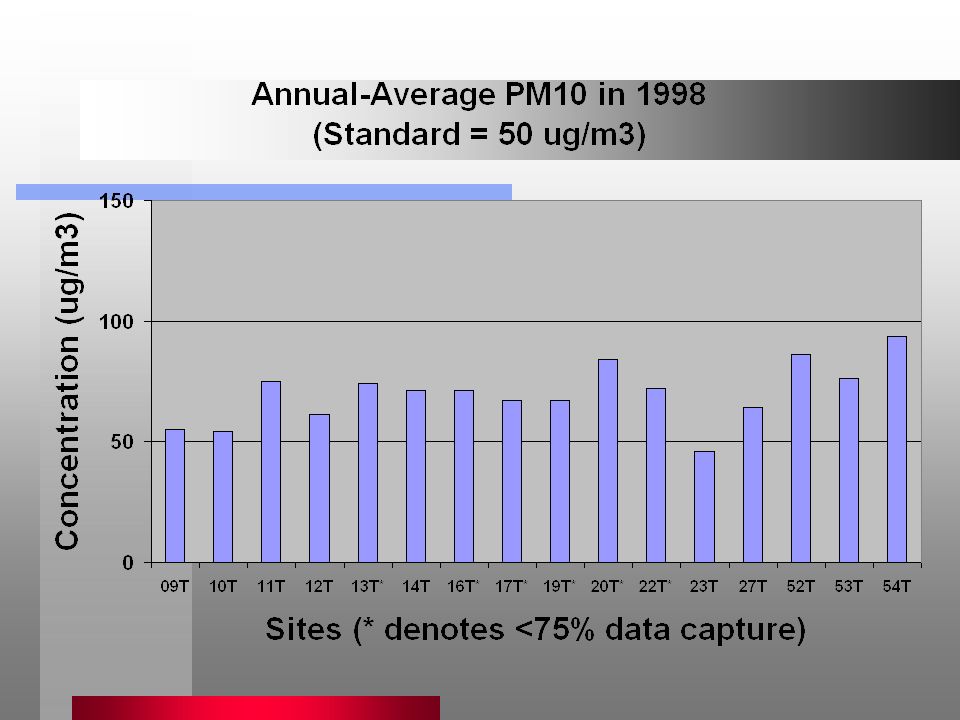
Task 4 - PM (Methods) PCD Data Collection –16 permanent sites with hourly PM10 data in 1997 and 1998 –Filter-based PM10 and TSP not provided Summarize 24-hr and annual averages Examine PM10 relationships with air quality and meteorological data Estimate 2005 and 2010 levels –Rollback from 1998 using emissions
 PCD Data Collection –16 permanent sites with hourly PM10 data in 1997 and 1998 –Filter-based PM10 and TSP not provided Summarize 24-hr and annual averages Examine PM10 relationships with air quality and meteorological data Estimate 2005 and 2010 levels –Rollback from 1998 using emissions")
36
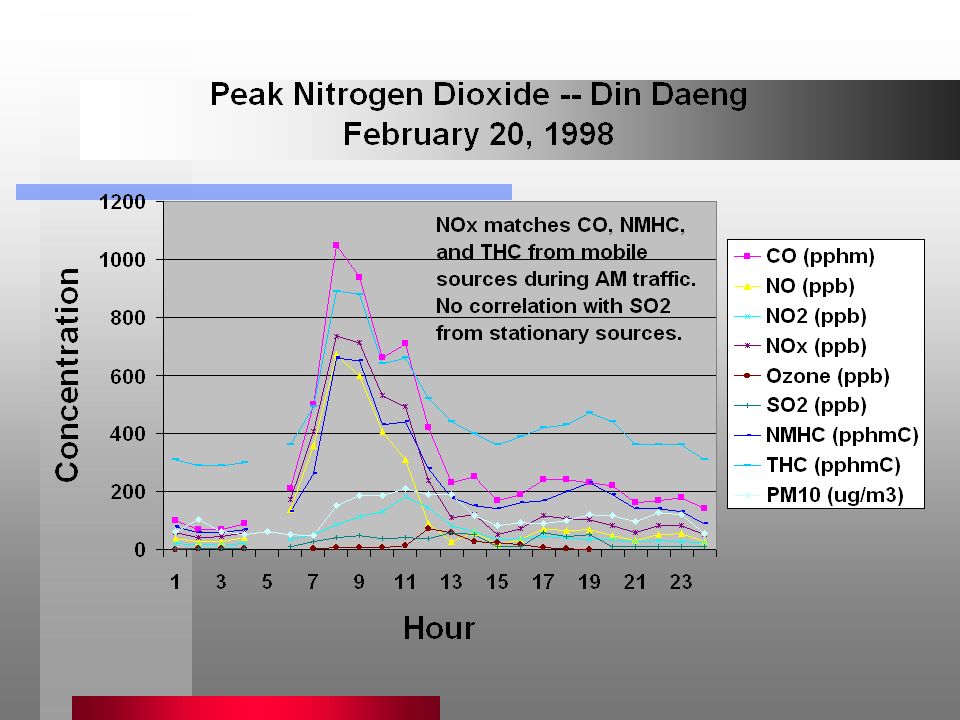
Task 4 - PM (Results) Large reduction from 1997 to 1998 –All sites, both averaging times Annual-average PM ratios –PM10:TSP = 0.3 to 0.6 (4 sites) –PM2.5:PM10 = 0.5 (2 sites) Din Daeng (54T) is peak site –Strong association with CO and NO X –Weak with NMHC and SO 2 –None with O 3 and meteorology
 Large reduction from 1997 to 1998 –All sites, both averaging times Annual-average PM ratios –PM10:TSP = 0.3 to 0.6 (4 sites) –PM2.5:PM10 = 0.5 (2 sites) Din Daeng (54T) is peak site –Strong association with CO and NO X –Weak with NMHC and SO 2 –None with O 3 and meteorology")
37
Task 4 - PM (Results) High PM associated with mobile sources, diesel in particular PM2.5 and PM10 levels exceed all Thai and U.S. standards Ostro et al. found 10 g/m 3 in daily Bangkok PM10 associated with –1-2% increase in natural mortality –1-2% increase in cardiovascular mortality –3-6% increase in respiratory mortality

38
Task 4 - PM (Results) PM2.5 and PM10 levels likely to be higher in 2005 and 2010 –Mobile source diesel PM emissions increase 16% from 1998 to 2005 22% from 1998 to 2010 –Mobile source NO X emissions increase 26% from 1998 to 2005 40% from 1998 to 2010
 PM2.5 and PM10 levels likely to be higher in 2005 and 2010 –Mobile source diesel PM emissions increase 16% from 1998 to % from 1998 to 2010 –Mobile source NO X emissions increase 26% from 1998 to % from 1998 to 2010")
39
Task 4 - PM (Remaining) Discuss analysis with PCD –Obtain hi-vol PM10 and TSP data –Compare hi-vol and BAM PM10 data as a quality check –Determine causes of large PM10 reduction from 1997 to 1998 Compare 1997 air quality and meteorological data to 1998
 Discuss analysis with PCD –Obtain hi-vol PM10 and TSP data –Compare hi-vol and BAM PM10 data as a quality check –Determine causes of large PM10 reduction from 1997 to 1998 Compare 1997 air quality and meteorological data to 1998")
40
Task 4 - CO and NO 2 (Methods) PCD Data Collection –14 permanent sites with CO and NO 2 –1997 and 1998 data most complete Verify NO 2 correlation to CO and NO X Estimate 2005 and 2010 levels –Rollback from 1998 using emissions –Project mobile source CO and NO X emissions
 PCD Data Collection –14 permanent sites with CO and NO 2 –1997 and 1998 data most complete Verify NO 2 correlation to CO and NO X Estimate 2005 and 2010 levels –Rollback from 1998 using emissions –Project mobile source CO and NO X emissions")
42
Task 4 - CO and NO 2 (Results)
")
43
Task 4 - CO and NO 2 (Remaining) Discuss analysis with PCD –Confirm that no 1998 data from Junkasame (highest CO in 1996) are available
 Discuss analysis with PCD –Confirm that no 1998 data from Junkasame (highest CO in 1996) are available")
44
Task 4 -Conclusions Air Toxics –PTT data provides a good first estimate of gaseous air toxic levels in Bangkok –Diesel PM is the major contributor to cancer risk –Benzene and 1,3-butadiene are also significant contributors –Formaldehyde and acetaldehyde are minor factors, but secondary formation still needs to be included

45
Task 4 -Conclusions Particulate Matter –Many days over Thai and U.S. standards for PM2.5 and PM10 –High PM levels related to mobile sources (direct emissions and/or road dust) –PM strongly associated with mortality –Large decrease from 1997 to 1998 may indicate effect of economic crisis
 –PM strongly associated with mortality –Large decrease from 1997 to 1998 may indicate effect of economic crisis.")
46
Task 4 -Conclusions Carbon Monoxide –Likely to attain 1-hour and 8-hour standards with existing controls Nitrogen Dioxide –Only one violation of standard in 1998 –Peaks driven by mobile source, rather than stationary source, NO X emissions –Peak levels likely to increase in future

Similar presentations

 Russell 1 1 School.>")


