Download presentation
Presentation is loading. Please wait.

1
1,5 Anhydroglucitol and the Monitoring of Postprandial Glucose Control Steven D Wittlin M.D. U of Rochester School of Medicine and Dentistry

2
Importance of Post- Prandial Hyperglycemia

3
The Growing Epidemic of Diabetes

4
Diabetes is Not Well- Controlled Data from NHANES and DCCT

5
Duration of daily metabolic conditions Breakfast Lunch Dinner0:00 am4:00 amBreakfast Postprandial PostabsorptiveFasting Monnier L. Eur J Clin Invest 2000;30(Suppl. 2):3–11
:3–11.")
6
Relationship between FPG and 2-hr post-challenge PG in type 2 diabetes patients: NHANES III Distribution (%) HbA 1c Fasting plasma glucose <7 mmol/l 7–7.8 mmol/l >7.8 mmol/l <7.8 mmol/l 7.8–11.1 mmol/l >11.1 mmol/l Erlinger TP, Brancati FL. Diabetes Care 2001;24:1734–8 Distribution (%) HbA 1c 2-hr post-load plasma glucose
 HbA 1c 2-hr post-load plasma glucose.")
7
Relationship between HbA1C, FPG and 2-hr post-challenge PG in type 2 diabetes patients: NHANES III Erlinger TP, Brancati FL. Diabetes Care 2001;24:1734–8

8
Correlation between plasma glucose levels after OGTT and standard mixed meal Wolever TMS et al. Diabetes Care 1998;21:336–40 r=0.97

9
Relationship between HbA1C, FPG and 2 h. PPG Van Haeften T et al Metabolism 2000

10
Woerle HJ et al Arch Intern Med. 2004;164:1627-1632. Relative Changes in FPG and 2-h PG as HbA 1c Increases 4567 70 160 250 Plasma Glucose (mg/dL) = HbA 1c versus 2hppg = HbA 1c versus FPG r = 0.55 y = 47.1 x -109 r = 0.48 y = 12.0 x +30 HbA 1c (%)
 = HbA 1c versus 2hppg = HbA 1c versus FPG r = 0.55 y = 47.1 x -109 r = 0.48 y = 12.0 x +30 HbA 1c (%).")
11
Relationship between FPG and 1 st -Phase Insulin Release ( van Haeften T et al Metabolism 2000 )
")
12
Relationship Between Diabetes Status and 1 st Phase Insulin Release ( van Haeften T et al.Metabolism 2000 )
")
13
As Patients Get Closer to A1C Goal, the Need to Successfully Manage PPG Significantly Increases Adapted from Monnier L, Lapinski H, Collette C. Contributions of fasting and postprandial plasnma glucose increments to the overall diurnal hyper glycemia of Type 2 diabetic patients: variations with increasing levels of HBA(1c). Diabetes Care. 2003;26:881-885.
. Diabetes Care. 2003;26:")
14
Post-load Hyperglycemia and The Metabolic Syndrome –0.13 –0.03 0.18 0.07 0.01 0.15 0.01 0.21* Fasting plasma glucose 0.20* 0.25 0.27 0.23* 0.21* 0.24* 0.25* 2-hr plasma glucose C-reactive protein Cellular fibronectin Tissue plasminogen activator (TPA) Free fatty acids Triglycerides Waist: hip ratio Body mass index (BMI) Age Yudkin JS. Lancet 2002;359:166–7 *p<0.05; p<0.01

15
Controlling Postprandial Glucose Prospective trial of fasting vs pc control in 164 pts w/ Type 2 DM Prospective trial of fasting vs pc control in 164 pts w/ Type 2 DM Forced titration to target first FBS < 100 and then, 90 min pc < 140 if not achieved previously Forced titration to target first FBS < 100 and then, 90 min pc < 140 if not achieved previously Results: Results: HbA1C fell from 8.7 % to 6.5% HbA1C fell from 8.7 % to 6.5% Only 64% of patients achieving FPG < 100 only reached HbA1C < 7% Only 64% of patients achieving FPG < 100 only reached HbA1C < 7% 94% of patients w/ pc < 140 reached HbA1C < 7% 94% of patients w/ pc < 140 reached HbA1C < 7% Decreased pc BG accounted nearly twice as much as FBS for fall in HbA1C Decreased pc BG accounted nearly twice as much as FBS for fall in HbA1C If HbA1C < 6.2%, pc accounted for ~ 90% If HbA1C < 6.2%, pc accounted for ~ 90% If HbA1C > 8.9%, pc accounted for ~ 40% If HbA1C > 8.9%, pc accounted for ~ 40% Woerle HJ et al Diabetes Research and Clinical Practice 2007

16
Contribution of Postprandial BG to HbA1C Woerle HJ et al Diabetes Res Clin Pract. 2007 Jan 19

17
Glycemic Excursions Predict Oxidative Stress Monnier L et al JAMA. 2006;295:1681-1687

18
Responses to a Mixed Meal in Diabetic and Non-Diabetic Individuals (Singhal P et al AJP 2002 )
")
19
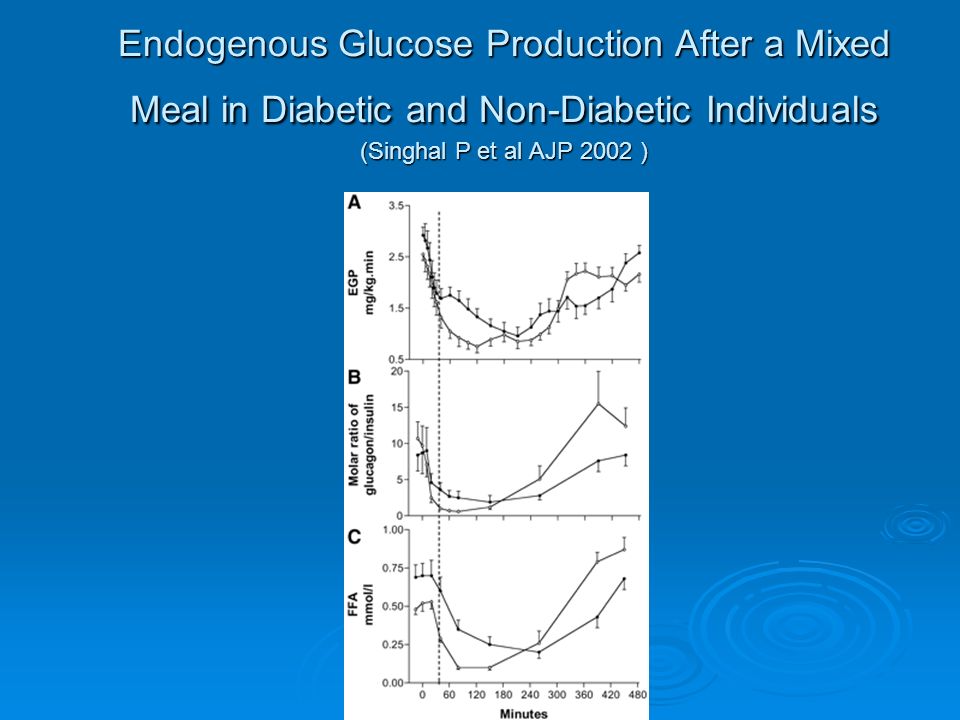
Endogenous Glucose Production After a Mixed Meal in Diabetic and Non-Diabetic Individuals (Singhal P et al AJP 2002 )
")
21
Routes of Post-Prandial Glucose Disposal

22
Post-Prandial Glucose Metabolism : Mechanism Study of 11 normal volunteers after a standard test meal Study of 11 normal volunteers after a standard test meal Triple isotope technique and indirect calorimetry Triple isotope technique and indirect calorimetry Intravenous Intravenous Tritiated GlucoseTritiated Glucose C-14-labelled bicarbonateC-14-labelled bicarbonate Oral Oral Deuterated GlucoseDeuterated Glucose Woerle HJ et al.Am J Physiol Endocrinol Metab 284: E716-E725, 2003

23
Post-Prandial Glucose Disposal ( Woerle Hans J et al AJP Endo Metab 2003 )
")
24
Changes in Postprandial Glucose Metabolism in Type 2 DM Use triple isotope technique and indirect calorimetry Use triple isotope technique and indirect calorimetry DM pts had: DM pts had: increased overall glucose release increased overall glucose release Increased gluconeogenesis and glycogenolysis Increased gluconeogenesis and glycogenolysis ~90% of the increased glucose release occurred in the first 90 min post-prandial ~90% of the increased glucose release occurred in the first 90 min post-prandial In DM glucose clearance and oxidation were reduced In DM glucose clearance and oxidation were reduced Non-oxidative glycolysis was increased Non-oxidative glycolysis was increased Net splanchnic glucose storage was reduced ~ 45% d.t. increased glycogen cycling Net splanchnic glucose storage was reduced ~ 45% d.t. increased glycogen cycling Woerle HJ et al Am J Physiol Endocrinol Metab 2006

25
Effect of Pre- or Post-Meal Exercise on Glycemic Control (Yamanouchi K et al Diab Res & Clin Pract, Oct 2002 )
")
26
The Glycemic Index

27
Physiologial Consequences of a High Glycemic –Index Meal

28
Summary of Studies of Low vs High Glycemic Index Diets

29
Effects of 2h Post-Prandial Glucose +/- Vitamins C +E on Flow-Mediated Dilatation ( Title LM et al JACC Dec 2000 )
")
31
Relative risk for death increases with 2-hour blood glucose irrespective of the FPG level <6.16.1–6.9 7.0 11.1 7.8–11.0 <7.8 Fasting plasma glucose (mmol/l) 2-hour plasma glucose (mmol/l) 2.5 2.0 1.5 1.0 0.5 0.0 Hazard ratio Adjusted for age, center, sex DECODE Study Group. Lancet 1999;354:617–621

35
Effect of Acarbose on CVD in Patients with IGT ( STOP-NIDDM) ( Chiasson J-L et al JAMA July 2003 )
 ( Chiasson J-L et al JAMA July 2003 )")
36
Effect of Acarbose on Development of HBP in Patients with IGT (STOP-NIDDM ) ( Chiasson J-L et al JAMA July 2003 )
 ( Chiasson J-L et al JAMA July 2003 )")
37
Summary Postprandial glycemia plays a clinically important role in the complications of diabetes Postprandial glycemia plays a clinically important role in the complications of diabetes Postprandial glycemia is a major contributor to overall glycemic control ESPECIALLY in moderately-well to well controlled patients Postprandial glycemia is a major contributor to overall glycemic control ESPECIALLY in moderately-well to well controlled patients

38
So How Can We Assess Post-Prandial Glucose Control Clinically ?? Frequent fingersticks Frequent fingersticks HbA1C HbA1C Fructosamine Fructosamine Continuous Glucose Monitoring Systems Continuous Glucose Monitoring Systems Historical Historical Real-time Real-time 1,5 Anhydroglucitol 1,5 Anhydroglucitol

39
So How Can We Assess Post- Prandial Glucose Control Clinically ?? Frequent fingersticks Frequent fingersticks HbA1C HbA1C Fructosamine Fructosamine Continuous Glucose Monitoring Systems Continuous Glucose Monitoring Systems Sensor-Augmented Insulin Pumps Sensor-Augmented Insulin Pumps

40
A New Idea ! 1,5 Anhydroglucitol

41
History of 1,5AG 1888 1,5AG was discovered in plant of Polygala Senega. 1973Presence in human body was reported. 1977Decrease of plasma 1,5AG concentration with uremia and diabetes mellitus was reported. 1979 Blood 1,5AG was determined in Japan. After this, research on relationship between diabetes mellitus and 1,5AG has become active.

42
Blood test measuring 1,5-anhydroglucitol (1,5-AG) 1,5-AG is a monosaccharide (similar to glucose structure) 1/40 of glucose concentration – healthy human blood Primary Source of 1,5-AG – Food Further distributed to skin, muscle, and other tissues/organs Reabsorbed very efficiently through kidney (urinary excretion is 1/20 of total amount in body) Large Body Pool of 1,5-AG (6-7 times > Blood) Not metabolized much in the body (metabolic turnaround rate at least 3 days) 1,5-AG urinary excretion remarkably increases with hyperglycemia!
 1,5-AG is a monosaccharide (similar to glucose structure) 1/40 of glucose concentration – healthy human blood Primary Source of 1,5-AG – Food Further distributed to skin, muscle, and other tissues/organs Reabsorbed very efficiently through kidney (urinary excretion is 1/20 of total amount in body) Large Body Pool of 1,5-AG (6-7 times > Blood) Not metabolized much in the body (metabolic turnaround rate at least 3 days) 1,5-AG urinary excretion remarkably increases with hyperglycemia!")
43
The structure of 1,5-anhydroglucitol (1,5AG) O OH HO OH O HO D-glucose 1,5-anhydro-D-glucitol (1-deoxyglucose)
 O OH HO OH O HO D-glucose 1,5-anhydro-D-glucitol (1-deoxyglucose)")
44
Fully Automated Enzymatic Method for 1,5 AG Assay ( Glycomark ) Fukumura Y et al Clin Chem 1994 HRP=Horseradish peroxidase ; PROD= pyranose oxidase; HTB=3 hydroxyriiodobenzoic acid ; 4AAP= 4 aminoantipyrine
 Fukumura Y et al Clin Chem 1994 HRP=Horseradish peroxidase ; PROD= pyranose oxidase; HTB=3 hydroxyriiodobenzoic acid ; 4AAP= 4 aminoantipyrine")
45
Specificity of Assay The following dont interfere in concentrations up to 10 grams/L : The following dont interfere in concentrations up to 10 grams/L : Sorbitol Sorbitol Mannitol Mannitol Sucrose Sucrose Lactose Lactose Maltose Maltose Fructose Fructose

46
1,5 AG Content of Foodstuffs in Japanese Diet Yamanouchi T et al Am J Physiol 263: E268-E273. 1992

47
1,5 Anhydroglucitol Specimen Requirements

48
Oral Supply 1,5AG (5-10mg/day) Blood stream Tissues Internal Organs (500- 1000 mg) Kidney Urinary excretion (5-10mg/day) Oral Supply 1,5AG (5-10mg/day) Blood Stream (1,5-AG Level Lower) Tissues Internal Organs (500- 1000 mg) Kidney Urinary excretion (INCREASED) A. Normoglycemia B. Hyperglycemia Glucose Blocks Reabsorption Physiology of 1,5-AG Buse JB et al Diab Tech & Ther 2003. 5(3) : 355-363
 :")
49
1,5 AG Kinetics in Humans Yamanouchi T et al Am J Physiol 263: E268-E273. 1992

50
Urinary Excretion of Glucose and 1,5 AG Fluctuate in Parallel in Rats Yamanouchi T et al Am J Physio 1990. 258: E423-E427

51
Urinary Excretion of Glucose and 1,5 AG Fluctuate in Parallel in Rats Yamanouchi T et al Am J Physio 1990. 258: E423-E427

52
But…1,5 AG Does Not Fluctuate with Variations in Plasma BG in Nephrectomized Rats !! Yamanouchi T et al Am J Physio 1990. 258: E423-E427

53
Fructose, Mannose and 1,5 AG Share A Common Transport Mechanism Yamanouchi T et al Biochim et Bipophys Acta 1996. 1291: 89-95

54
Fructose, Mannose and 1,5 AG Share A Common Transport Mechanism Yamanouchi T et al Biochim et Bipophys Acta 1996. 1291: 89-95

55
Renal Tubular Absorption of Glucose and 1,5 AG Normal Glucose active transporter Fructose, mannose active transporter Glucose 1,5AG Filtration at glomerulus Reabsorption at renal tubule urine

56
Renal Tubular Absorption of Glucose and 1,5 AG Hyperglycemia Glucose active transporter Fructose, mannose active transporter Glucose 1,5AG Filtration at glomerulus Reabsorption at renal tubule urine

57
Renal Tubular Absorption of Glucose and 1,5 AG Stickle D and Turk J. Am J Physiol Endocrinol Metab 273: E821-E830, 1997

58
Linearity of 1,5 AG Assay Nowatzke W et al Clin Chim Acta 2004

59
Recovery Time of 1,5 AG in Treated Patients with Type 2 DM Yamanouchi T et al Jpn. J. Clin. Med. 47: 2472-2476, 1989

60
Histograms of serum 1,5AG concentrations in Japanese healthy subjects 10 20 30 40 50 1,5AG (µg/mL) 26.6±7.2 Male (n=332) 0 10 20 30 40 50 Frequency 21.5±6.0 Female (n=207) 0 10 20 30 40 50 Frequency 10 20 30 40 50 1,5AG (µg/mL) 24.6±7.2 Male and Female (n=539) 0 10 20 30 40 50 60 70 Frequency 10 20 30 40 50 1,5AG (µg/mL)
 26.6±7.2 Male (n=332) Frequency 21.5±6.0 Female (n=207) Frequency ,5AG (µg/mL) 24.6±7.2 Male and Female (n=539) Frequency ,5AG (µg/mL)")
61
Distribution of 1,5 AG in a Healthy US Population Nowatzke W et al Clin Chim Acta 2004

62
The mean 1,5AG levels in healthy subjects during 2 years (n=245) mean±SD
 mean±SD")
63
Diurnal change of plasma glucose and 1,5AG : healthy :IGT Others: diabetes B: breakfast L: lunch D: dinner BLD

64
Histogram of serum 1,5AG concentrations Healthy (n=539) 24.6±7.2 µg/mL Diabetes (n=808) 7.3±7.1 µg/mL 010 2030 4050 Serum 1,5AG (µg/mL)
 24.6±7.2 µg/mL Diabetes (n=808) 7.3±7.1 µg/mL Serum 1,5AG (µg/mL)")
65
Serum 1,5AG levels in healthy subjects, Impaired- glucose-tolerance, diabetes mellitus, and various other disorders 0 10 20 30 40 1,5AG (µg/mL) Healthy subjects (n=539) IGT (n=451) DM (n=808) Non-DM (n=238) P<0.001 Yamanouchi T et al Diabetes 1991; 40: 52-57
 Healthy subjects (n=539) IGT (n=451) DM (n=808) Non-DM (n=238) P<0.001 Yamanouchi T et al Diabetes 1991; 40: 52-57")
66
1,5AG Index 1,5AG x UG = 16 30 10 20 0 1, 5AG x UG 0 42 6 10 8 12 Plasma 1,5AG (µg/mL) N =47 Log y = -0.97 log x + 2.71 R = -0.890 (P < 0.0001) Plasma 1,5AG (µg/mL) 14.0 4.0 2.0 0.0 8.0 6.0 12.0 10.0 Urinary glucoses (g/day) 1 10100
 N =47 Log y = log x R = (P < ) Plasma 1,5AG (µg/mL) Urinary glucoses (g/day)")
67
1,5-AG Physiology Implication Because 1,5-AG levels fluctuate according to glucosuria, the response is much more rapid than glycemic markers based on the glycation process (A1C). Responds Rapidly and Sensitively to Glycemic Changes

68
Correlation between glycemic control markers and past fasting plasma glucose (FPG) Distribution of 1,5AG to FPG shows hyperbolic dispersion different from HbA 1C and fructosamine. Therefore, Spearman's rank correlation coefficient is used here to make comparison between groups. Measurement point of FPG 1, 5AGHbA 1C Fructosamine same time 1 week ago 2 weeks ago 3 weeks ago 4 weeks ago r = -0.88 r = -0.84 r = -0.80 r = -0.71 r = -0.58 r = 0.27 r = 0.53 r = 0.81 r = 0.51 r = 0.72 r = 0.80 r = 0.73 r = 0.54 2 months ago 3 months ago r = -0.39r = 0.73 r = 0.65

69
Glycemic control markers 1,5A G Fructosamine 108975643 1 2 0 HbA 1C Blood glucose Weeks before measurement

70
0 Renal excretion of glucose (g/day) Plasma glucose (mg/dL) 300 200 100 300 400 200 2 1 3 54 6 798 1010 121113 Weeks Changes in various glycemic control markers in NIDDM patient with poorly controlled glycemia after starting insulin treatment HbA 1C (%) Plasma 1,5AG (µg/mL) 20 1010 10 15 5 510 Lente 12u 8 6
 Plasma glucose (mg/dL) Weeks Changes in various glycemic control markers in NIDDM patient with poorly controlled glycemia after starting insulin treatment HbA 1C (%) Plasma 1,5AG (µg/mL) Lente 12u 8 6")
71
Clinical Parameters for 1,5 AG 1,5-AG serum concentrations in normal humans vary widely (10-40 ug/ml) Little change day to day because of large body pool relative to daily intake and metabolic inertness Few normal subjects show an alteration in 1,5-AG level in the normal range during 2-3 years When hyperglycemia occurs (glucosuria), 1,5-AG serum levels fall rapidly (1-2 days) Individual variance in renal threshold does not appear to seriously influence clinical utility of 1,5-AG (glucose fluctuates more widely than individual renal threshold variance) Exception – Gestational Diabetes
 Little change day to day because of large body pool relative to daily intake and metabolic inertness Few normal subjects show an alteration in 1,5-AG level in the normal range during 2-3 years When hyperglycemia occurs (glucosuria), 1,5-AG serum levels fall rapidly (1-2 days) Individual variance in renal threshold does not appear to seriously influence clinical utility of 1,5-AG (glucose fluctuates more widely than individual renal threshold variance) Exception – Gestational Diabetes")
72
Post-load glucose measurements in OGTTs correlate well with 1,5-AG in subjects with IGT R=- 0.824 R=0.281 1,5 Anhydroglucitol is a better indicator than A1C of postprandial blood glucose levels in IGT subjects N = 211 Yamanouchi T et al., Clinical Science 2001

73
Correlation between 1,5AG and HbA 1c Cut-off value HbA 1c (Normal range 4.8-5.8%) 1,5AG (µg/mL) 5 6 7 8 9 10 11 12 (%) 15 10 5
 1,5AG (µg/mL) (%)")
74
10304020 50 60 90 80 70 Weeks Mean plasma glucose (mg/dL) 300 200 100 0 0 16 12 14 6 10 8 4 2 8 5 6 4 3 0 2 1 1,5AG (µg/mL) HbA 1C (%) 7 1,5AG, HbA1C, and mean plasma glucose values during a 92-weeks period in a patient with Type 1 DM
 ,5AG (µg/mL) HbA 1C (%) 7 1,5AG, HbA1C, and mean plasma glucose values during a 92-weeks period in a patient with Type 1 DM")
75
Changes of 1,5AG and HbA1C values during a 13- months period in a patient with Type 2 DM

76
Glycemic control in Type 2 DM patients before and after the study treatment Before after

77
Measurement of 1,5AG and HbA1c between October and April, around the new year, in 17 patients with Type 2 DM

78
1,5AG, HbA 1c, and FPG levels in NIDDM patients, well controlled with diet, OHA, CIT or MIT Diet OHA CIT MIT Mean±SE Fasting Plasma Glucose (mg/dL) HbA 1c (%) 1,5AG (µg/mL) 20 0 15 0 10 0 50 0 10 8 6 4 2 010 8 6 4 2 0 20 15 10 5 0 * * *p<0.05:Diet vs. OHA and MIT **p<0.05:CIT vs. OHA and MIT OHA: oral hypoglycemic agents therapy CIT: conventional insulin therapy MIT: multiple insulin therapy

79
GlycoMark Evaluates Daily Glycemic Excursions in Moderately-Well Controlled Patients HbA1c showed no significant differences among all groups *Plasma 1,5-AG in diet group significantly higher than OHA and MIT groups (P<0.05) **Plasma 1,5-AG in CIT significantly lower than diet, OHA, and MIT groups (P<0.05) N = 76 well-controlled type 2 diabetes patients OHA=oral hypoglycemic agents, CIT=Conventional Insulin Therapy, MIT=Multiple Insulin Injection Therapy 6.9 11.5 Kishimoto et al.Diabetes Care 1995)
 **Plasma 1,5-AG in CIT significantly lower than diet, OHA, and MIT groups (P<0.05) N = 76 well-controlled type 2 diabetes patients OHA=oral hypoglycemic agents, CIT=Conventional Insulin Therapy, MIT=Multiple Insulin Injection Therapy Kishimoto et al.Diabetes Care 1995)")
80
Objective: Monitor glycemic control following changes in antidiabetic medication Objective: Monitor glycemic control following changes in antidiabetic medication 56 type 2 diabetic patients treated with oral hypoglycemic agents for 4 weeks 56 type 2 diabetic patients treated with oral hypoglycemic agents for 4 weeks After 4 weeks, treatment discontinued in half of patients and monitored for 2 more weeks After 4 weeks, treatment discontinued in half of patients and monitored for 2 more weeks 1,5-AG, Glucose, A1C, and Fructosamine were measured 1,5-AG, Glucose, A1C, and Fructosamine were measured Clinical usefulness of serum 1,5-AG in monitoring glycemic control Yamanouchi T et al., The Lancet 1996

81
Serial Changes in A1C in Newly Diagnosed Type 2 Diabetes Patients Group A – 28 patients who continued treatment for 6 weeks Group B – 28 patients who discontinued treatment after 4 weeks No Significant Difference Yamanouchi T et al.Lancet 1996

82
Serial Changes in 1,5-AG in Newly Diagnosed Type 2 Diabetes Patients Group A – 28 patients who continued treatment for 6 weeks Group B – 28 patients who discontinued treatment after 4 weeks P<0.0001 1,5 Anhydroglucitol detected slight change in glycemia Yamanouchi T et al.Lancet 1996

83
Time course of normalization of Plasma 1,5AG levels in NIDDM 0 4 8 12 16 20 24 weeks 1,5AG (µg/mL) 20 15 10 5 Yamanouchi T et al Diabetes 1989. 36: 709-715

86
McGill J et al Diabetes Care 2004

87
FDA Study – Longitudinal Changes Time point Statistic 1,5AGug/mlA1C%Fructosamineumol/LGlucosemg/dL Baseline Mean Mean1.99.5410.6225 Visit 2 (2 weeks) Mean Mean Mean% Change Mean% Change3.0*57.9%9.1-4.2% 362.4 * 362.4 *-11.7%187.4*-16.7% Visit 3 (4 weeks) Mean Mean Mean% Change Mean% Change3.7*94.7%8.8*-7.4%340.0*-17.2%181.4*-19.4% Visit 4 (8 weeks) Mean Mean Mean% Change Mean% Change5.0*163.2%8.2*-13.7%317.5*-22.7%172.6*-23.3% *p<0.05 vs. baseline McGill J et al Diabetes Care 2004

88
FDA Study – Longitudinal Changes McGill J et al Diabetes Care 2004

89
Assessing the Role of 1,5 AG for Monitoring Post-Prandial Glycemic Excursions K Dungan, J. Buse, J Largay, M Kelly, E Button, S Kato, S. Wittlin University of North Carolina University of Rochester Dungan K et al Diabetes Care; June 2006

90
Study to Evaluate 1,5 AG/Glycemic Excursions as Determined by Continuous Glucose Measurements Moderately-Controlled Patients (n=34) with A1Cs between 6.5 and 8.0 monitored over 7 days Comparing 1,5 AG, Fructosamine,and Hemoglobin A1C levels to Glycemic excursions above the renal threshold (> 180 mg/dl) Glycemic excursions measured by CGMS Objective: To demonstrate the relationship between serum 1,5-AG (relative to A1C and fructosamine) and the occurrence of postprandial hyperglycemia as reflected by CGMS in suboptimally controlled patients with diabetes Dungan K et al Diabetes Care; June 2006
 with A1Cs between 6.5 and 8.0 monitored over 7 days Comparing 1,5 AG, Fructosamine,and Hemoglobin A1C levels to Glycemic excursions above the renal threshold (> 180 mg/dl) Glycemic excursions measured by CGMS Objective: To demonstrate the relationship between serum 1,5-AG (relative to A1C and fructosamine) and the occurrence of postprandial hyperglycemia as reflected by CGMS in suboptimally controlled patients with diabetes Dungan K et al Diabetes Care; June 2006")
91
Study Methodology Dungan K et al Diabetes Care; June 2006

92
Postprandial Variables AUC-180 – measure of total area above 180 mg/dl for (mg/dl*Day) Average Postmeal (Maximum) Glucose (mg/dl) – maximum height of each postmeal glucose excursion for breakfast, lunch, and dinner Postprandial Index (PI) – 4 variable combination (max glucose levels for post-breakfast, lunch, dinner and AUC-180 - 7 days) Dungan K et al Diabetes Care; June 2006
 Average Postmeal (Maximum) Glucose (mg/dl) – maximum height of each postmeal glucose excursion for breakfast, lunch, and dinner Postprandial Index (PI) – 4 variable combination (max glucose levels for post-breakfast, lunch, dinner and AUC days) Dungan K et al Diabetes Care; June 2006")
93
Correlation AUC-180 vs. Glycemic Assay AUC-180^ (mg/dl*Day) Avg. A1C A1C-End Interval* Avg. 1,5- AG 1,5-AG- End Interval Avg. FA FA- End Interval Interval 1 & 2 Interval 1 & 2N=34 R = 0.36 p =0.02 R = 0.35 p =0.02 R = -0.48 p = 0.002 R = -0.49 p = 0.002 R = 0.33 p =0.03 R = 0.38 p =0.01 Interval 1 N=34 R = 0.23 p =0.09 R = 0.22 p =0.11 R = -0.36 p =0.02 R = -0.37 p =0.02 R = 0.16 p =0.18 R = 0.12 p =0.25 Interval 2 N=33 R = 0.35 p = 0.02 R = 0.34 p =0.03 R = -0.42 p =0.008 R = -0.44 p =0.005 R = 0.37 p = 0.02 R = 0.39 p = 0.01 ^AUC-180=area under the curve for glucose greater than 180mg/dL as determined by CGMS software. *End-interval is visit 2 for interval 1, visit 3 for interval 2 and total (1 & 2). 1,5-AG Correlated Better than A1C or Fructosamine to AUC-180 Dungan K et al Diabetes Care; June 2006
. 1,5-AG Correlated Better than A1C or Fructosamine to AUC-180 Dungan K et al Diabetes Care; June")
94
Avg. Maximum Postmeal Glucose vs. Avg. Glycemic Assay 1,5-AG Correlated Better than A1C or Fructosamine to ALL Postmeal Max Values Avg. A1C Avg. 1,5-AG Avg. FA Avg. Postmeal Max (Breakfast) N=20 R = 0.12 p = 0.31 R = -0.38 p =0.05 R = -0.003 p =0.494 Avg. Postmeal Max (Lunch) N=23 R = 0.19 p = 0.19 R = -0.22 p =0.15 R = 0.06 p = 0.39 Avg. Postmeal Max (Dinner) N=22 R = 0.25 p = 0.13 R = -0.54 p = 0.004 R = 0.35 p = 0.06 Combined Postmeal Max (Breakfast, Lunch Dinner)- Multiple Regression N=19 R = 0.25 R = -0.57 R = 0.36 Dungan K et al Diabetes Care; June 2006
 N=20 R = 0.12 p = 0.31 R = p =0.05 R = p =0.494 Avg. Postmeal Max (Lunch) N=23 R = 0.19 p = 0.19 R = p =0.15 R = 0.06 p = 0.39 Avg. Postmeal Max (Dinner) N=22 R = 0.25 p = 0.13 R = p = R = 0.35 p = 0.06 Combined Postmeal Max (Breakfast, Lunch Dinner)- Multiple Regression N=19 R = 0.25 R = R = 0.36 Dungan K et al Diabetes Care; June")
95
Postprandial Index vs. Average Glycemic Assay 1,5-AG Correlated Better than A1C or Fructosamine to the Postprandial Index Postprandial Index (Multi- variate-PI) N=19 Avg. A1C Avg. 1,5- AG Avg. FA R=0.36R=0.58R=0.36 *Postprandial Index is the conglomerate multivariable analysis using AUC-180 and post-meal maximum glucose values as the independent variables. Dungan K et al Diabetes Care; June 2006
 N=19 Avg. A1C Avg. 1,5- AG Avg. FA R=0.36R=0.58R=0.36 *Postprandial Index is the conglomerate multivariable analysis using AUC-180 and post-meal maximum glucose values as the independent variables. Dungan K et al Diabetes Care; June")
96
Postprandial Index vs. A1C/1,5-AG Assay Ratio A1C/1,5-AG Ratio Correlated Better than A1C or 1,5-AG independently to the Postprandial Index Combination of 1,5-AG and A1C are more predictive of postprandial hyperglycemia Postprandial Index (Multi- variate-PI) N=19 Avg. A1C Avg. 1,5- AG Avg. A1C/Avg. 1,5-AG Ratio R=0.36R=0.58R=0.66 *Postprandial Index is the conglomerate multivariable analysis using AUC-180 and post-meal maximum glucose values as the independent variables. Dungan K et al Diabetes Care; June 2006
 N=19 Avg. A1C Avg. 1,5- AG Avg. A1C/Avg. 1,5-AG Ratio R=0.36R=0.58R=0.66 *Postprandial Index is the conglomerate multivariable analysis using AUC-180 and post-meal maximum glucose values as the independent variables. Dungan K et al Diabetes Care; June")
97
Average and Premeal Glucose vs. Glycemic Assay Fructosamine and A1C correlated better than 1,5-AG to both average glucose and premeal glucose variables Avg. A1C Avg. 1,5-AG Avg. FA Average Glucose – CGMS Sensor N = 34 R = 0.27 p = 0.26 R = -0.15 p = 0.23 R = 0.40 P = 0.04 Combined Premeal (Breakfast, Lunch Dinner) - Multiple Regression N=19 R = 0.42 R = -0.33 R = 0.45 Dungan K et al Diabetes Care; June 2006
 - Multiple Regression N=19 R = 0.42 R = R = 0.45 Dungan K et al Diabetes Care; June")
98
1,5 AG as Adjunct to A1C to Reflect Postprandial Hyperglycemia 1,5 AG is indicative of differing postmeal glucose levels in moderately controlled patients – despite similar A1C levels! GlycoMark (1,5-AG) Range 0-6 N=17 A1C (%) Mean 1,5-AG (ug/ml) Mean Total AUC-180 Glucose 1 PostMeal Glucose-Max Mean (mg/dl) BreakfastN=9 LunchN=10 DinnerN=9 Higher Postprandial Variables 7.384.5516.29259224198 GlycoMark (1,5-AG) Range 6-18 N=16 A1C (%) Mean 1,5-AG (ug/ml) Mean Total AUC-180 Glucose 1 PostMeal Glucose-Max Mean (mg/dl) Breakfast N=11 PostMeal Glucose-Max Mean (mg/dl) Lunch N=13 N=13 PostMeal Glucose-Max Mean (mg/dl) DinnerN=13 Lower Postprandial Variables 7.209.2910.75228196162 Dungan K et al Diabetes Care; June 2006
 Range 0-6 N=17 A1C (%) Mean 1,5-AG (ug/ml) Mean Total AUC-180 Glucose 1 PostMeal Glucose-Max Mean (mg/dl) BreakfastN=9 LunchN=10 DinnerN=9 Higher Postprandial Variables GlycoMark (1,5-AG) Range 6-18 N=16 A1C (%) Mean 1,5-AG (ug/ml) Mean Total AUC-180 Glucose 1 PostMeal Glucose-Max Mean (mg/dl) Breakfast N=11 PostMeal Glucose-Max Mean (mg/dl) Lunch N=13 N=13 PostMeal Glucose-Max Mean (mg/dl) DinnerN=13 Lower Postprandial Variables Dungan K et al Diabetes Care; June")
99
GlycoMark Monitors Postprandial Hyperglycemia Dungan K et al. Diabetes Care (June 2006) Patients were sorted by glycemic excursions as measured by CGMS (AUC-180) and subdivided into two populations – bottom 50 th percentile (17 patients) and top 50 th percentile (17 patients). Authors Conclusions 1,5-AG (GlycoMark) assay reflects glycemic excursions, often in the postprandial state, more robustly than other established glycemic assays. 1,5-AG was reflective of varying postmeal glucose levels, despite similarities in A1Cs. In clinical practice, A1C and 1,5-AG may be used sequentially, first employing the A1C assay to identify patients who are moderately controlled and then using the 1,5-AG assay to determine the extent of postprandial glycemic excursions.
 Patients were sorted by glycemic excursions as measured by CGMS (AUC-180) and subdivided into two populations – bottom 50 th percentile (17 patients) and top 50 th percentile (17 patients). Authors Conclusions 1,5-AG (GlycoMark) assay reflects glycemic excursions, often in the postprandial state, more robustly than other established glycemic assays. 1,5-AG was reflective of varying postmeal glucose levels, despite similarities in A1Cs. In clinical practice, A1C and 1,5-AG may be used sequentially, first employing the A1C assay to identify patients who are moderately controlled and then using the 1,5-AG assay to determine the extent of postprandial glycemic excursions..")
100
52 year old female with type 1 DM A1C 7.43% 1,5-AG 12.4mcg/dL PPG max 195 mg/dL 49 year old male with type 2 DM A1C 7.27% 1,5-AG 4.5mcg/dL PPG max 235 mg/dL Representative Patients

101
Even though A1C levels are similar, 1,5 Anhydroglucitol levels are indicative of differing postmeal glucose levels in moderately controlled patients (A1C 6.5 to 8.0%). Dungan K et al Diabetes Care; June 2006

102
UNC/Rochester Study Conclusions In a subset of moderately controlled patients (A1C 6.5 to 8.0), significant postprandial hyperglycemia was present 1,5-AG reflects postprandial hyperglycemia more robustly than established glycemic assays At similar A1C levels, there may be variability in postprandial hyperglycemia –which is reflected by 1,5- AG levels!!
, significant postprandial hyperglycemia was present 1,5-AG reflects postprandial hyperglycemia more robustly than established glycemic assays At similar A1C levels, there may be variability in postprandial hyperglycemia –which is reflected by 1,5- AG levels!!")
103
UNC/Rochester Study Clinical Possibilities 1,5-AG may be used in combination with A1C for better predictability of postprandial hyperglycemia than either assay alone A Two-Step Sequential Process Might be Used: 1) Use A1C to identify patients who are moderately controlled (A1C 6.5 to 8.0) 2) Use1,5-AG to determine extent of postprandial hyperglycemia
 Use A1C to identify patients who are moderately controlled (A1C 6.5 to 8.0) 2) Use1,5-AG to determine extent of postprandial hyperglycemia")
104
1,5 Anhydroglucitol Ranges and Diabetes Assessment GlycoMark values < 10 ( in A1C range 6.5 – 8.0) indicate presence of postprandial hyperglycemia GlycoMark (ug/ml) Assessment of Diabetes 14 or higher Normal (healthy) 10.0 – 13.9 Well-Controlled 6.0 – 9.9 Moderately Uncontrolled Moderately Uncontrolled 2.0 – 5.9 Poorly Controlled 1.9 or lower Very Poorly Controlled
 indicate presence of postprandial hyperglycemia GlycoMark (ug/ml) Assessment of Diabetes 14 or higher Normal (healthy) 10.0 – 13.9 Well-Controlled 6.0 – 9.9 Moderately Uncontrolled Moderately Uncontrolled 2.0 – 5.9 Poorly Controlled 1.9 or lower Very Poorly Controlled")
105
1,5 AG (ug/ml) Approximate Mean Postmeal Maximum Blood Glucose (mg/dl) > 12 < 180 10185 8190 6200 4225 < 2 > 290 1,5-AG and Postmeal Glucose Levels 1,5-AG and Postmeal Glucose Levels
 Approximate Mean Postmeal Maximum Blood Glucose (mg/dl) > 12 < < 2 > 290 1,5-AG and Postmeal Glucose Levels 1,5-AG and Postmeal Glucose Levels")
106
1,5 Anhydroglucitol as Comprehensive Adjunct to A1C Diagnostic Algorithm Managing Short-Term Glucose Control Managing Postprandial Glucose Control (PPG) 1,5 AG (ug/ml) DiabetesA1C > 10 Well- Controlled 4 - 6 5 – 10* Moderately Controlled 6 - 8 2 - 5 Poor Control 8 - 10 < 2 Very Poor Control > 10 1,5 AG (ug/ml) Approximate Mean Postmeal Maximum Blood Glucose (mg/dl) > 12 < 180 10185 8190 6200 4225 < 2 > 290
 1,5 AG (ug/ml) DiabetesA1C > 10 Well- Controlled – 10* Moderately Controlled Poor Control < 2 Very Poor Control > 10 1,5 AG (ug/ml) Approximate Mean Postmeal Maximum Blood Glucose (mg/dl) > 12 < < 2 > 290")
107
Performance of 1,5 Anhydroglucitol in Recent Drug Trials

108
Sitagliptin and 1,5 Anhydroglucitol Evaluated efficacy and tolerability of sitagliptin in Japanese patients with T2DM over 12 weeks Evaluated efficacy and tolerability of sitagliptin in Japanese patients with T2DM over 12 weeks Initial A1C levels - 6.5 to 10.0% Initial A1C levels - 6.5 to 10.0% Randomized to sitagliptin (n=75) or placebo (n=76) Randomized to sitagliptin (n=75) or placebo (n=76) Stein P et al ADA 2006. Poster 537-P

109
Sitagliptin and 1,5 Anhydroglucitol Change from Baseline to Study End – Comparison of Mean Values PlaceboSitagliptin 100mg 1,5-AG (μg/mL)Baseline4.15.3 Week 123.89.7 A1C (%)Baseline7.77.5 Week 128.16.9 Stein P et al ADA 2006. Poster 537-P

110
Sitagliptin and 1,5 Anhydroglucitol Sitagliptin and 1,5 Anhydroglucitol Change from Baseline to Study End PlaceboSitagliptin 100mg Between Group Comparison LS95% ClLS95% ClLS Difference 95% Cl A1C 0.41(0.26, 0.5)-0.65(-0.80, 0.50)-1.05*(-1.27, -0.84) 1,5- AG -0.33(-1.05, 0.38)4.45(3.73, 5,17)4.78*(3.76, 5.80) *P value <0.001 Change in Postmeal Glucose Compared to A1C and 1,5-AG % Changes (Baseline to Study End) Absolute Change in 2 hour postmeal glucose (mg/dL) A1C Absolute % change 1,5-AG Absolute % change Sitagliptin 100mg -69.2-8.6% 83% Placebo11.75.2%-7.3% Stein P et al ADA 2006. Poster 537-P

111
Miglitol and 1,5 AG Clinical Drug Trial – T. Yamanouchi (University of Teikyo) Placebo N=84 Miglitol N=158 1,5-AG (μg/mL)Baseline4.5 Week 124.510.0* A1C (%)Baseline7.3 Week 127.57.0* Comparison of Mean Values After 4 weeks, mean 1,5-AG was 9.0 ug/ml (p<0.001) compared to baseline *p<0.001
 Placebo N=84 Miglitol N=158 1,5-AG (μg/mL)Baseline4.5 Week * A1C (%)Baseline7.3 Week * Comparison of Mean Values After 4 weeks, mean 1,5-AG was 9.0 ug/ml (p<0.001) compared to baseline *p<")
112
PPG more than 180 Mean Maximum PPG PPG more than 180 Mean Maximum PPG Before Breakfast After Breakfast Before Lunch After Lunch Before Dinner After Dinner Before Breakfast After Breakfast Before Lunch After Lunch Before Dinner After Dinner BG Patient 1: Age 75, female, type2 DM Patient2:Age 73, female, type2 DM Data from Dr Mori in Japan

113
Pramlintide and 1,5 AG Objective: To assess 1,5-AG as a marker of PPG control in Pramlintide-treated patients with type 1 diabetes (T1DM) Objective: To assess 1,5-AG as a marker of PPG control in Pramlintide-treated patients with type 1 diabetes (T1DM) Initial A1C levels - 7.2 to 8.0% Initial A1C levels - 7.2 to 8.0% Randomized to Pramlintide (n=18) or placebo (n=19) Randomized to Pramlintide (n=18) or placebo (n=19) Twenty-nine week study Twenty-nine week study Lush C et al.AACE 2007 Meeting (Poster 296)
 Objective: To assess 1,5-AG as a marker of PPG control in Pramlintide-treated patients with type 1 diabetes (T1DM) Initial A1C levels to 8.0% Initial A1C levels to 8.0% Randomized to Pramlintide (n=18) or placebo (n=19) Randomized to Pramlintide (n=18) or placebo (n=19) Twenty-nine week study Twenty-nine week study Lush C et al.AACE 2007 Meeting (Poster 296)")
114
Pramlintide and 1,5 AG Pramlintide and 1,5 AG Comparison of Changes in Values from Baseline to Week 29 Placebo (n=19)Pramlintide (n=18)Pramlintide vs. Placebo 2-hr PPG excursions +6.5 +/- 7.6 mg/dL-43.9 +/- 10.9 mg/dL P < 0.001 Body Weight +1.3 +/- 0.7 kg-2.0 +/- 1.2 kgP < 0.01 A1C 0.22 +/- 0.21 %0.18 +/- 0.31 % NS 1,5-AG ug/ml Percent Change -0.65 +/- 0.41 -9 +/- 8 % +0.96 +/- 0.91 +30 +/- 16 % P<0.05 P<0.01 Lush C et al.AACE 2007 Meeting (Poster 296)
.")
115
Pramlintide and 1,5 AG Conclusions Pramlintide, as an adjunct treatment for T1DM patients on intensive insulin therapy, led to improved PPG and significant reduction in body weight. Pramlintide, as an adjunct treatment for T1DM patients on intensive insulin therapy, led to improved PPG and significant reduction in body weight. Despite similar reductions in A1C, the change in 1,5 AG levels was consistent with improvement in PPG control in pramlintide-treated subjects, as measured by SMBG. Despite similar reductions in A1C, the change in 1,5 AG levels was consistent with improvement in PPG control in pramlintide-treated subjects, as measured by SMBG. 1,5-AG, as a complement to A1C, may be a useful marker of PPG control. 1,5-AG, as a complement to A1C, may be a useful marker of PPG control. Lush C et al.AACE 2007 Meeting (Poster 296)
.")
116
Exenatide and 1,5 Anhydroglucitol Objective: To assess 1,5-AG as a marker of PPG control in Exenatide-treated patients with type 2 diabetes (T2DM) Objective: To assess 1,5-AG as a marker of PPG control in Exenatide-treated patients with type 2 diabetes (T2DM) 144 Patients 144 Patients Initial A1C levels – 8.2 +/-1% Initial A1C levels – 8.2 +/-1% Randomized to Exenatide (5 or 10 ug) or placebo Randomized to Exenatide (5 or 10 ug) or placebo Thirty week study Thirty week study Kendall D, Holcombe J et al ADA & EASD 2007 Annual Meetings
 Objective: To assess 1,5-AG as a marker of PPG control in Exenatide-treated patients with type 2 diabetes (T2DM) 144 Patients 144 Patients Initial A1C levels – 8.2 +/-1% Initial A1C levels – 8.2 +/-1% Randomized to Exenatide (5 or 10 ug) or placebo Randomized to Exenatide (5 or 10 ug) or placebo Thirty week study Thirty week study Kendall D, Holcombe J et al ADA & EASD 2007 Annual Meetings")
117
Exenatide and 1,5 Anhydroglucitol Exenatide (5 ug) Exenatide (10 ug) 1,5-AG ug/ml Percent Change +2.7 +/- 0.6* 45.3 +/- 11.9 +2.9 +/- 0.6 ** 69.4 +/- 14.6 A1C % -0.5 +/- 0.1-0.9 +/- 0.1 ** Correlations: Changes from baseline 1,5-AG vs. HbA1C: r = - 0.74; P <0.0001 1,5-AG vs. fasting plasma glucose (FPG): r= -0.54; P <0.0001 When grouped as HbA1C change tertiles patients with larger HbA1C changes from baseline had larger 1,5-AG changes from baseline. 1,5 AG changes were more robust than HbA1C changes Comparison of Changes in Values from Baseline to Study End * P < 0.05; ** P < 0.01 Kendall D, Holcombe J et al ADA & EASD 2007 Annual Meetings
: r= -0.54; P < When grouped as HbA1C change tertiles patients with larger HbA1C changes from baseline had larger 1,5-AG changes from baseline. 1,5 AG changes were more robust than HbA1C changes Comparison of Changes in Values from Baseline to Study End * P < 0.05; ** P < 0.01 Kendall D, Holcombe J et al ADA & EASD 2007 Annual Meetings.")
118
Summary 1,5 Anydroglucitol appears to be a more robust indicator of glycemic excursions than either HbA1C or Fructosamine 1,5 Anydroglucitol appears to be a more robust indicator of glycemic excursions than either HbA1C or Fructosamine It is currently FDA-approved and clinically available; might a home kit be of clinical utility !!?? It is currently FDA-approved and clinically available; might a home kit be of clinical utility !!?? 1,5 AG responds more rapidly and sensitively than either HbA1C or Fructosamine 1,5 AG responds more rapidly and sensitively than either HbA1C or Fructosamine 1,5 AG may be a useful clinical adjunct and indicator for monitoring moderately well-controlled patients with diabetes 1,5 AG may be a useful clinical adjunct and indicator for monitoring moderately well-controlled patients with diabetes More clinical trials are necessary and underway to explore how effective this tool can be and to define other areas in which it may be limited or most helpful More clinical trials are necessary and underway to explore how effective this tool can be and to define other areas in which it may be limited or most helpful

119
1,5 Anhydroglucitol – Key References Dungan K et al Diabetes Care 2006 29:1214- 1219 McGill, J. et al. Circulating 1,5 Anhydroglucitol Levels in Adult Patients With Diabetes Reflect Longitudinal Changes of Glycemia: A U.S. Trial of the GlycoMark assay Diabetes Care 2004 Buse, J. et al. Serum 1,5-Anhydroglucitol (GlycoMark): A Short-Term Glycemic Marker. Diabetes Technology and Therapeutics 2003; 5:355-363. Dworacka M. et al. 1.5-Anhdro-D-glucitol: A Novel Marker of Glucose Excursions. International J. of Clinical Practice 2002; Supplement 129:40-44 (Eli Lilly Symposium) Kishimoto M. et al. 1,5-Anhydroglucitol Evaluates Daily Glycemic Excursions in Well-Controlled NIDDM. Diabetes Care 1995; 18(8):1156-1159. Matsumoto, K. et al. Effects of Voglibose on Glycemic Excursions, Insulin Secretion, and Insulin Sensitivity in Non-Insulin-Treated NIDDM Patients. Diabetes Care 1998; 21(2):256-260. Yamanouchi T. et al. Estimation of Plasma Glucose Fluctuation With a Combination Test of HbA1c and 1,5-AG. Metabolism 1992; 8: 862-867. Yamanouchi T. et al. Clinical usefulness of serum 1,5-anhydroglucitol in maintaining glycaemic control. Lancet 1996;347:1514-1518. Yamanouchi T. et al. Post-load glucose measurements in oral glucose tolerance tests correlate well with 1,5-AG in subjects with impaired glucose tolerance. Clinical Science 2001;101:227-233.
: A Short-Term Glycemic Marker. Diabetes Technology and Therapeutics 2003; 5: Dworacka M. et al. 1.5-Anhdro-D-glucitol: A Novel Marker of Glucose Excursions. International J. of Clinical Practice 2002; Supplement 129:40-44 (Eli Lilly Symposium) Kishimoto M. et al. 1,5-Anhydroglucitol Evaluates Daily Glycemic Excursions in Well-Controlled NIDDM. Diabetes Care 1995; 18(8): Matsumoto, K. et al. Effects of Voglibose on Glycemic Excursions, Insulin Secretion, and Insulin Sensitivity in Non-Insulin-Treated NIDDM Patients. Diabetes Care 1998; 21(2): Yamanouchi T. et al. Estimation of Plasma Glucose Fluctuation With a Combination Test of HbA1c and 1,5-AG. Metabolism 1992; 8: Yamanouchi T. et al. Clinical usefulness of serum 1,5-anhydroglucitol in maintaining glycaemic control. Lancet 1996;347: Yamanouchi T. et al. Post-load glucose measurements in oral glucose tolerance tests correlate well with 1,5-AG in subjects with impaired glucose tolerance. Clinical Science 2001;101:")
120
Many Thanks To: Mary Kelly RN…Who is asked to do it all..and succeeds !! Mary Kelly RN…Who is asked to do it all..and succeeds !! John Buse John Buse Kathleen Dungan Kathleen Dungan Eric Button Eric Button Shuhei Kato Shuhei Kato

121
Questions ??

Similar presentations


 patients Policy.>")


