Download presentation
Presentation is loading. Please wait.

1
2013 Commitment to Development Index

2
Components Aid Trade Finance Migration Environment Security Technology

3
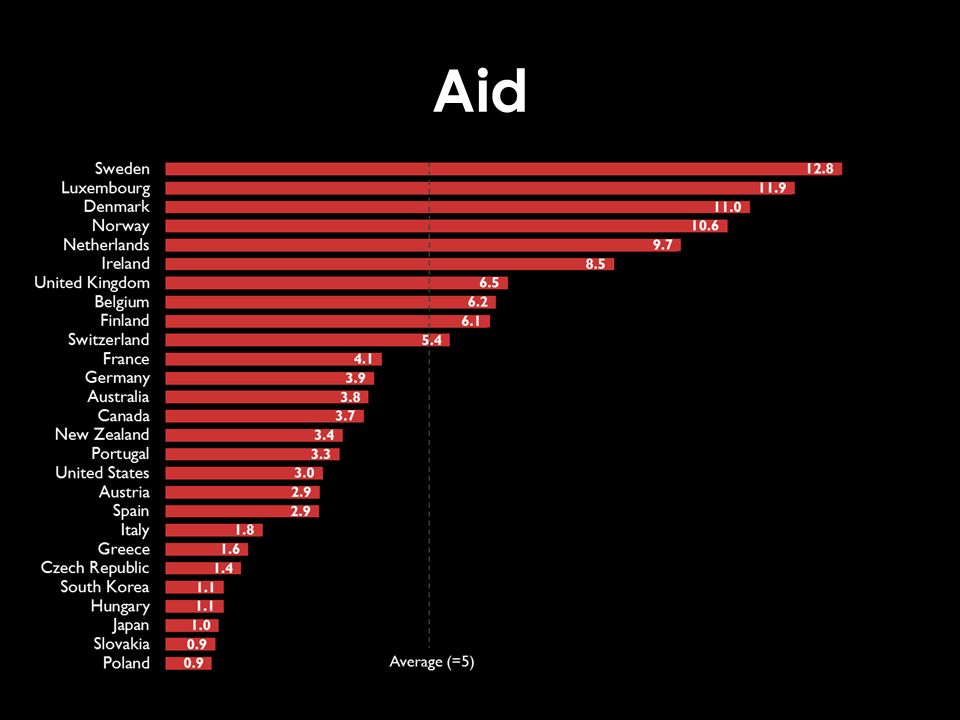
Quantity, net of debt payments Tying Selectivity Project proliferation Tax breaks for charity Aid

5
Trade Tariffs Quotas Farm subsidies Impediments to imports Services trade restrictions

6
Trade

7
Finance Political risk insurance Bribery and corruption Portfolio investment Financial secrecy More

8
Finance

9
Migration Immigration, especially unskilled Foreign students from developing countries Aid to refugees and asylum- seekers

10
Migration

11
Environment Greenhouse gas emissions Gas taxes Fishing subsidies Tropical timber imports More

12
Environment

13
Security $ + personnel to U.N. peacekeeping Personnel to non-U.N. Arms exports Protecting sea lanes International security treaties

14
Security

15
Technology Public R&D spending Tax breaks for R&D Limiting intellectual property rights

16
Technology

17
Overall

18
Change, 2003-13

19
Sources: Jörg Faust, Foreign Policy

20
Sub-Saharan Africa

21
Middle East & North Africa

22
Europe and Central Asia

23
South Asia

24
East Asia & Pacific

25
Latin America & Caribbean

26
cgdev.org/cdi

28
Overall RankCountryAidTradeFinanceMigrationEnvironmentSecurityTechnology Overall (Average) Change, 2003-2013 12Australia3.87.15.76.93.85.04.75.3+0.3 10Austria2.95.44.07.46.66.35.65.5+0.6 10Belgium6.25.15.76.27.23.74.45.5+0.5 13Canada3.76.05.37.62.65.65.35.2–0.1 24Czech Republic1.45.04.51.37.52.05.43.9N/A 1Denmark11.05.36.24.27.07.26.66.8–0.4 5Finland6.15.56.33.27.86.45.75.9+0.7 17France4.15.15.54.27.12.66.65.0+0.5 13Germany3.95.44.47.07.13.55.15.2+0.3 21Greece1.64.94.74.55.95.62.74.3+0.2 22Hungary1.15.04.81.68.05.53.24.2N/A 7Ireland8.55.35.24.46.76.93.85.8+0.6 18Italy1.85.05.54.66.95.13.94.7+0.5 26Japan1.01.63.92.33.84.56.23.3+0.2 4Luxembourg11.95.23.66.85.84.94.16.0N/A 5Netherlands9.75.95.04.26.94.25.25.9–0.1 9New Zealand3.48.14.26.76.07.14.45.7–0.8 3Norway10.61.25.99.62.87.45.76.2+0.1 23Poland0.95.56.01.87.63.72.54.0N/A 13Portugal3.35.15.52.47.76.26.45.2–1.1 24Slovakia0.94.93.60.98.65.52.63.9N/A 26South Korea1.1-1.24.95.74.31.36.83.3N/A 16Spain2.95.36.15.76.73.45.45.1+0.3 2Sweden12.85.96.29.07.80.34.56.6–0.1 19Switzerland5.41.83.26.46.14.64.94.6+0.2 7United Kingdom6.55.55.95.87.35.44.25.8+0.5 19United States3.07.15.13.64.34.64.74.6+0.6
 Change, Australia Austria Belgium Canada –0.1 24Czech Republic N/A 1Denmark –0.4 5Finland France Germany Greece Hungary N/A 7Ireland Italy Japan Luxembourg N/A 5Netherlands –0.1 9New Zealand –0.8 3Norway Poland N/A 13Portugal –1.1 24Slovakia N/A 26South Korea N/A 16Spain Sweden –0.1 19Switzerland United Kingdom United States")
29
Overall (EU) RankCountryAidTradeFinanceMigrationEnvironmentSecurityTechnology Overall (Average) 1Norway10.61.25.99.62.87.45.76.2 2New Zealand3.48.14.26.76.07.14.45.7 3Australia3.87.15.76.93.85.04.75.3 4Canada3.76.05.37.62.65.65.35.2 4EU4.65.35.45.07.14.04.85.2 6United States3.07.15.13.64.34.64.74.6 6Switzerland5.41.83.26.46.14.64.94.6 8Japan1.01.63.92.33.84.56.23.3 8South Korea1.1-1.24.95.74.31.36.83.3
 RankCountryAidTradeFinanceMigrationEnvironmentSecurityTechnology Overall (Average) 1Norway New Zealand Australia Canada EU United States Switzerland Japan South Korea")
30
Overall (Europe) RankCountryAidTradeFinanceMigrationEnvironmentSecurityTechnology Overall (Average) 1New Zealand3.48.14.26.76.07.14.45.7 2Australia3.87.15.76.93.85.04.75.3 3Canada3.76.05.37.62.65.65.35.2 4Europe4.85.15.35.17.03.94.95.1 5United States3.07.15.13.64.34.64.74.6 6Japan1.01.63.92.33.84.56.23.3 6South Korea1.1-1.24.95.74.31.36.83.3
 RankCountryAidTradeFinanceMigrationEnvironmentSecurityTechnology Overall (Average) 1New Zealand Australia Canada Europe United States Japan South Korea")
31
Average rank change when one component weighted more

Similar presentations