Download presentation
Presentation is loading. Please wait.

1
Chapter 2:

2
Come up to board and write the number of different types of social media YOU have used TODAY If you are male, please use a blue marker If you are female, please use a black marker

3
Let’s randomly form groups of 3 or 4, learn each other’s names (you will need to introduce them when we share out, so be sure you know their names) Your group has 3 minutes to discuss/choose a graphical representation that would make sense to use with this data. You must explain why you chose that particular graphical representation Your group will have 1 minute to report out

4
Dot plots Stem (and leaf) plots Histograms Box plots (later...) (and much later)... Density curves, scatter plots, least-squares regression lines, Normal probability plots, etc. Why didn’t I list pie charts or bar graphs?

5
We always label & scale our graphical representations We always use technology (absolutely no need to create graphical representations by hand)
")
6
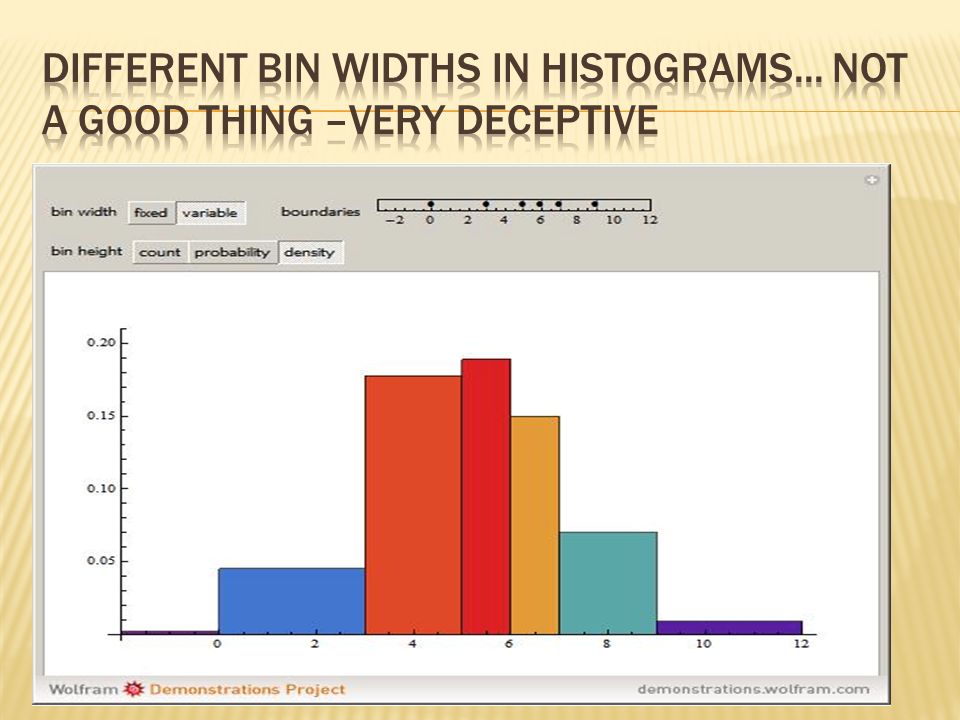
Dot plot... What’s good about dot plots? What’s not so good? Histogram... What’s good about histograms? What’s not so good?

8
Stem (and leaf) plots... What’s good about stem plots? What’s not so good?
 plots... What’s good about stem plots What’s not so good")
9
Come up to the board and write: # of piercings you have (use blue marker if male; black marker if female) Total # of pets you have ever had (any color marker)
 Total # of pets you have ever had (any color marker)")
10
Create a different graphical representation for each. Discuss why you chose that graphical representation for the particular data set to the person you are sitting next to. You have 5 minutes.

11
No matter which GR you created with this data set, how could you describe your GR? What types of characteristics might we consider when trying to describe the graph of this data?

12
S – Shape. Symmetric? Skewed? Uni-Modal, bi-modal, tri-modal, multi-modal? O– Outlier(s) Is/are there unusually large or small values that are “away” from the majority of the rest of the data? C – Center What is the “typical*” value of the distribution/data? S – Spread Typically/on average*, how far apart or close together is the data/distribution? * Different types of ‘averages’ and ‘typical’. Will discuss further and in detail soon.
 Is/are there unusually large or small values that are away from the majority of the rest of the data. C – Center What is the typical* value of the distribution/data. S – Spread Typically/on average*, how far apart or close together is the data/distribution. * Different types of ‘averages’ and ‘typical’. Will discuss further and in detail soon..")
13
Lets look at our piercing data with a histogram, dot plot, & stem plot; & describe the distribution using SOCS Now with a partner, create a graphical representation (your choice) with either # pets data or # social media data (or both if you have time). You have 5 minutes. Be prepared to do a 1-minute share out as I will randomly call on a few pairs to share out

14
Write on the board your favorite social media, the type of first pet you had, & where your favorite/only body piercing is (keep it “G” rated please) Use a black marker if you are 25 years or younger Use a blue marker if you are 26 – 40 years old Use a green marker if you are 41 + years old
 Use a black marker if you are 25 years or younger Use a blue marker if you are 26 – 40 years old Use a green marker if you are 41 + years old")
15
Favorite social media, the type of first pet you had, & where your favorite/only body piercing is (keep it “G” rated please)
")
16
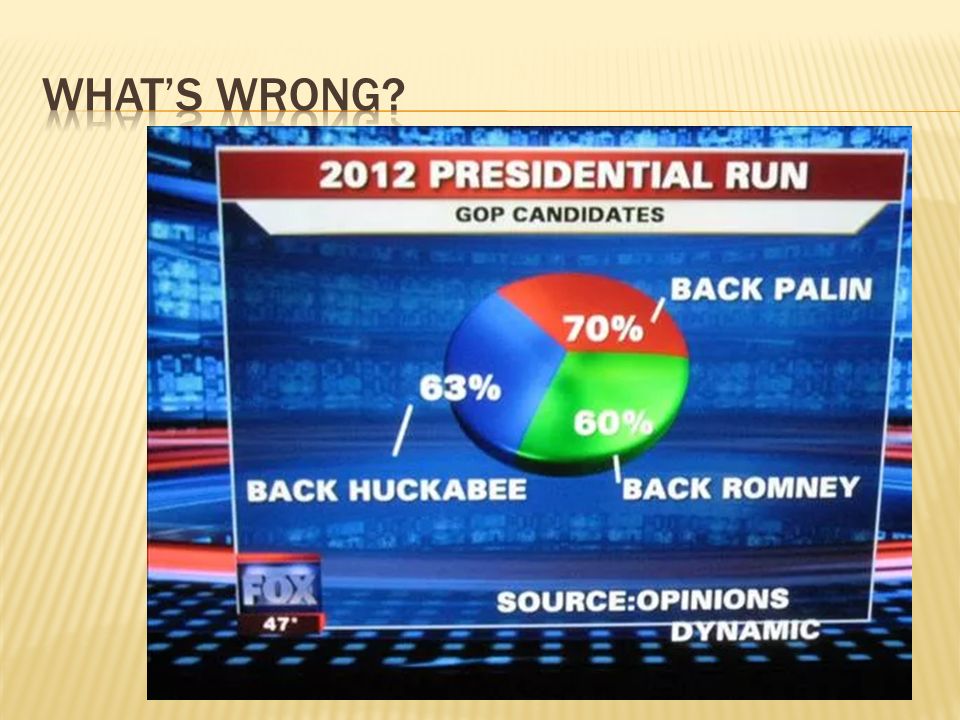
Bar (Charts) Graphs (caution. Very different from histograms. Why?) Pie Charts BIG IDEA... the same... visualizing data can be helpful in observing trends Whether categorical or numerical, always good to graph your data
 Pie Charts BIG IDEA... the same... visualizing data can be helpful in observing trends Whether categorical or numerical, always good to graph your data.")
17
Using our favorite social media data, input into Minitab Use two columns: 1 for the name of the social media for a given person; and the other for the corresponding gender for that given person Create a bar graph AND a pie chart using (for now) just the column with the social media data
 just the column with the social media data")
18
Enter 1 st pet & piercing location into Minitab Create a bar graph & a pie chart for each of the following data sets: 1 st pet & piercing location We will randomly choose several of you to share out. You have 5 minutes. Help each other out!

25
Form groups randomly (how would we like to do this?) In your group, answer the ‘Before the Activity’ questions (one paper per group; include all names) Gather your data, then write it on board; let’s use blue marker for male; black for female Input all data from class into Minitab
 In your group, answer the ‘Before the Activity’ questions (one paper per group; include all names) Gather your data, then write it on board; let’s use blue marker for male; black for female Input all data from class into Minitab")
26
Do “After the Activity;” follow all directions 1-2 paragraph write up answering questions asked in ‘After the Activity;” also include justification of the group’s choice of graphs Include the actual graphs & numerical analysis (SOCS) of data/graphs (from Minitab) All members of group must contribute Maximum points possible: 30 project points.
 of data/graphs (from Minitab) All members of group must contribute Maximum points possible: 30 project points.")
27
HW quiz on...

Similar presentations


 C2-4: Categorical and Quantitative Data.>")


>")


 TO PREDICT (Statistical Inference)>")


