Download presentation
Presentation is loading. Please wait.

1
ISSUES TO ADDRESS... When we combine two elements... what equilibrium state do we get? In particular, if we specify... --a composition (e.g., wt%Cu - wt%Ni), and --a temperature (T) 1 then... How many phases do we get? What is the composition of each phase? How much of each phase do we get? PHASE DIAGRAMS
, and --a temperature (T) 1 then... How many phases do we get. What is the composition of each phase. How much of each phase do we get. PHASE DIAGRAMS.")
2
2 Solubility Limit: Max concentration for which only a solution occurs. Ex: Phase Diagram: Water-Sugar System Question: What is the solubility limit at 20C? Answer: 65wt% sugar. If C o < 65wt% sugar: sugar If C o > 65wt% sugar: syrup + sugar. Solubility limit increases with T: e.g., if T = 100C, solubility limit = 80wt% sugar. Adapted from Fig. 9.1, Callister 6e. THE SOLUBILITY LIMIT

3
33 Components: The elements or compounds which are mixed initially (e.g., Al and Cu) Phases: The physically and chemically distinct material regions that result (e.g., and ). Aluminum- Copper Alloy Adapted from Fig. 9.0, Callister 3e. COMPONENTS AND PHASES

4
4 Changing T can change # of phases: path A to B. Changing C o can change # of phases: path B to D. water- sugar system Adapted from Fig. 9.1, Callister 6e. EFFECT OF T & COMPOSITION (C o )
.")
5
5 Tell us about phases as function of T, C o, P. For this course: --binary systems: just 2 components. --independent variables: T and C o (P = 1atm is always used). Phase Diagram for Cu-Ni system Adapted from Fig. 9.2(a), Callister 6e. (Fig. 9.2(a) is adapted from Phase Diagrams of Binary Nickel Alloys, P. Nash (Ed.), ASM International, Materials Park, OH (1991). PHASE DIAGRAMS
. Phase Diagram for Cu-Ni system Adapted from Fig. 9.2(a), Callister 6e. (Fig. 9.2(a) is adapted from Phase Diagrams of Binary Nickel Alloys, P. Nash (Ed.), ASM International, Materials Park, OH (1991). PHASE DIAGRAMS.")
6
6 Rule 1: If we know T and C o, then we know: --the # and types of phases present. Examples: Cu-Ni phase diagram Adapted from Fig. 9.2(a), Callister 6e. (Fig. 9.2(a) is adapted from Phase Diagrams of Binary Nickel Alloys, P. Nash (Ed.), ASM International, Materials Park, OH, 1991). PHASE DIAGRAMS: # and types of phases
, Callister 6e. (Fig. 9.2(a) is adapted from Phase Diagrams of Binary Nickel Alloys, P. Nash (Ed.), ASM International, Materials Park, OH, 1991). PHASE DIAGRAMS: # and types of phases.")
7
7 Rule 2: If we know T and C o, then we know: --the composition of each phase. Examples: Cu-Ni system Adapted from Fig. 9.2(b), Callister 6e. (Fig. 9.2(b) is adapted from Phase Diagrams of Binary Nickel Alloys, P. Nash (Ed.), ASM International, Materials Park, OH, 1991.) PHASE DIAGRAMS: composition of phases
, Callister 6e. (Fig. 9.2(b) is adapted from Phase Diagrams of Binary Nickel Alloys, P. Nash (Ed.), ASM International, Materials Park, OH, 1991.) PHASE DIAGRAMS: composition of phases.")
8
8 Rule 3: If we know T and C o, then we know: --the amount of each phase (given in wt%). Cu-Ni system Examples: = 27wt% Adapted from Fig. 9.2(b), Callister 6e. (Fig. 9.2(b) is adapted from Phase Diagrams of Binary Nickel Alloys, P. Nash (Ed.), ASM International, Materials Park, OH, 1991.) PHASE DIAGRAMS: weight fractions of phases
, Callister 6e. (Fig. 9.2(b) is adapted from Phase Diagrams of Binary Nickel Alloys, P. Nash (Ed.), ASM International, Materials Park, OH, 1991.) PHASE DIAGRAMS: weight fractions of phases.")
9
Sum of weight fractions: 9 Conservation of mass (Ni): Combine above equations: A geometric interpretation: THE LEVER RULE: A PROOF
: Combine above equations: A geometric interpretation: THE LEVER RULE: A PROOF")
10
11 C changes as we solidify. Cu-Ni case: Fast rate of cooling: Cored structure Slow rate of cooling: Equilibrium structure First to solidify has C = 46wt%Ni. Last to solidify has C = 35wt%Ni. CORED VS EQUILIBRIUM PHASES

11
12 Effect of solid solution strengthening on: --Tensile strength (TS)--Ductility (%EL,%AR) --Peak as a function of C o --Min. as a function of C o Adapted from Fig. 9.5(a), Callister 6e.Adapted from Fig. 9.5(b), Callister 6e. MECHANICAL PROPERTIES: Cu-Ni System
, Callister 6e.Adapted from Fig. 9.5(b), Callister 6e. MECHANICAL PROPERTIES: Cu-Ni System.")
13
13 2 components has a special composition with a min. melting T. Adapted from Fig. 9.6, Callister 6e. (Fig. 9.6 adapted from Binary Phase Diagrams, 2nd ed., Vol. 1, T.B. Massalski (Editor-in-Chief), ASM International, Materials Park, OH, 1990.) Cu-Ag system BINARY-EUTECTIC SYSTEMS
, ASM International, Materials Park, OH, 1990.) Cu-Ag system BINARY-EUTECTIC SYSTEMS.")
14
14 For a 40wt%Sn-60wt%Pb alloy at 150C, find... --the phases present: + --the compositions of the phases: Pb-Sn system Adapted from Fig. 9.7, Callister 6e. (Fig. 9.7 adapted from Binary Phase Diagrams, 2nd ed., Vol. 3, T.B. Massalski (Editor-in-Chief), ASM International, Materials Park, OH, 1990.) EX: Pb-Sn EUTECTIC SYSTEM (1)
, ASM International, Materials Park, OH, 1990.) EX: Pb-Sn EUTECTIC SYSTEM (1).")
15
For a 40wt%Sn-60wt%Pb alloy at 150C, find... --the phases present: + --the compositions of the phases: C = 11wt%Sn C = 99wt%Sn --the relative amounts of each phase: 15 Pb-Sn system Adapted from Fig. 9.7, Callister 6e. (Fig. 9.7 adapted from Binary Phase Diagrams, 2nd ed., Vol. 3, T.B. Massalski (Editor-in-Chief), ASM International, Materials Park, OH, 1990.) EX: Pb-Sn EUTECTIC SYSTEM (2)
, ASM International, Materials Park, OH, 1990.) EX: Pb-Sn EUTECTIC SYSTEM (2).")
16
16 C o < 2wt%Sn Result: --polycrystal of grains. Adapted from Fig. 9.9, Callister 6e. MICROSTRUCTURES IN EUTECTIC SYSTEMS-I

17
17 2wt%Sn < C o < 18.3wt%Sn Result: -- polycrystal with fine crystals. Pb-Sn system Adapted from Fig. 9.10, Callister 6e. MICROSTRUCTURES IN EUTECTIC SYSTEMS-II

18
18 C o = C E Result: Eutectic microstructure --alternating layers of and crystals. Pb-Sn system Adapted from Fig. 9.11, Callister 6e. Adapted from Fig. 9.12, Callister 6e. (Fig. 9.12 from Metals Handbook, Vol. 9, 9th ed., Metallography and Microstructures, American Society for Metals, Materials Park, OH, 1985.) MICROSTRUCTURES IN EUTECTIC SYSTEMS-III
 MICROSTRUCTURES IN EUTECTIC SYSTEMS-III.")
19
19 Pb-Sn system 18.3wt%Sn < C o < 61.9wt%Sn Result: crystals and a eutectic microstructure Adapted from Fig. 9.14, Callister 6e. MICROSTRUCTURES IN EUTECTIC SYSTEMS-IV

20
20 Adapted from Fig. 9.7, Callister 6e. (Fig. 9.7 adapted from Binary Phase Diagrams, 2nd ed., Vol. 3, T.B. Massalski (Editor-in-Chief), ASM International, Materials Park, OH, 1990.) (Figs. 9.12 and 9.15 from Metals Handbook, 9th ed., Vol. 9, Metallography and Microstructures, American Society for Metals, Materials Park, OH, 1985.) Adapted from Fig. 9.15, Callister 6e. Adapted from Fig. 9.12, Callister 6e. Adapted from Fig. 9.15, Callister 6e. (Illustration only) HYPOEUTECTIC & HYPEREUTECTIC
, ASM International, Materials Park, OH, 1990.) (Figs and 9.15 from Metals Handbook, 9th ed., Vol. 9, Metallography and Microstructures, American Society for Metals, Materials Park, OH, 1985.) Adapted from Fig. 9.15, Callister 6e. Adapted from Fig. 9.12, Callister 6e. Adapted from Fig. 9.15, Callister 6e. (Illustration only) HYPOEUTECTIC & HYPEREUTECTIC.")
21
21 Adapted from Fig. 9.21,Callister 6e. (Fig. 9.21 adapted from Binary Alloy Phase Diagrams, 2nd ed., Vol. 1, T.B. Massalski (Ed.-in-Chief), ASM International, Materials Park, OH, 1990.) (Adapted from Fig. 9.24, Callister 6e. (Fig. 9.24 from Metals Handbook, 9th ed., Vol. 9, Metallography and Microstructures, American Society for Metals, Materials Park, OH, 1985.) IRON-CARBON (Fe-C) PHASE DIAGRAM
, ASM International, Materials Park, OH, 1990.) (Adapted from Fig. 9.24, Callister 6e. (Fig from Metals Handbook, 9th ed., Vol. 9, Metallography and Microstructures, American Society for Metals, Materials Park, OH, 1985.) IRON-CARBON (Fe-C) PHASE DIAGRAM.")
22
22 Adapted from Figs. 9.21 and 9.26,Callister 6e. (Fig. 9.21 adapted from Binary Alloy Phase Diagrams, 2nd ed., Vol. 1, T.B. Massalski (Ed.-in- Chief), ASM International, Materials Park, OH, 1990.) Adapted from Fig. 9.27,Callister 6e. (Fig. 9.27 courtesy Republic Steel Corporation.) HYPOEUTECTOID STEEL
, ASM International, Materials Park, OH, 1990.) Adapted from Fig. 9.27,Callister 6e. (Fig courtesy Republic Steel Corporation.) HYPOEUTECTOID STEEL.")
23
23 Adapted from Figs. 9.21 and 9.29,Callister 6e. (Fig. 9.21 adapted from Binary Alloy Phase Diagrams, 2nd ed., Vol. 1, T.B. Massalski (Ed.-in- Chief), ASM International, Materials Park, OH, 1990.) Adapted from Fig. 9.30,Callister 6e. (Fig. 9.30 copyright 1971 by United States Steel Corporation.) HYPEREUTECTOID STEEL
, ASM International, Materials Park, OH, 1990.) Adapted from Fig. 9.30,Callister 6e. (Fig copyright 1971 by United States Steel Corporation.) HYPEREUTECTOID STEEL.")
24
24 T eutectoid changes: C eutectoid changes: Adapted from Fig. 9.31,Callister 6e. (Fig. 9.31 from Edgar C. Bain, Functions of the Alloying Elements in Steel, American Society for Metals, 1939, p. 127.) Adapted from Fig. 9.32,Callister 6e. (Fig. 9.32 from Edgar C. Bain, Functions of the Alloying Elements in Steel, American Society for Metals, 1939, p. 127.) ALLOYING STEEL WITH MORE ELEMENTS
 Adapted from Fig. 9.32,Callister 6e. (Fig from Edgar C. Bain, Functions of the Alloying Elements in Steel, American Society for Metals, 1939, p. 127.) ALLOYING STEEL WITH MORE ELEMENTS.")
25
Need a material to use in high temperature furnaces. Consider Silica (SiO 2 ) - Alumina (Al 2 O 3 ) system. Phase diagram shows: mullite, alumina, and crystobalite (made up of SiO 2 ) tetrahedra as candidate refractories. 25 Adapted from Fig. 12.27, Callister 6e. (Fig. 12.27 is adapted from F.J. Klug and R.H. Doremus, "Alumina Silica Phase Diagram in the Mullite Region", J. American Ceramic Society 70(10), p. 758, 1987.) APPLICATION: REFRACTORIES
 - Alumina (Al 2 O 3 ) system. Phase diagram shows: mullite, alumina, and crystobalite (made up of SiO 2 ) tetrahedra as candidate refractories. 25 Adapted from Fig , Callister 6e. (Fig is adapted from F.J. Klug and R.H. Doremus, Alumina Silica Phase Diagram in the Mullite Region , J. American Ceramic Society 70(10), p. 758, 1987.) APPLICATION: REFRACTORIES.")
33
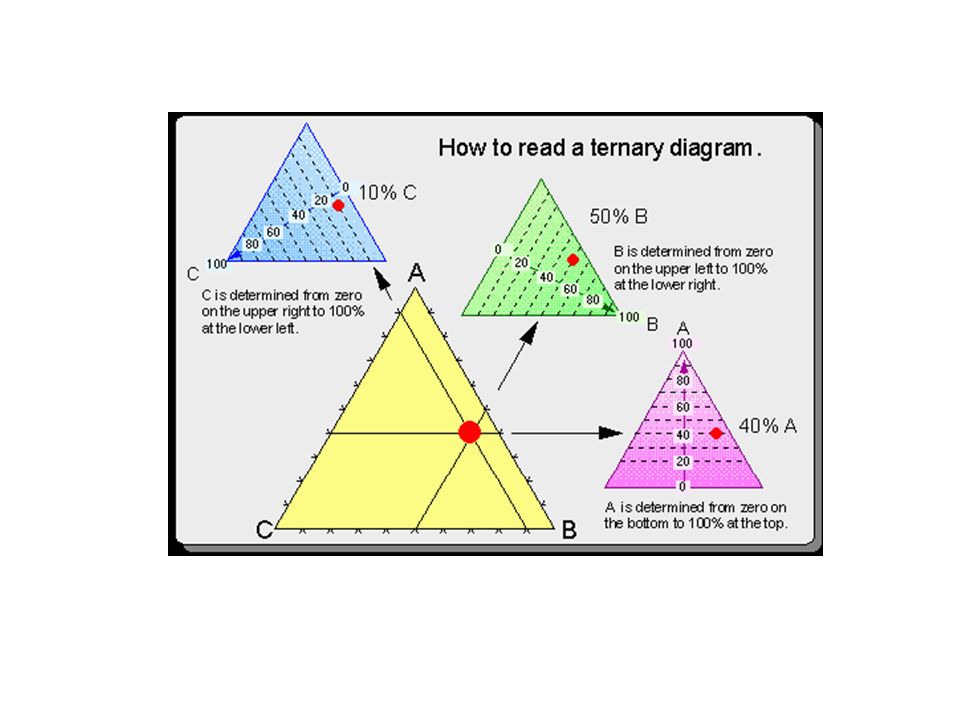
1. 60% A | 20% B | 20% C = 100% 2. 25% A | 40% B | 35% C = 100% 3. 10% A | 70% B | 20% C = 100% 4. 0.0% A | 25% B | 75% C = 100%

34
5. ? % A | ? % B | ? % C = 100% 6. ? % A | ? % B | ? % C = 100% 7. ? % A | ? % B | ? % C = 100% 8. ? % A | ? % B | ? % C = 100%

35
5. 70 % A | 20 % B | 10 % C = 100% 6. 60 % A | 40 % B | 0 % C = 100% 7. 30 % A | 50 % B | 20 % C = 100% 8. 10 % A | 15 % B | 75 % C = 100%

36
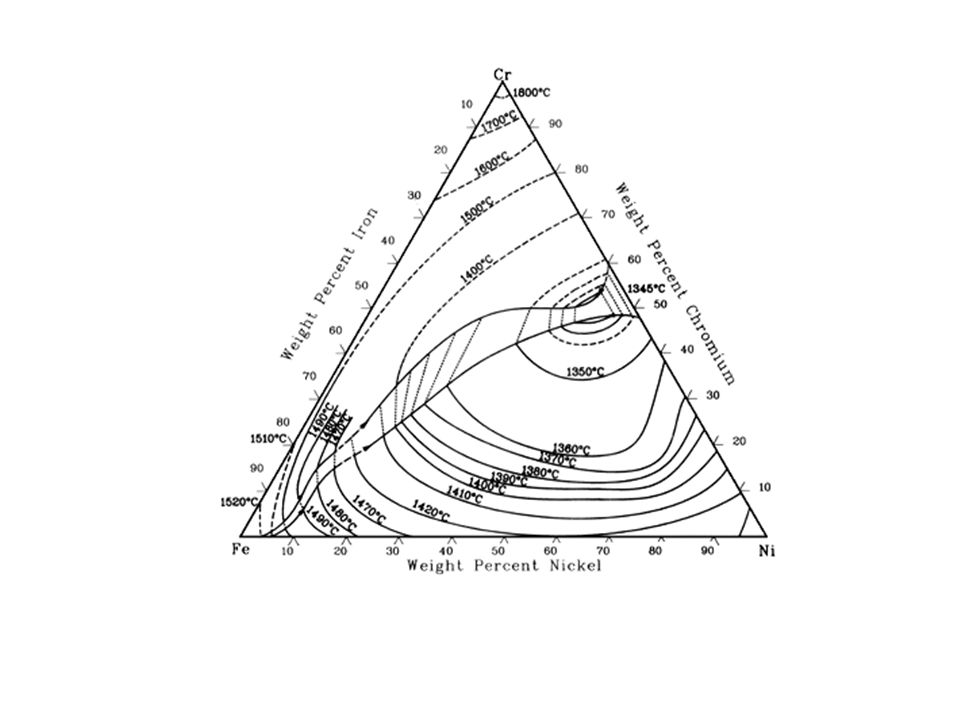
Figure 2: Stainless steel phase diagram at 900 degrees Celsius

48
26 Phase diagrams are useful tools to determine: --the number and types of phases, --the wt% of each phase, --and the composition of each phase for a given T and composition of the system. Alloying to produce a solid solution usually --increases the tensile strength (TS) --decreases the ductility. Binary eutectics and binary eutectoids allow for a range of microstructures. SUMMARY
 --decreases the ductility. Binary eutectics and binary eutectoids allow for a range of microstructures. SUMMARY.")
Similar presentations


 0 20 4060 80100 Co=Composition (wt% sugar) L (liquid solution.>")


