Download presentation
Presentation is loading. Please wait.

1
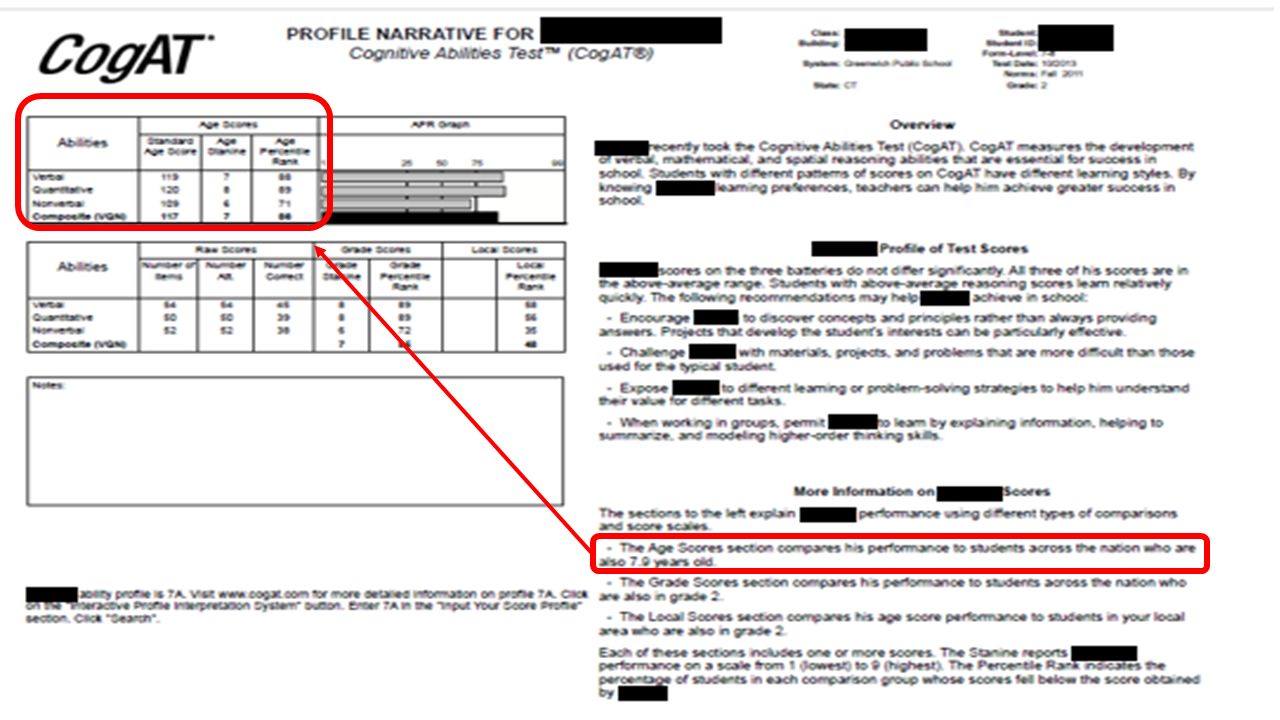
Reading Your Child’s Cognitive Abilities Test Profile Bonnie O’Regan Advanced Learning Program Facilitator Greenwich Public Schools February 5, 2014 (snowdate: February 18, 2014)
")
3
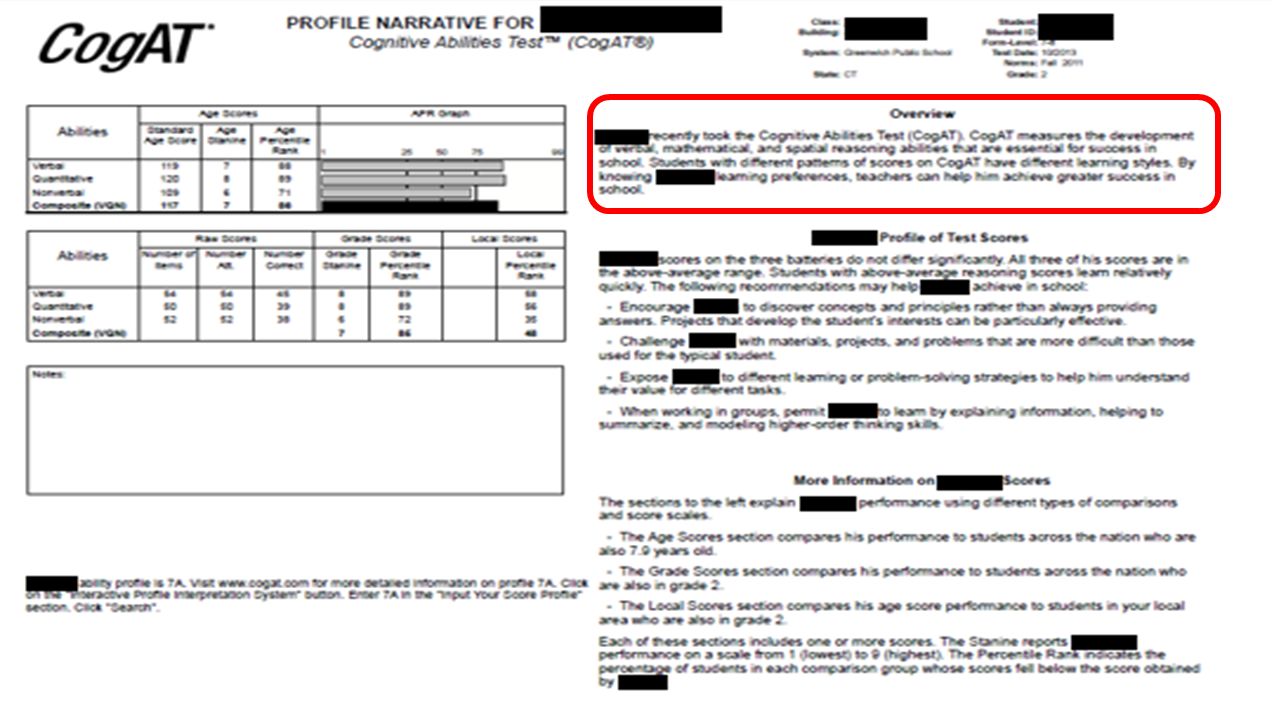
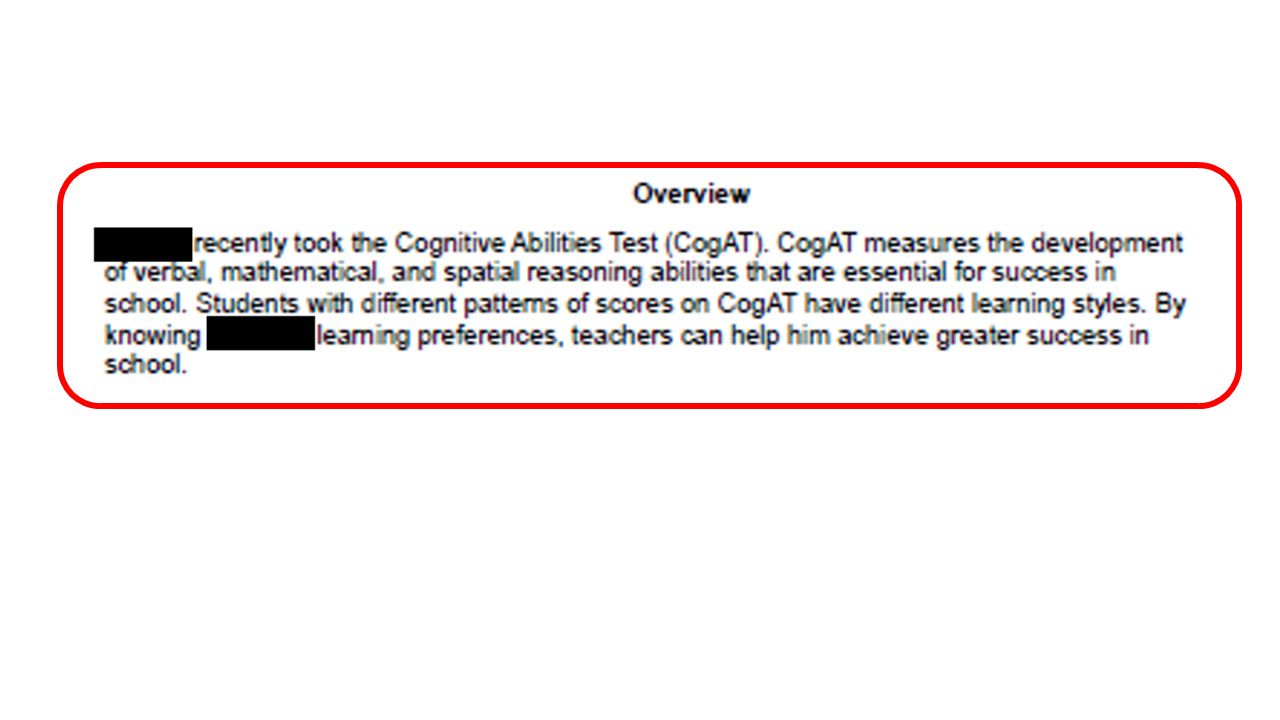
CogAT: Cognitive Abilities Test What is it? What information does it give us? How can we use this information?

6
Comprehending problem situations Detecting similarities and differences Making inferences Making deductions Classifying and categorizing objects, events, and other stimuli Creating and adapting problem- solving strategies Using familiar concepts and skills in new contexts CogAT measures important reasoning skills: Cognitive Abilities Test ™

7
CogAT measures three different cognitive abilities: Cognitive Abilities Test ™ Verbal BatteryQuantitative BatteryNonVerbal Battery Measures flexibility, fluency, and adaptability in reasoning with verbal materials and in solving verbal problems Measures flexibility and fluency in working with quantitative symbols and concepts and the student’s ability to discover relationships and to figure out a rule or principle that explains them Measures fluency and flexibility in reasoning with shapes and visual patterns. Facilitates the assessment of English learners or students whose verbal or mathematical experiences are limited.

8
CogAt and IQ Cognitive Abilities Test The CogAT is NOT an IQ test, but is a test of reasoning which is one of the variforms of intelligence It has a.79 correlation to IQ. The closer to 1.0 the better the correlation, so it has high correlation Reasoning abilities have substantial correlations with learning and problem solving, both in and out of school

9
Cognitive Abilities Test Verbal Ability – Best predictor of academic success Quantitative Ability – “number sense” ability to see relationship of numbers Nonverbal Ability – Best predictor of how fast a student learns

11
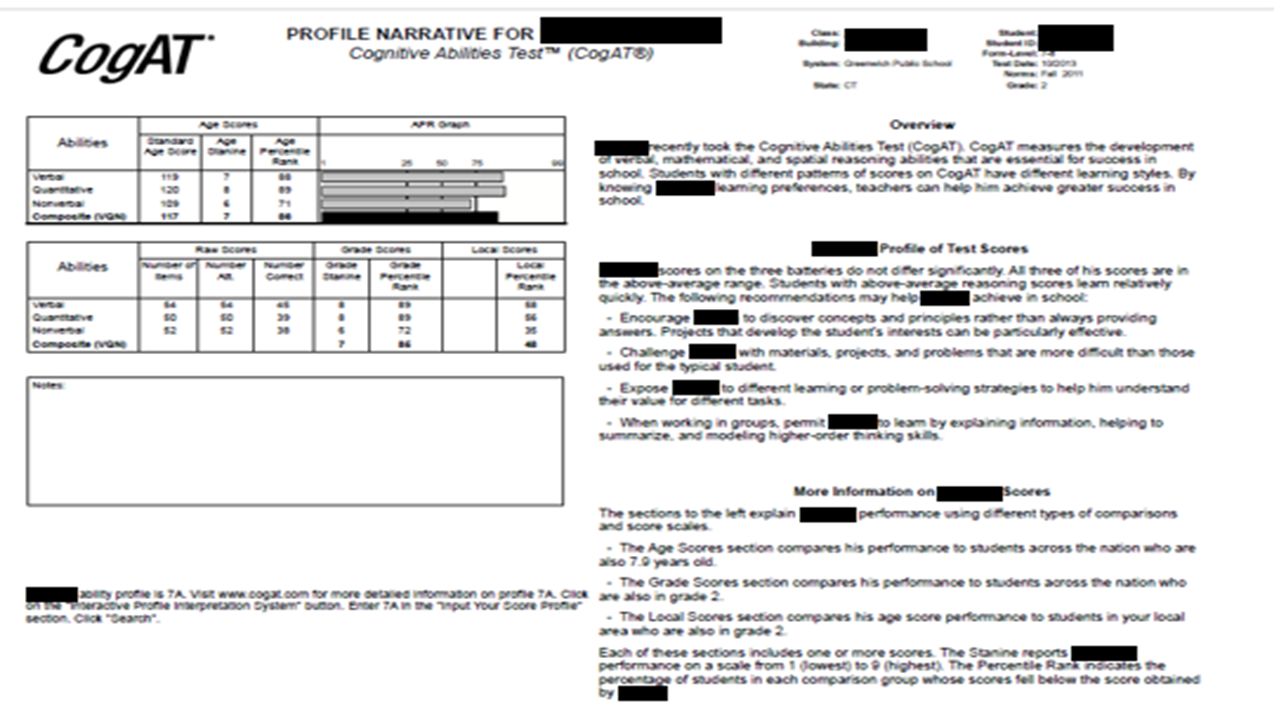
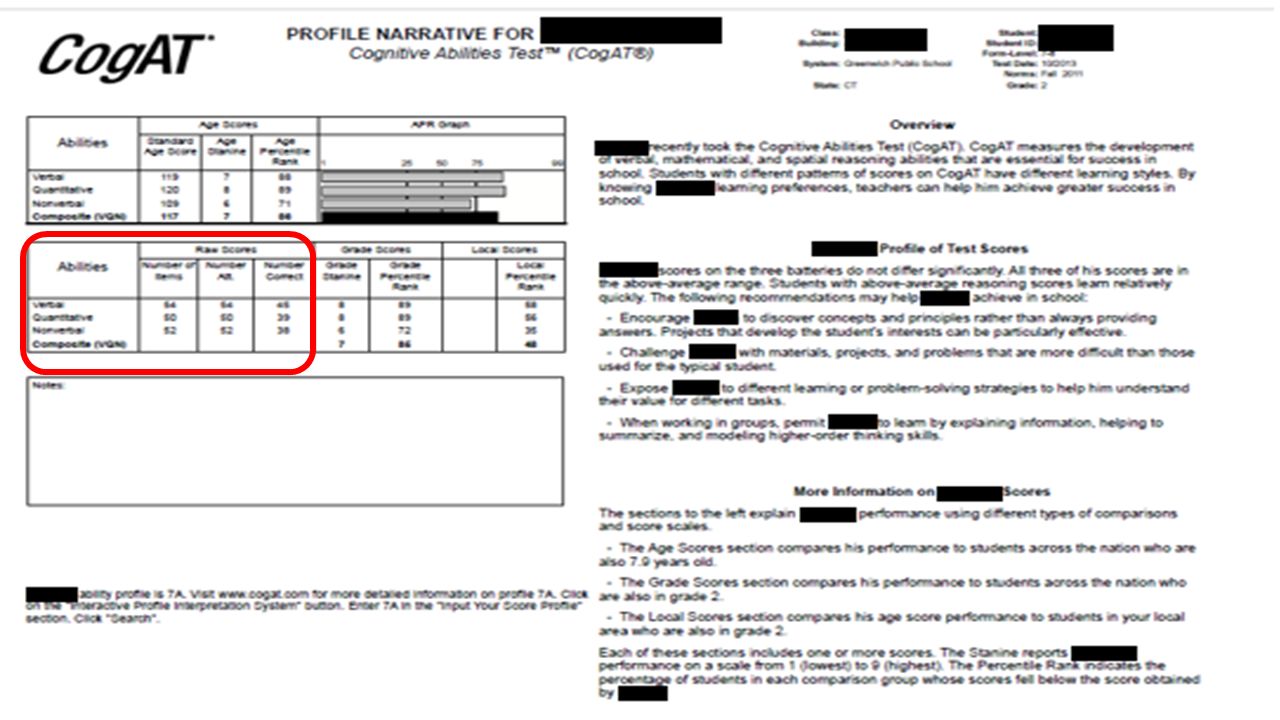
Raw Scores Number of Items = the number of questions on the subtests. Number Att. (attempted) = the number of questions the student answered. Number Correct = the total number of items the student answered correctly.
 = the number of questions the student answered. Number Correct = the total number of items the student answered correctly..")
13
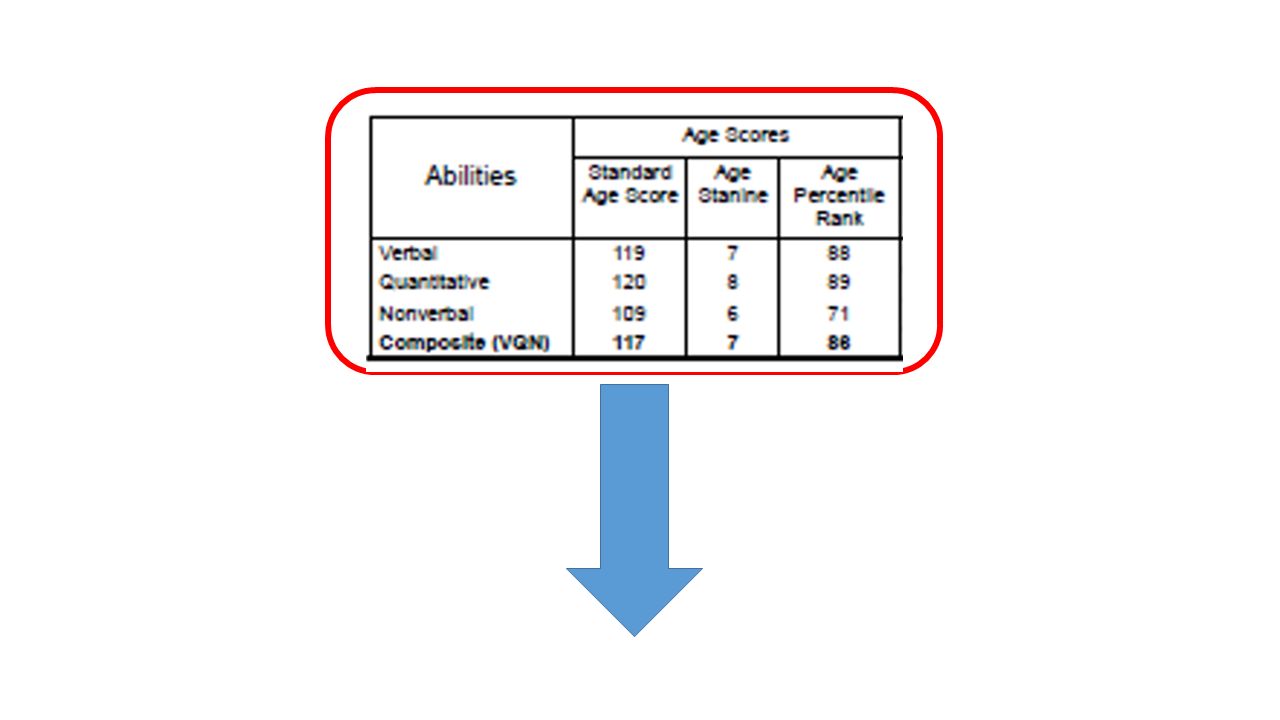
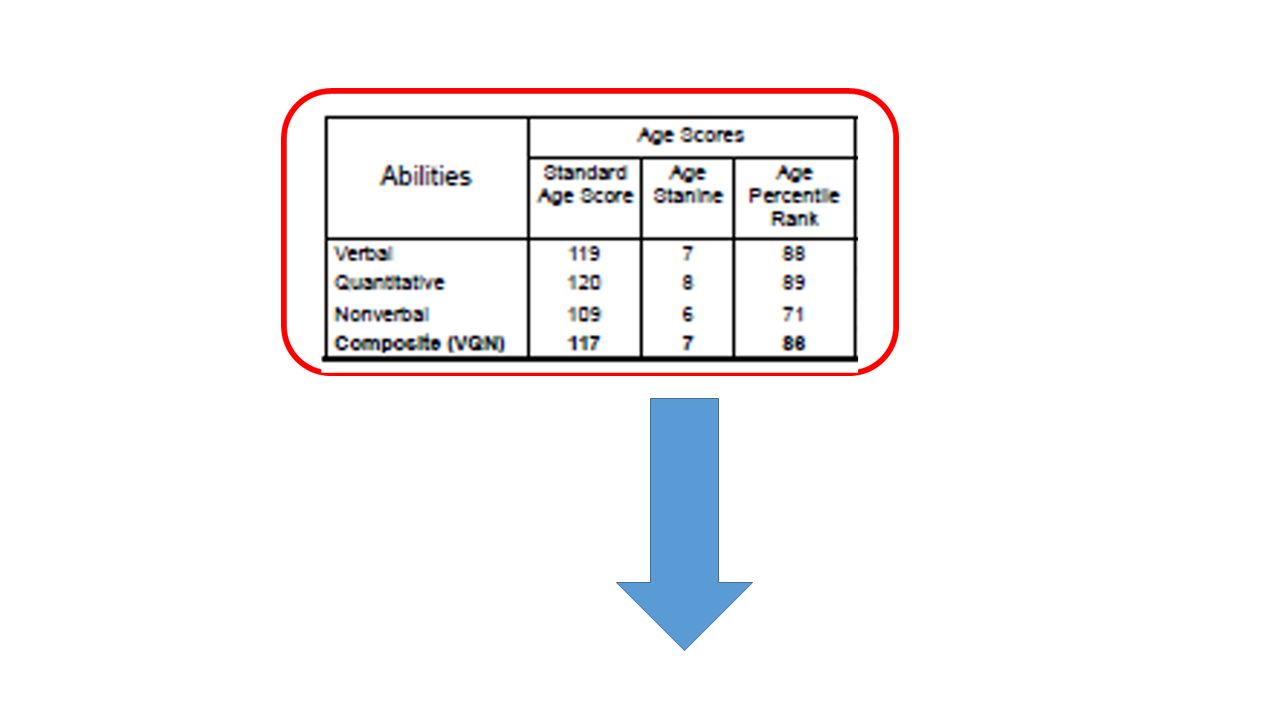
The CogAT allows comparisons of the performance of students with the performance of other students in the nation of the same age who took the same test.

16
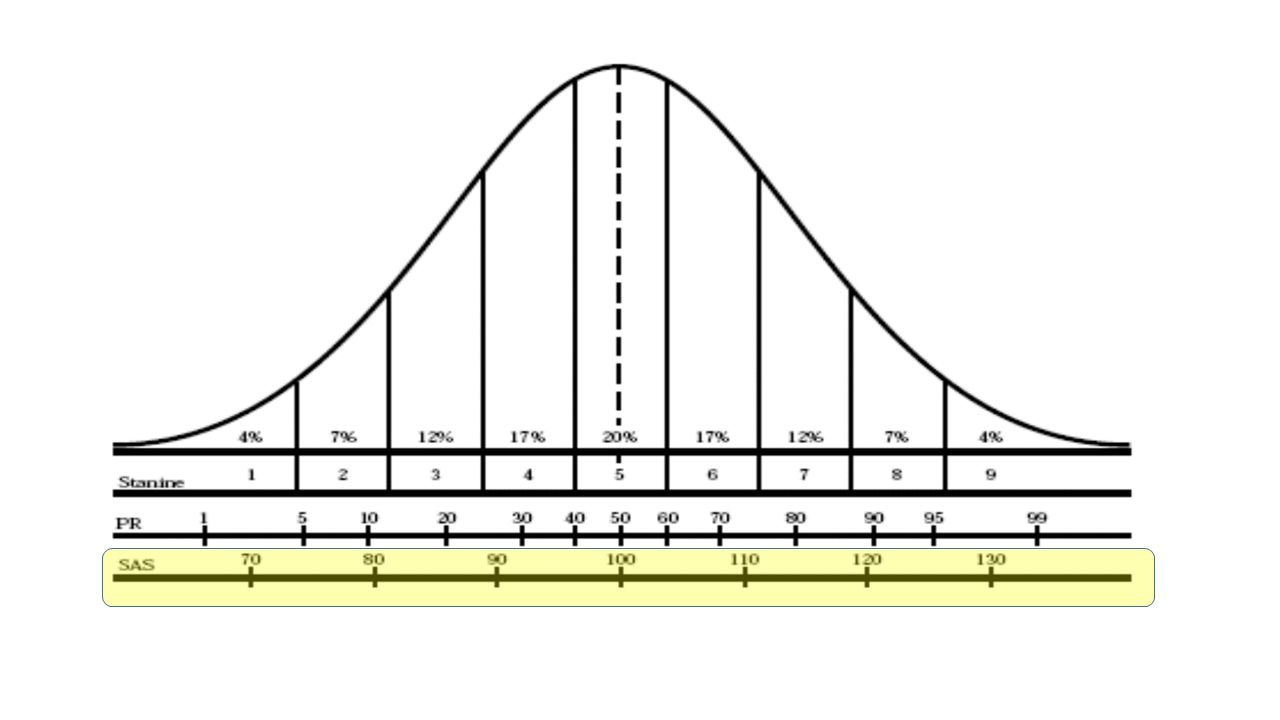
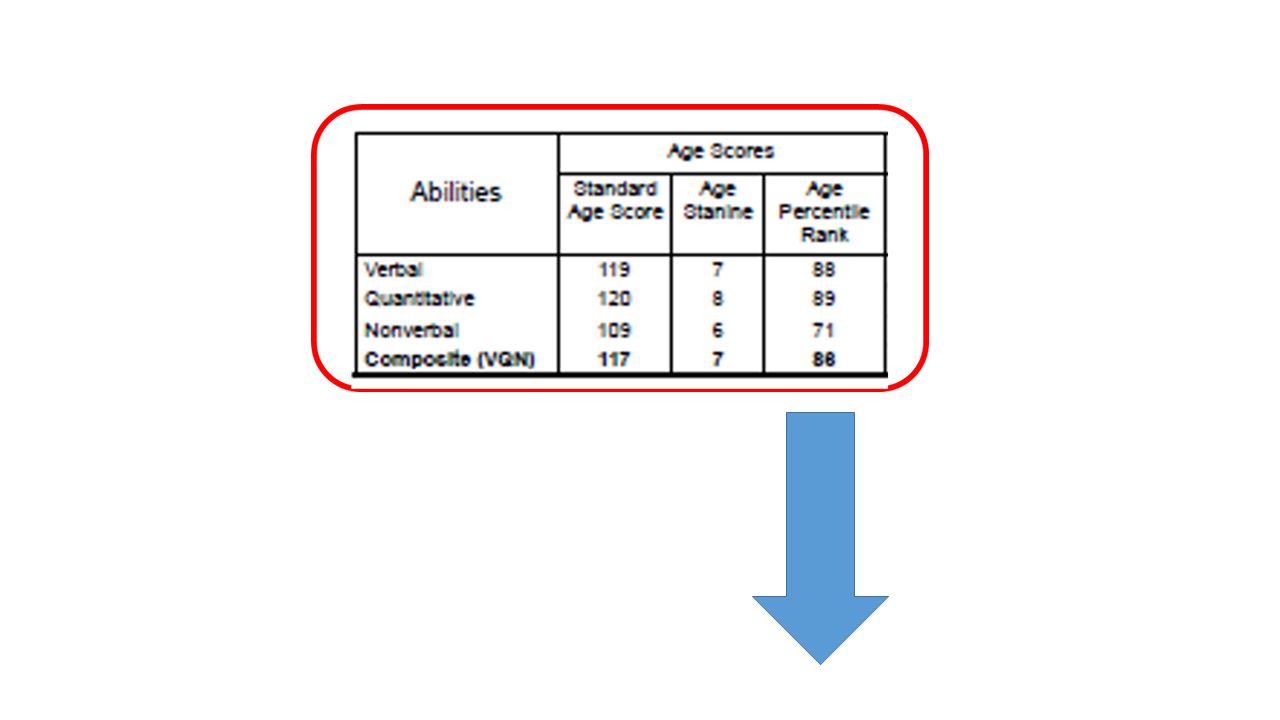
Standard Age Score (SAS) Cognitive LevelSAS Range Very High128-150+ Above Average112-127 Average89-111 Below Average73-88 Very Low50-72
 Cognitive LevelSAS Range Very High Above Average Average Below Average73-88 Very Low50-72")
19
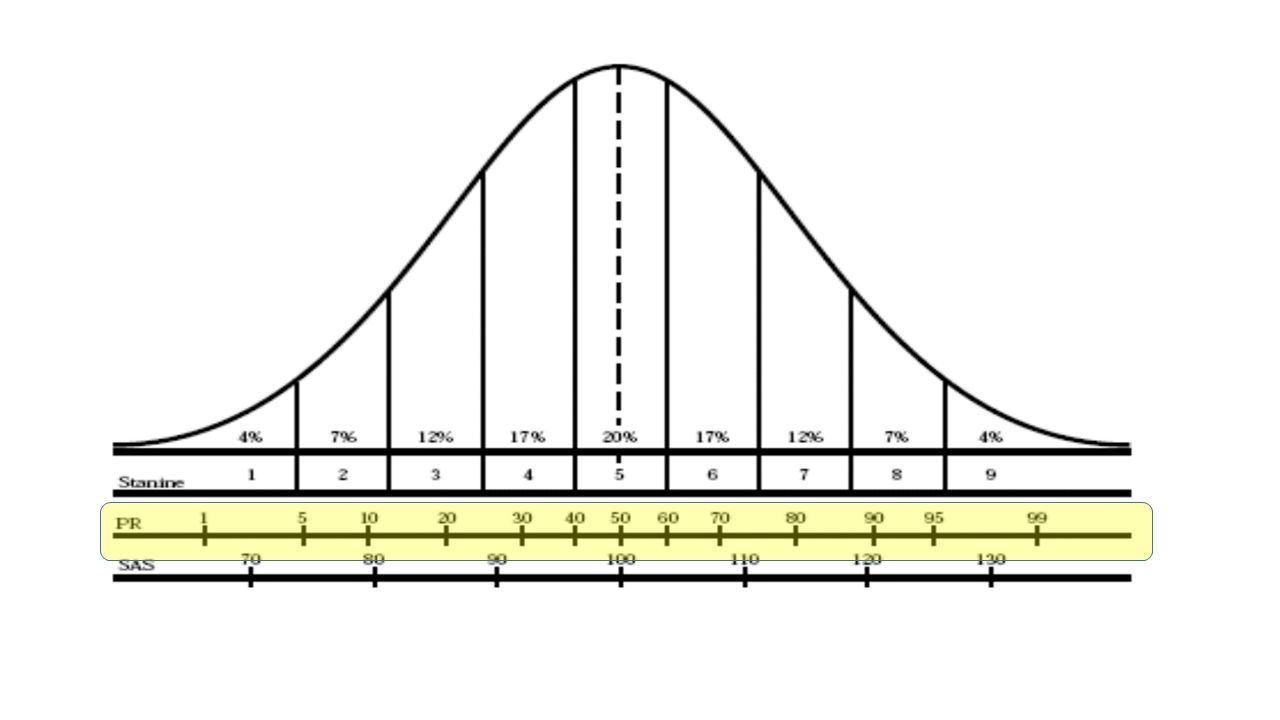
Stanines DescriptionStanine Range Very High9 Above Average7-8 Average4-6 Below Average2-3 Very Low1

22
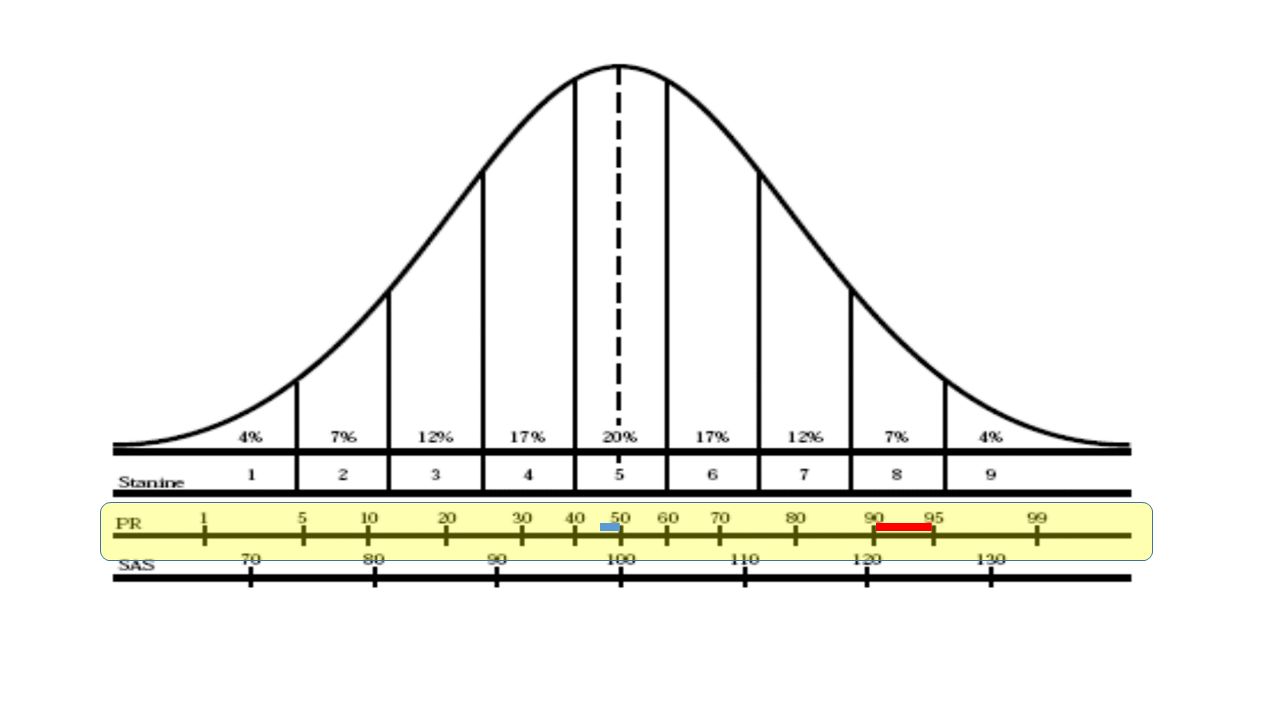
Understanding Percentile Ranks Juan’s results on a Verbal battery places him 88h from the bottom of his age mates. Juan, as an example, is a student in a group of exactly 100 students also 7.9 years old. A common way to evaluate a student’s performance is to compare it with the performances of some group. Because there are 100 students in his group, one can then say that Juan performed as well as or better than 88 percent of his classmates. Top of the class Bottom of the group The 88 is a PERCENTILE RANK because it represents a relative standing, i.e., it identifies what percentage of Juan’s age mates scored the same as or lower than him. 88th

25
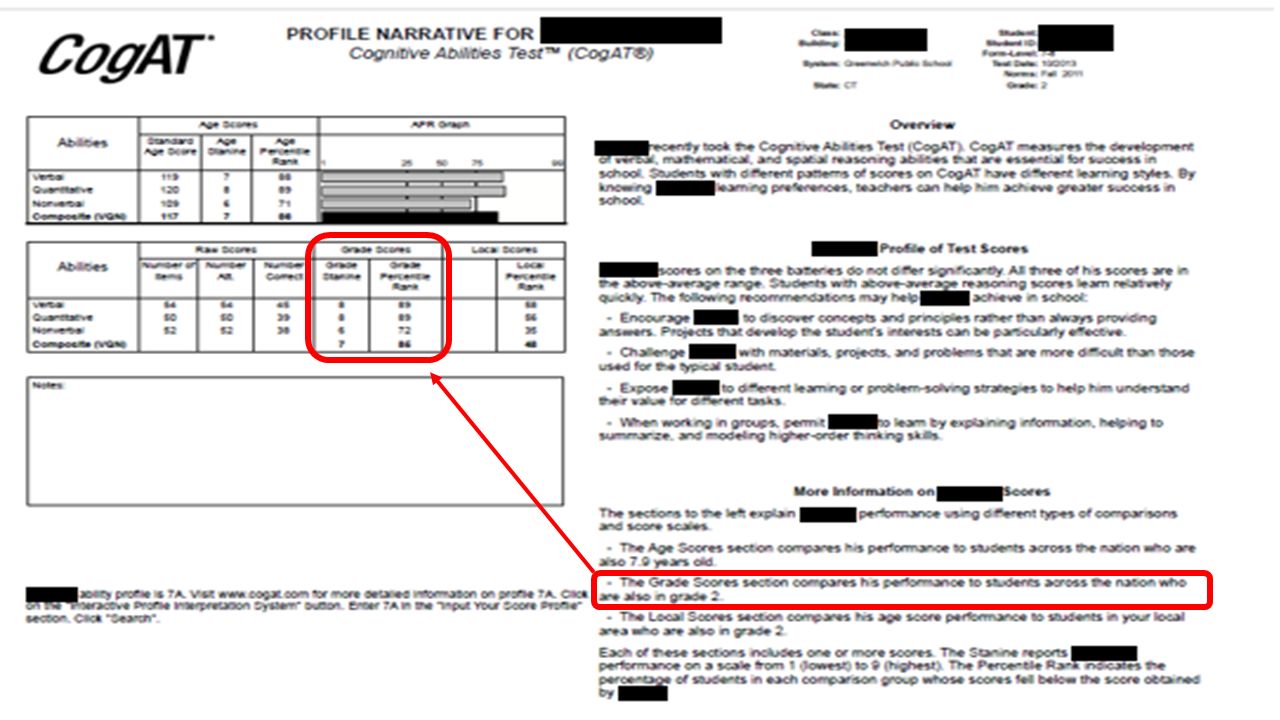
The CogAT allows comparisons of the performance of students with the performance of other students in the nation of the same grade who took the same test at the same time of year.

27
Juan’s results on a Verbal battery places him 88th from the bottom of his age mates and 89 th from the bottom of his grade mates Top of the class Bottom of the national group 88th 89th

28
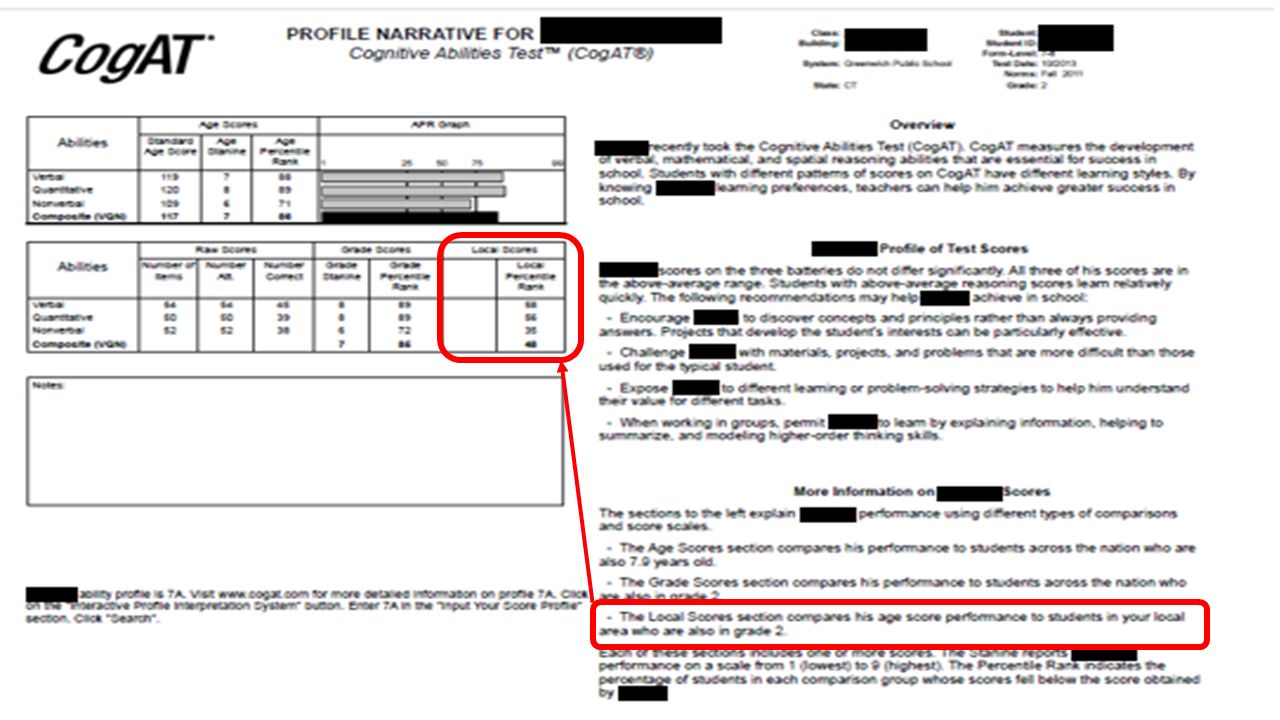
Understanding Local Percentile Ranks Now, Juan is only being compared to about 650 Grade 2 students in GPS. Juan’s performance on the verbal battery equaled or exceeded the performances of 52 percent of Grade 2 students locally. Even though Juan scored at the 89th national percentile rank on the Verbal Battery, he will have a different local percentile rank because he is being compared to a different group of students Top of the district Bottom of the district 58th

29
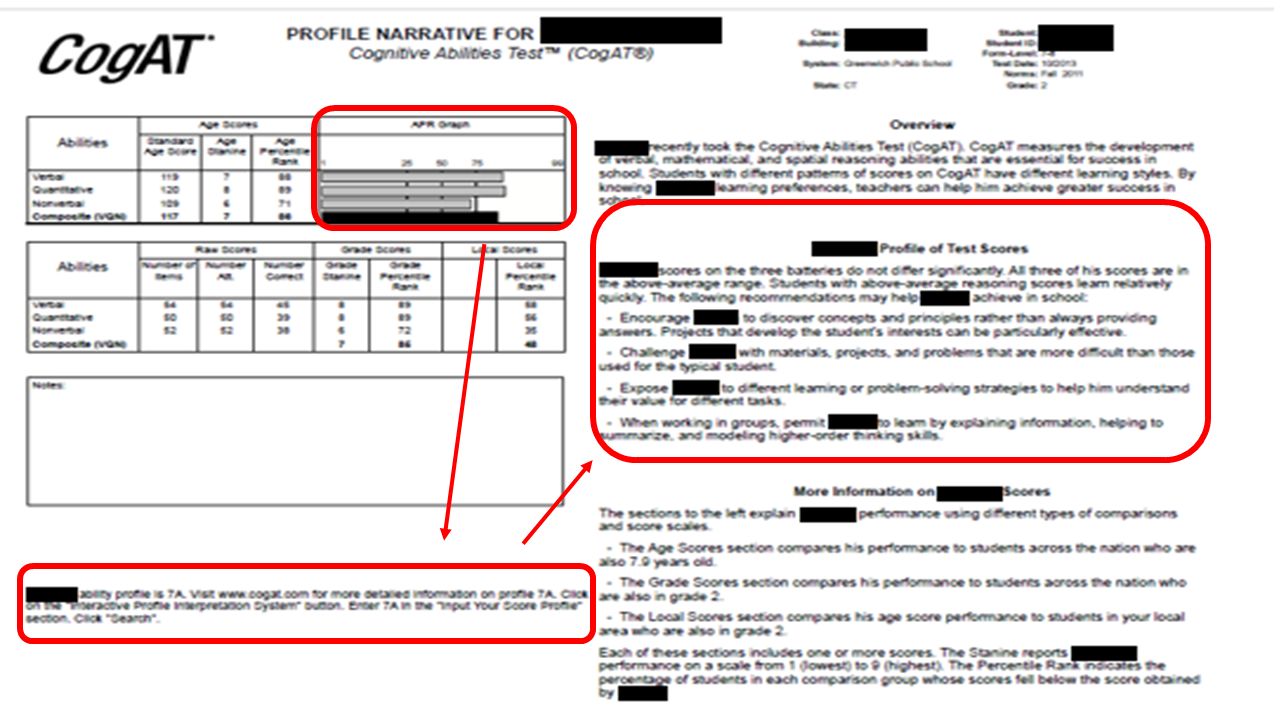
Standard Age Score (SAS) Cognitive Level National SAS Range Greenwich SAS Range Very High128-150+ 139-150+ Above Average112-127 129-138 Average89-111 110-128 Below Average73-88 95-109 Very Low50-72 73-94
 Cognitive Level National SAS Range Greenwich SAS Range Very High Above Average Average Below Average Very Low")
32
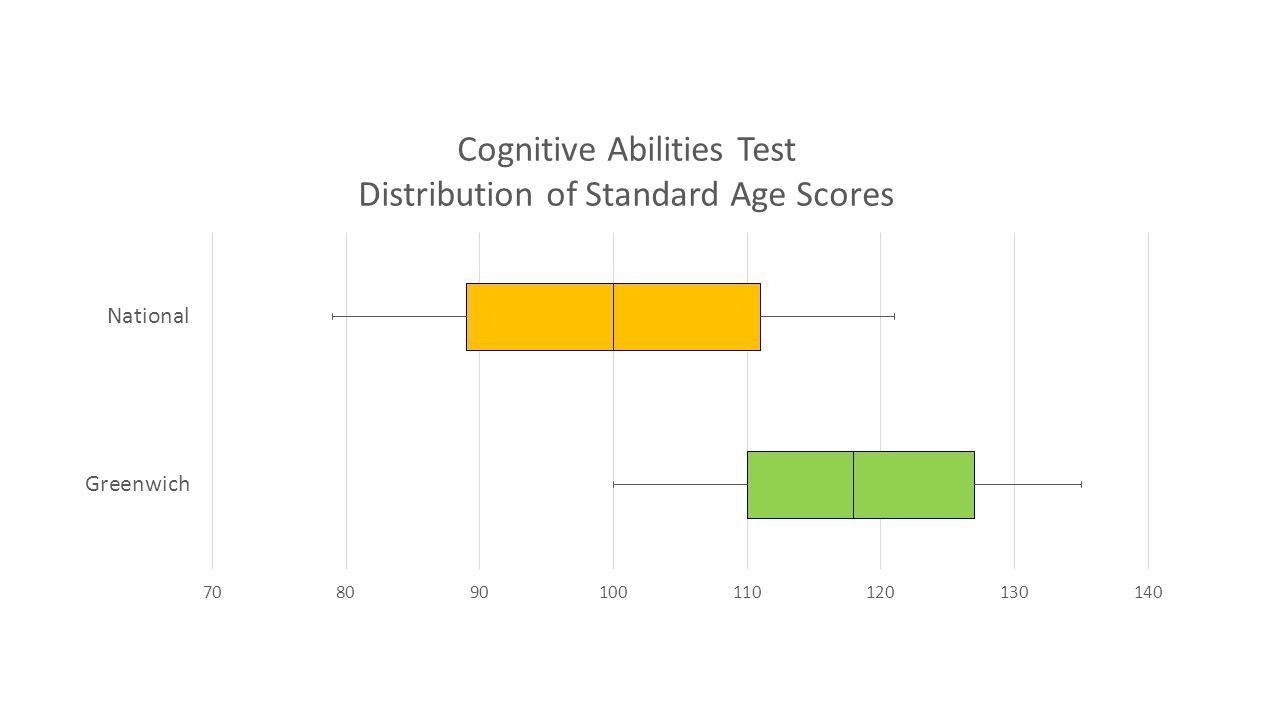
A bar graph of the student’s scores appears on the score report as a visual representation of the student’s percentile score.

33
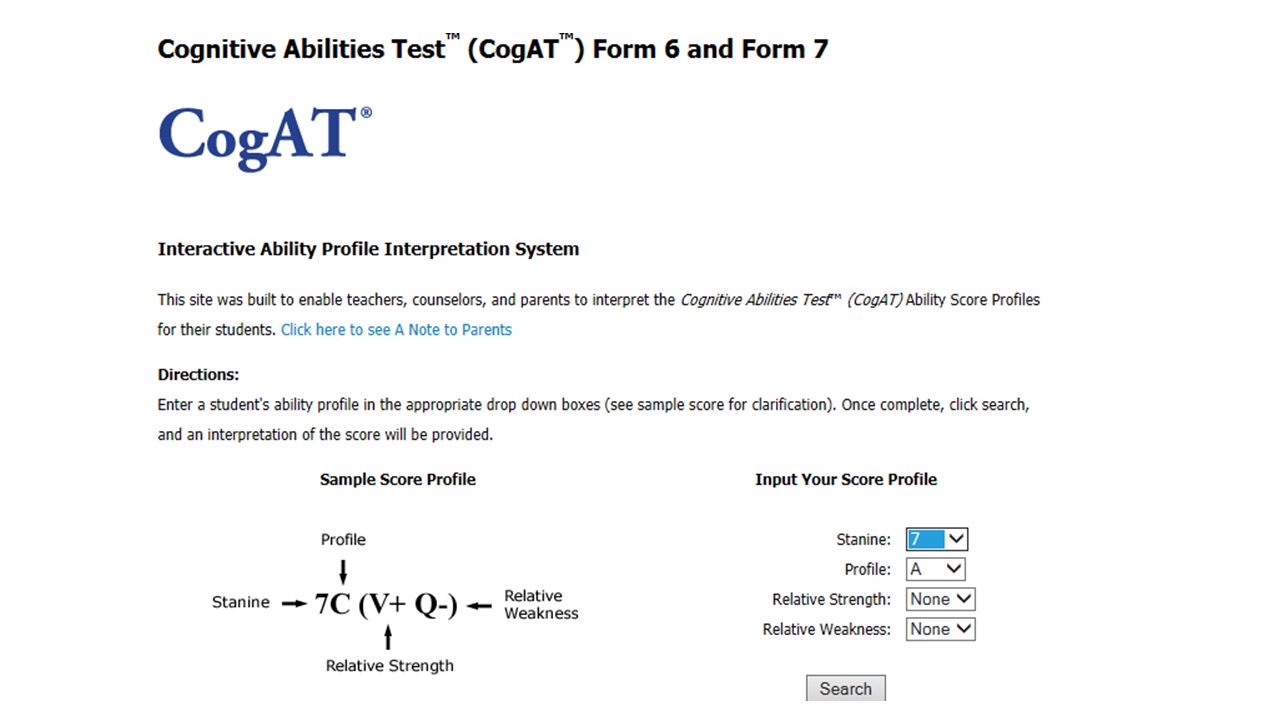
Ability Profile System

38
This report shows the results of testing for your child at one particular time on one particular assessment. It is important to always look for multiple pieces of evidence when using assessment data to make decisions.

Similar presentations


 A Parent Guide.>")

>")


 and AIG Identification Process Understanding the Student Profile and its Use for Educational Planning and AIG Identification.>")


267-1072>")


 EDU 330: Educational Psychology Daniel Moos.>")